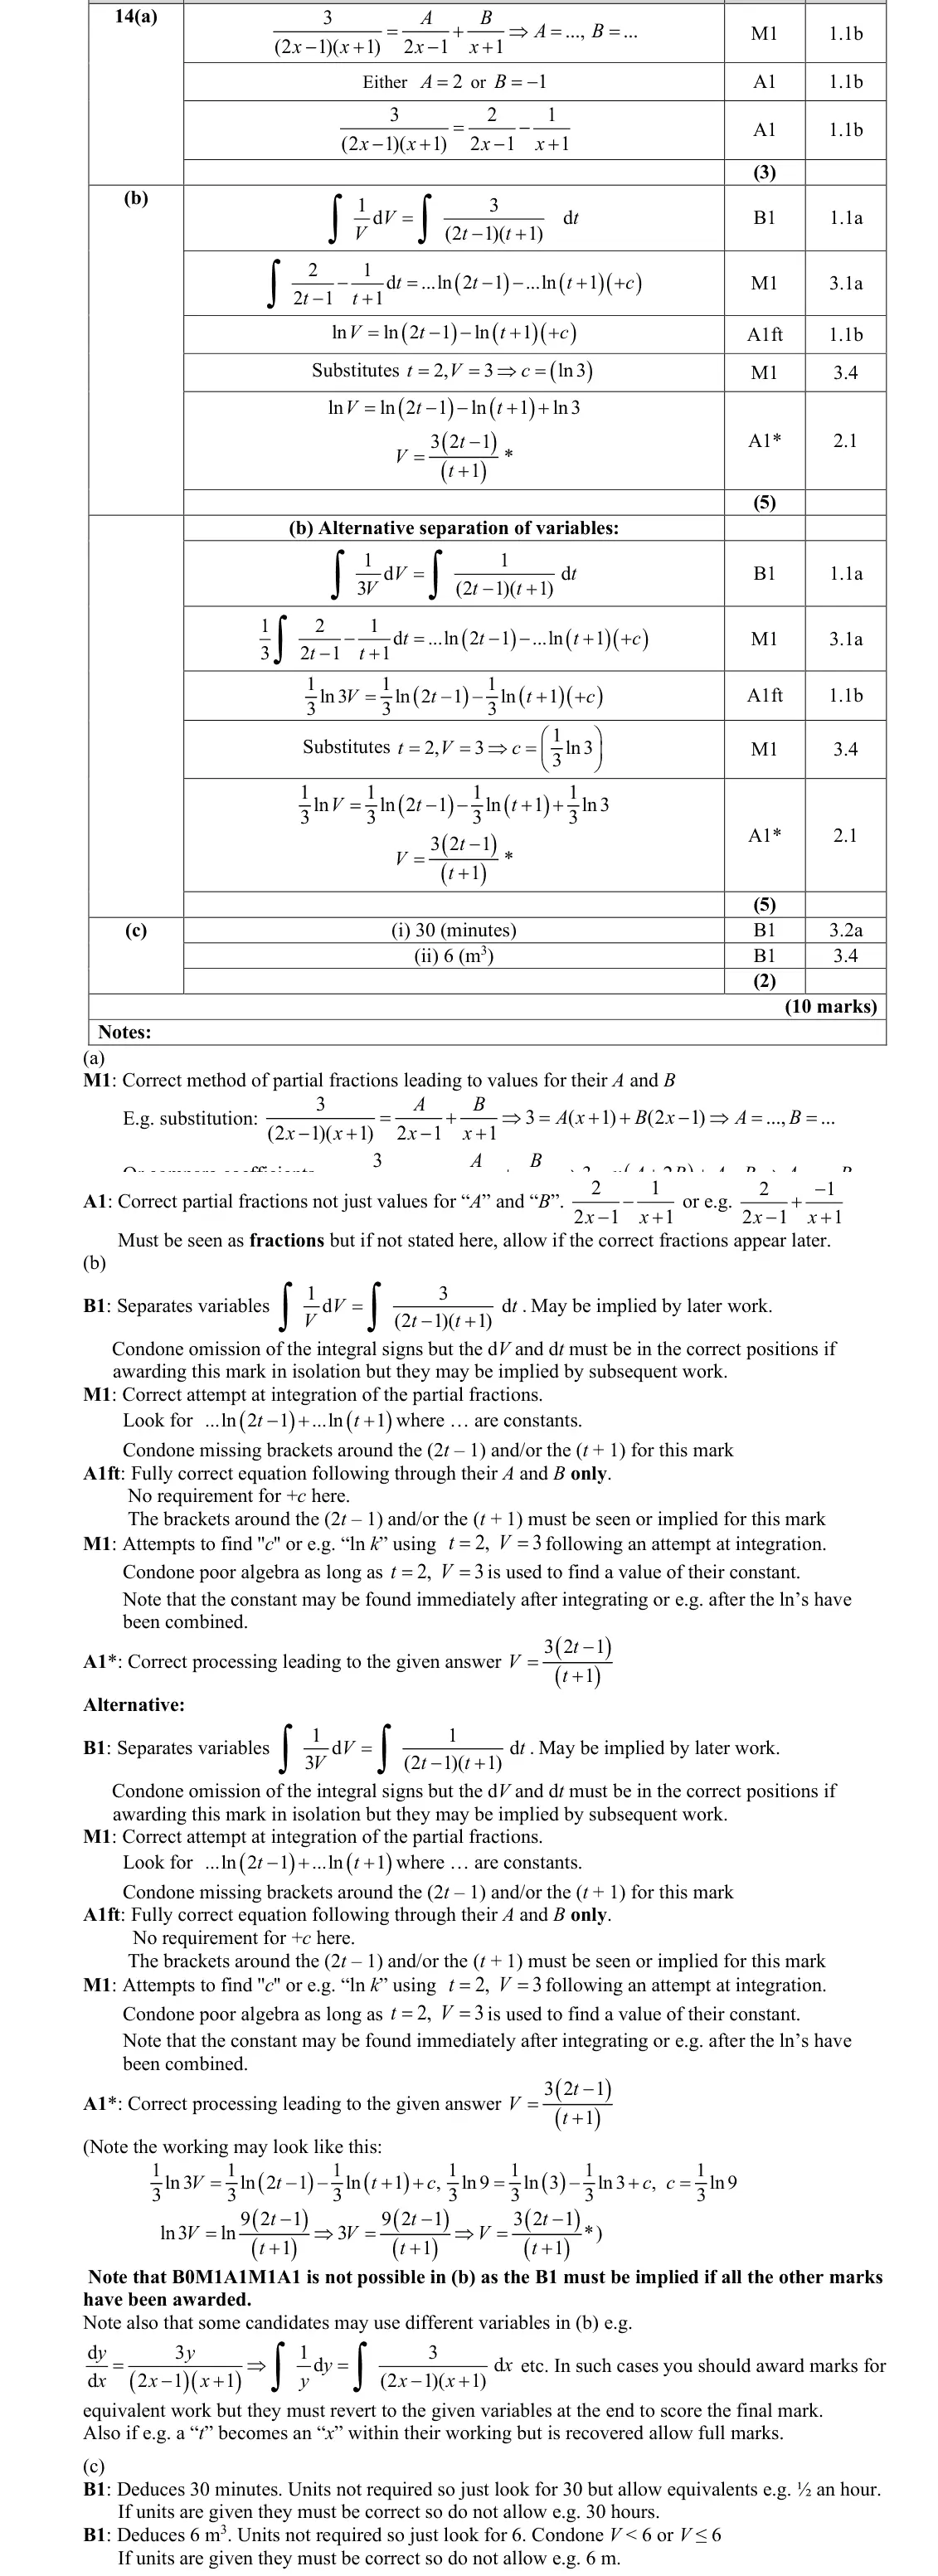
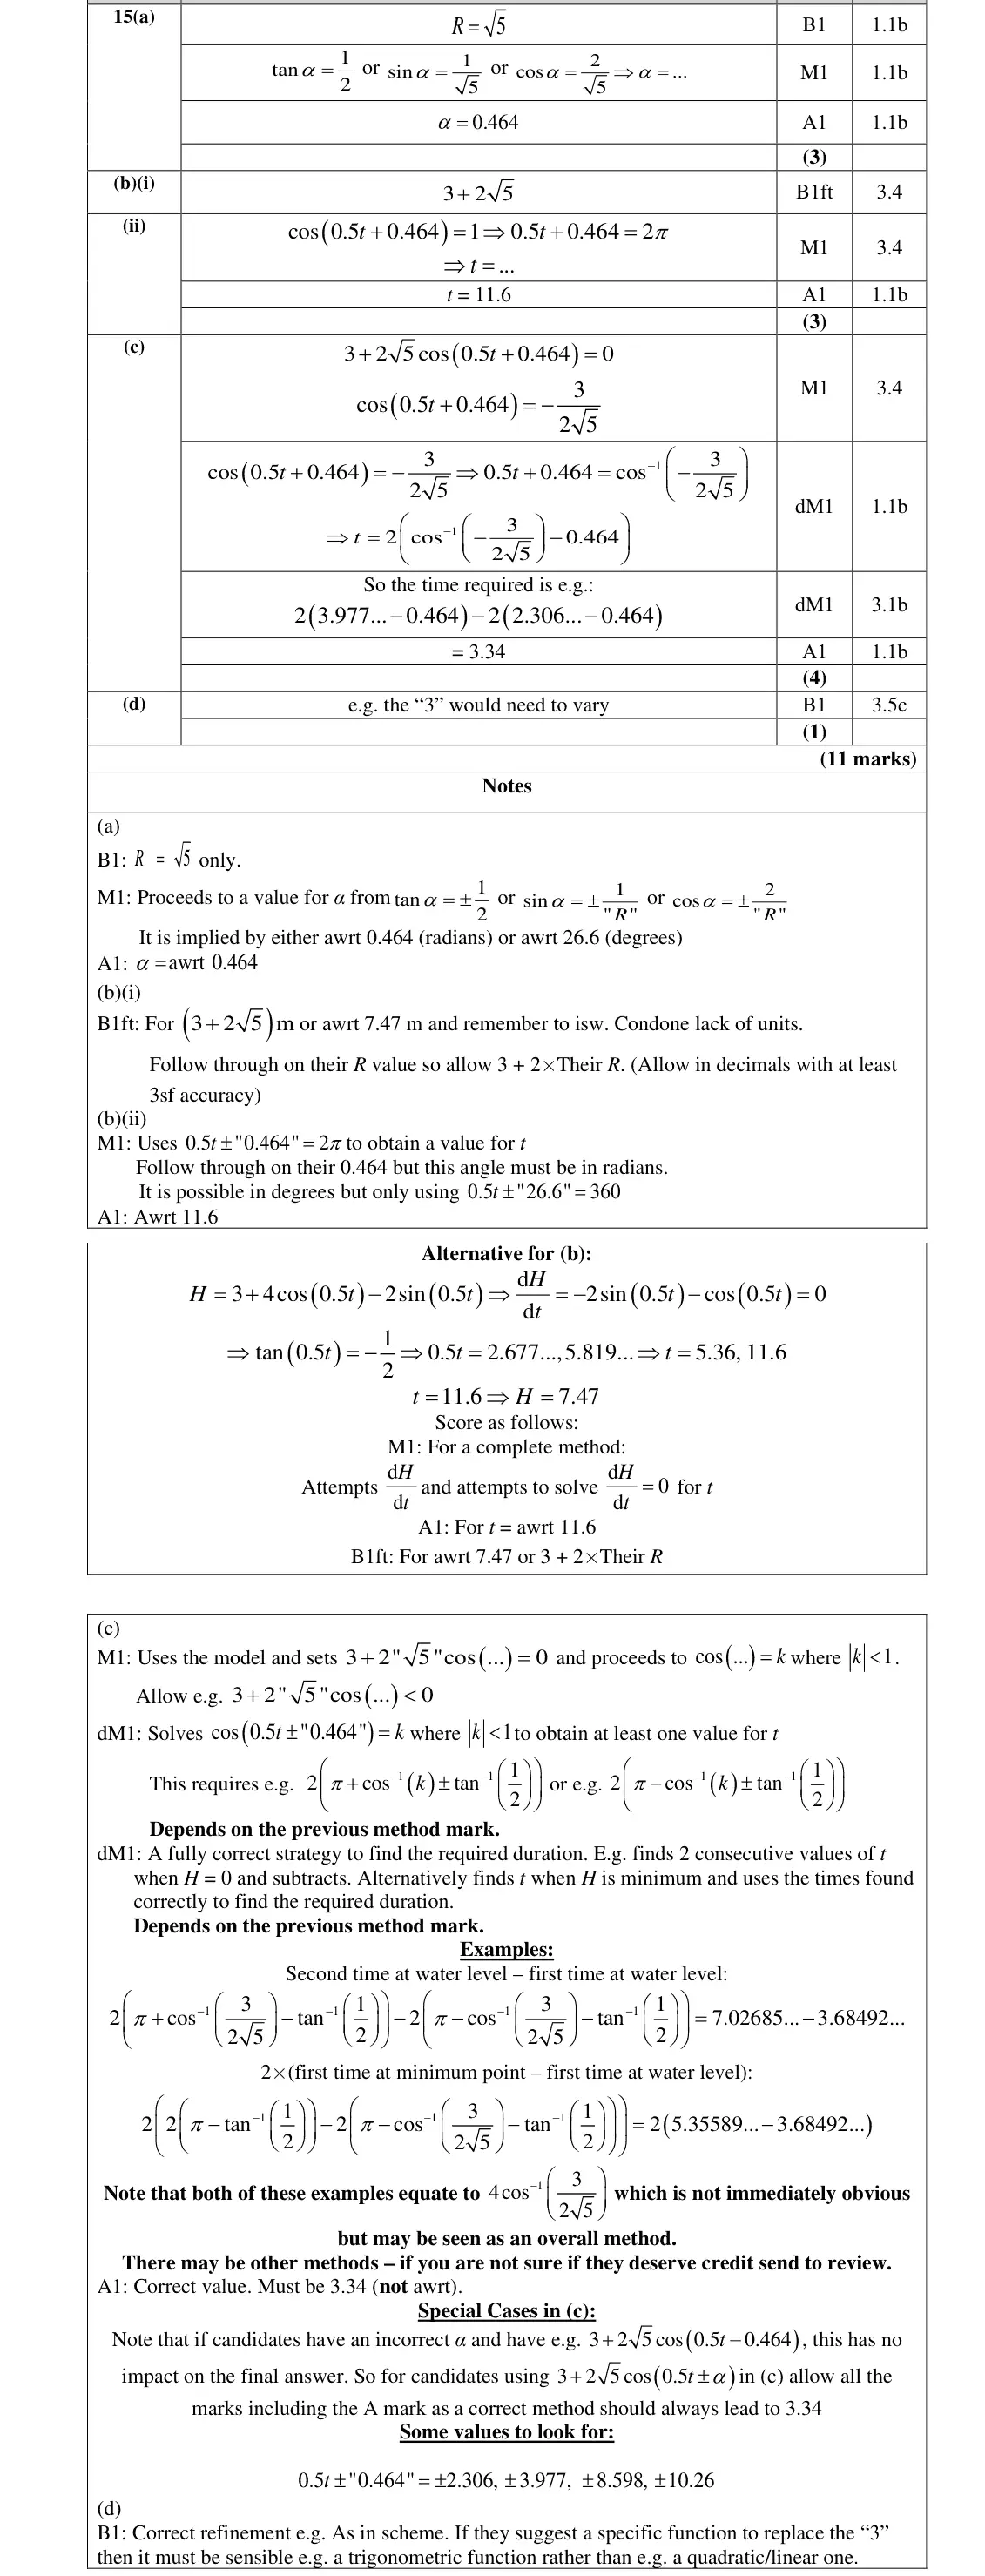
Use of functions in modelling, including consideration of limitations and refinements of the models.
Guidance
For example, use of trigonometric functions for modelling tides, hours of sunlight, etc. Use of exponential functions for growth and decay (see Paper 1, Section 6.7). Use of reciprocal function for inverse proportion (e.g. pressure and volume).
Mark scheme (whole question; this part is marked with the orange bar)
Examiner's comment
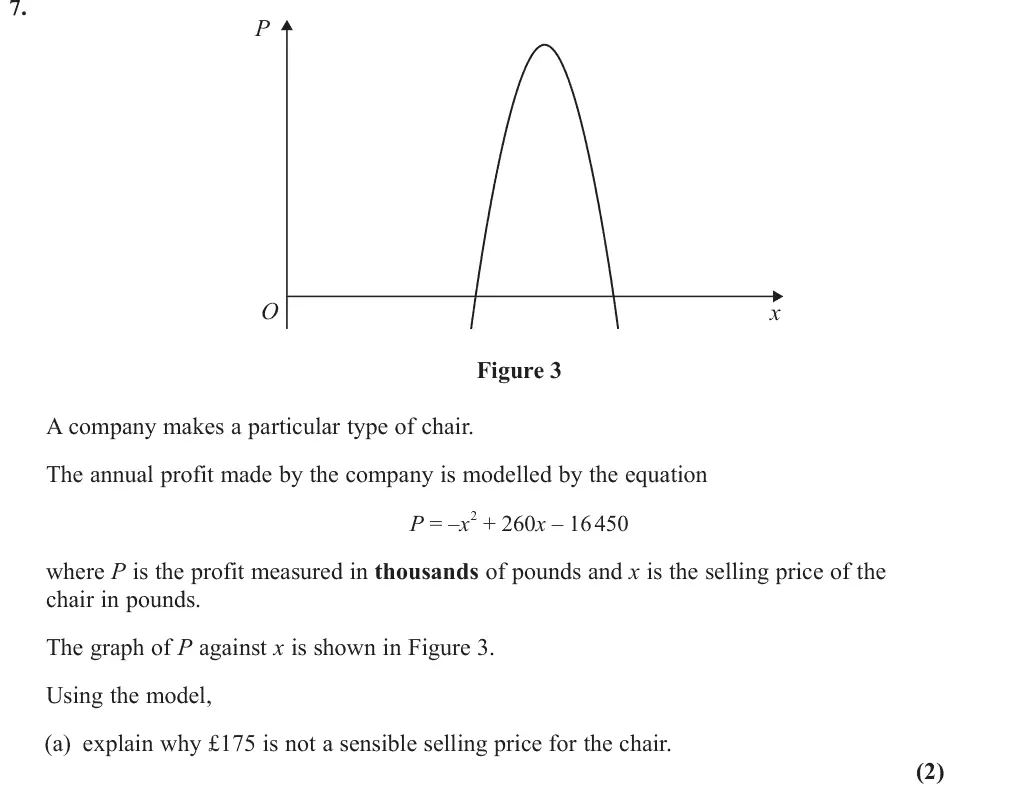
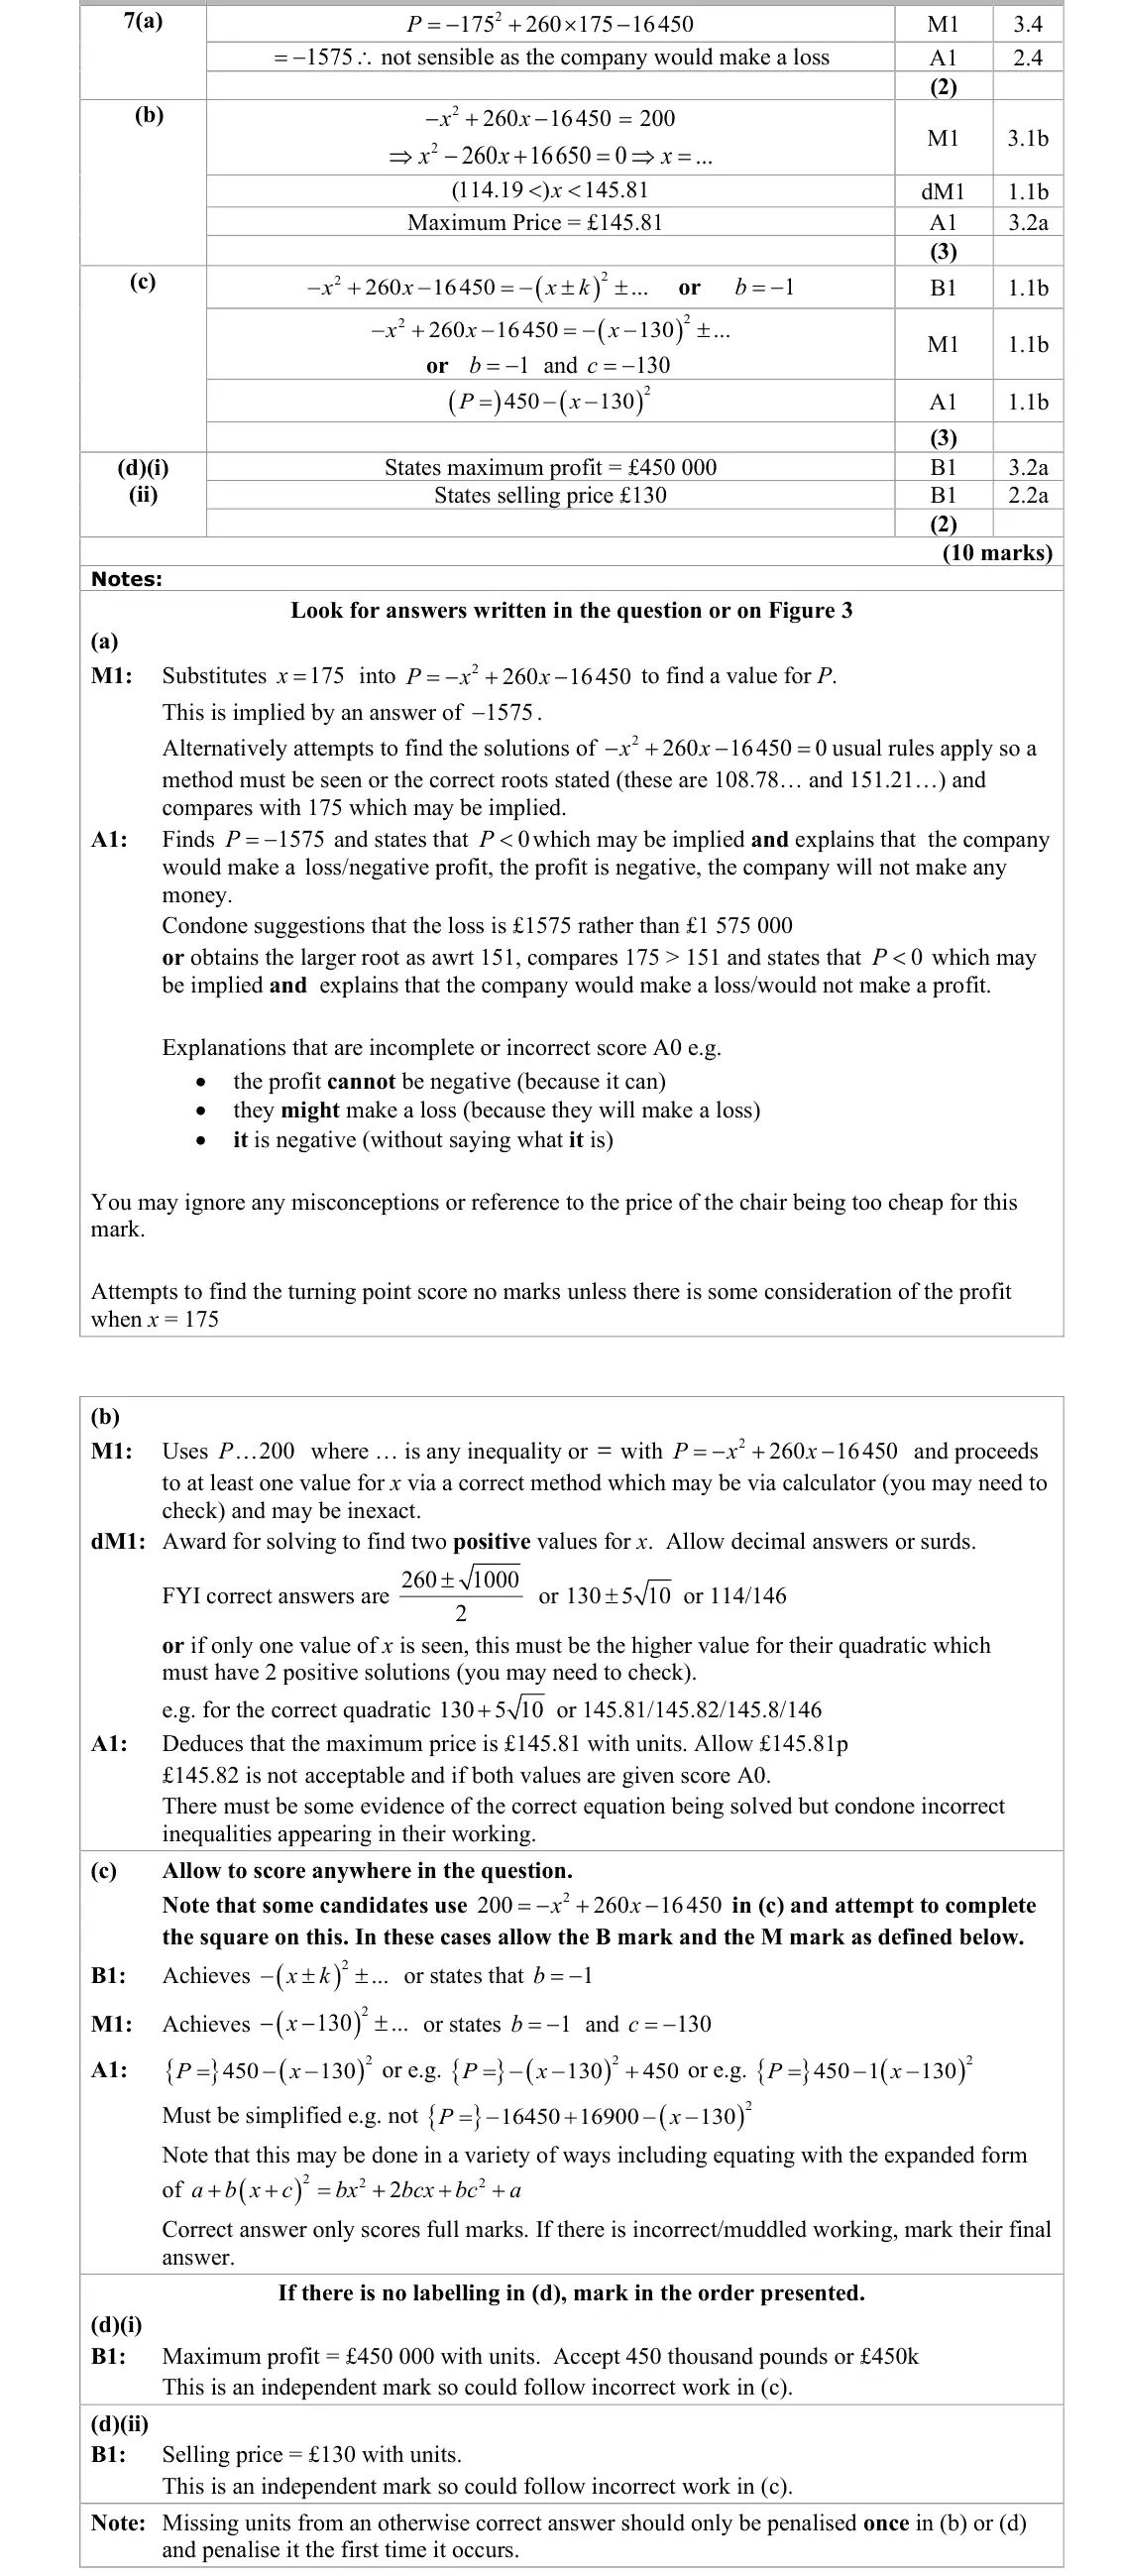
Part (a) was typically answered well, with the majority of candidates attempting the substitution of 175, including reasonable explanations to secure both marks. Some responses included erroneous brackets around -175, resulting in losing the negative sign when squaring.
Common mistakes
substitute x = 175: P = −1575 so the company makes a loss (must say it will, not might, make a loss)
brackets round −175 lose the sign when squaring
June 2025 · AS Paper 1 · Q7(b)3 marks
Mark scheme (whole question; this part is marked with the orange bar)
Examiner's comment
Part (b) of the question was completed less successfully. A common error saw candidates replacing P with 200 000 instead of 200, leading to incorrect solutions and loss of three marks. While some candidates annotated the figure with a horizontal line at 200 to enable them to visualise that there were 2 possible solutions that gave P = 200, the word ‘highest’ in the question prompted some pupils towards an optimisation approach, differentiating and setting = 0, ignoring the minimum profit. A large number of candidates lost the final mark due to either losing the £ sign from their final answer or not giving the answer to two decimal places as is expected when working with money.
Common mistakes
P is in thousands so set P = 200, not 200 000
solve x² − 260x + 16 650 = 0: 114.19 < x < 145.81
highest price £145.81 (2 d.p. with £
£145.82 is wrong)
differentiating to find the maximum ignores the profit condition
June 2025 · AS Paper 1 · Q7(c)3 marks
Mark scheme (whole question; this part is marked with the orange bar)
Examiner's comment
It was pleasing to see many candidates successfully completing the square in part (c). However, there were also a large number who struggled with the negative coefficient of 2x and some candidates multiplied the whole expression by -1 and many incorrectly incorporated it into the bracket resulting in various combinations of signs. Many made errors finding the constant and a large number of candidates confused this part with part (b) and attempted to complete the square on the wrong quadratic expression. There were a number of responses which did not simplify the final answer, resulting in a loss of the final mark.
Common mistakes
complete the square with the negative x² coefficient: P = 450 − (x − 130)²
sign errors with the −1
must be simplified
completing the square on the (b) quadratic
June 2025 · AS Paper 1 · Q7(d)2 marks
Mark scheme (whole question; this part is marked with the orange bar)
Examiner's comment
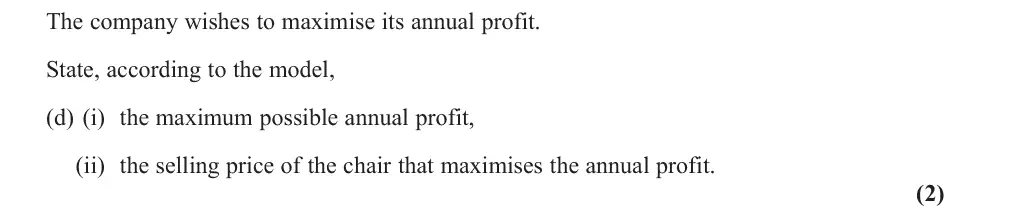
On the whole part (d) was quite well done. Candidates who didn’t see the connection between (c) and (d) often used differentiation instead to get the correct answer. Some marks were unfortunately lost due to lack of units or misunderstanding of the units.
Common mistakes
read from the completed square: maximum profit £450 000 (units
not £450) at a selling price of £130
differentiation also works
June 2025 · Paper 1 · Q6(a)4 marks
Mark scheme (whole question; this part is marked with the orange bar)
Examiner's comment
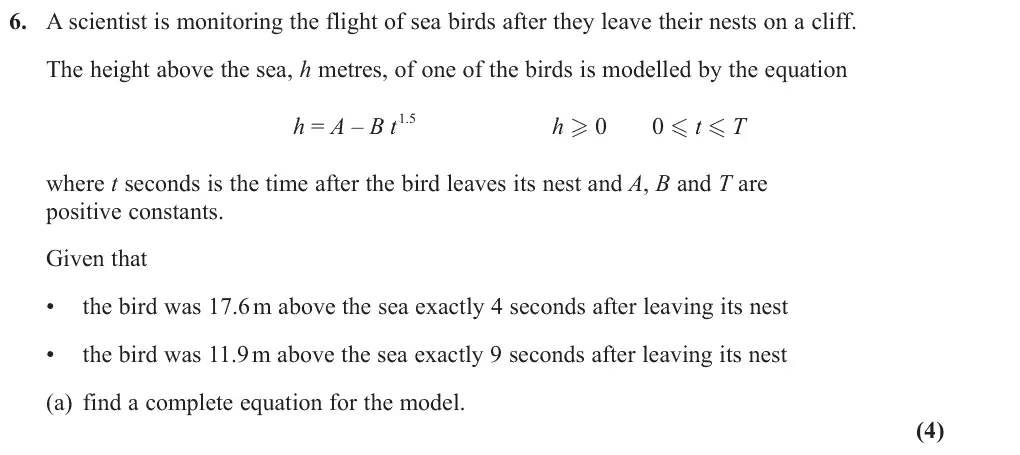
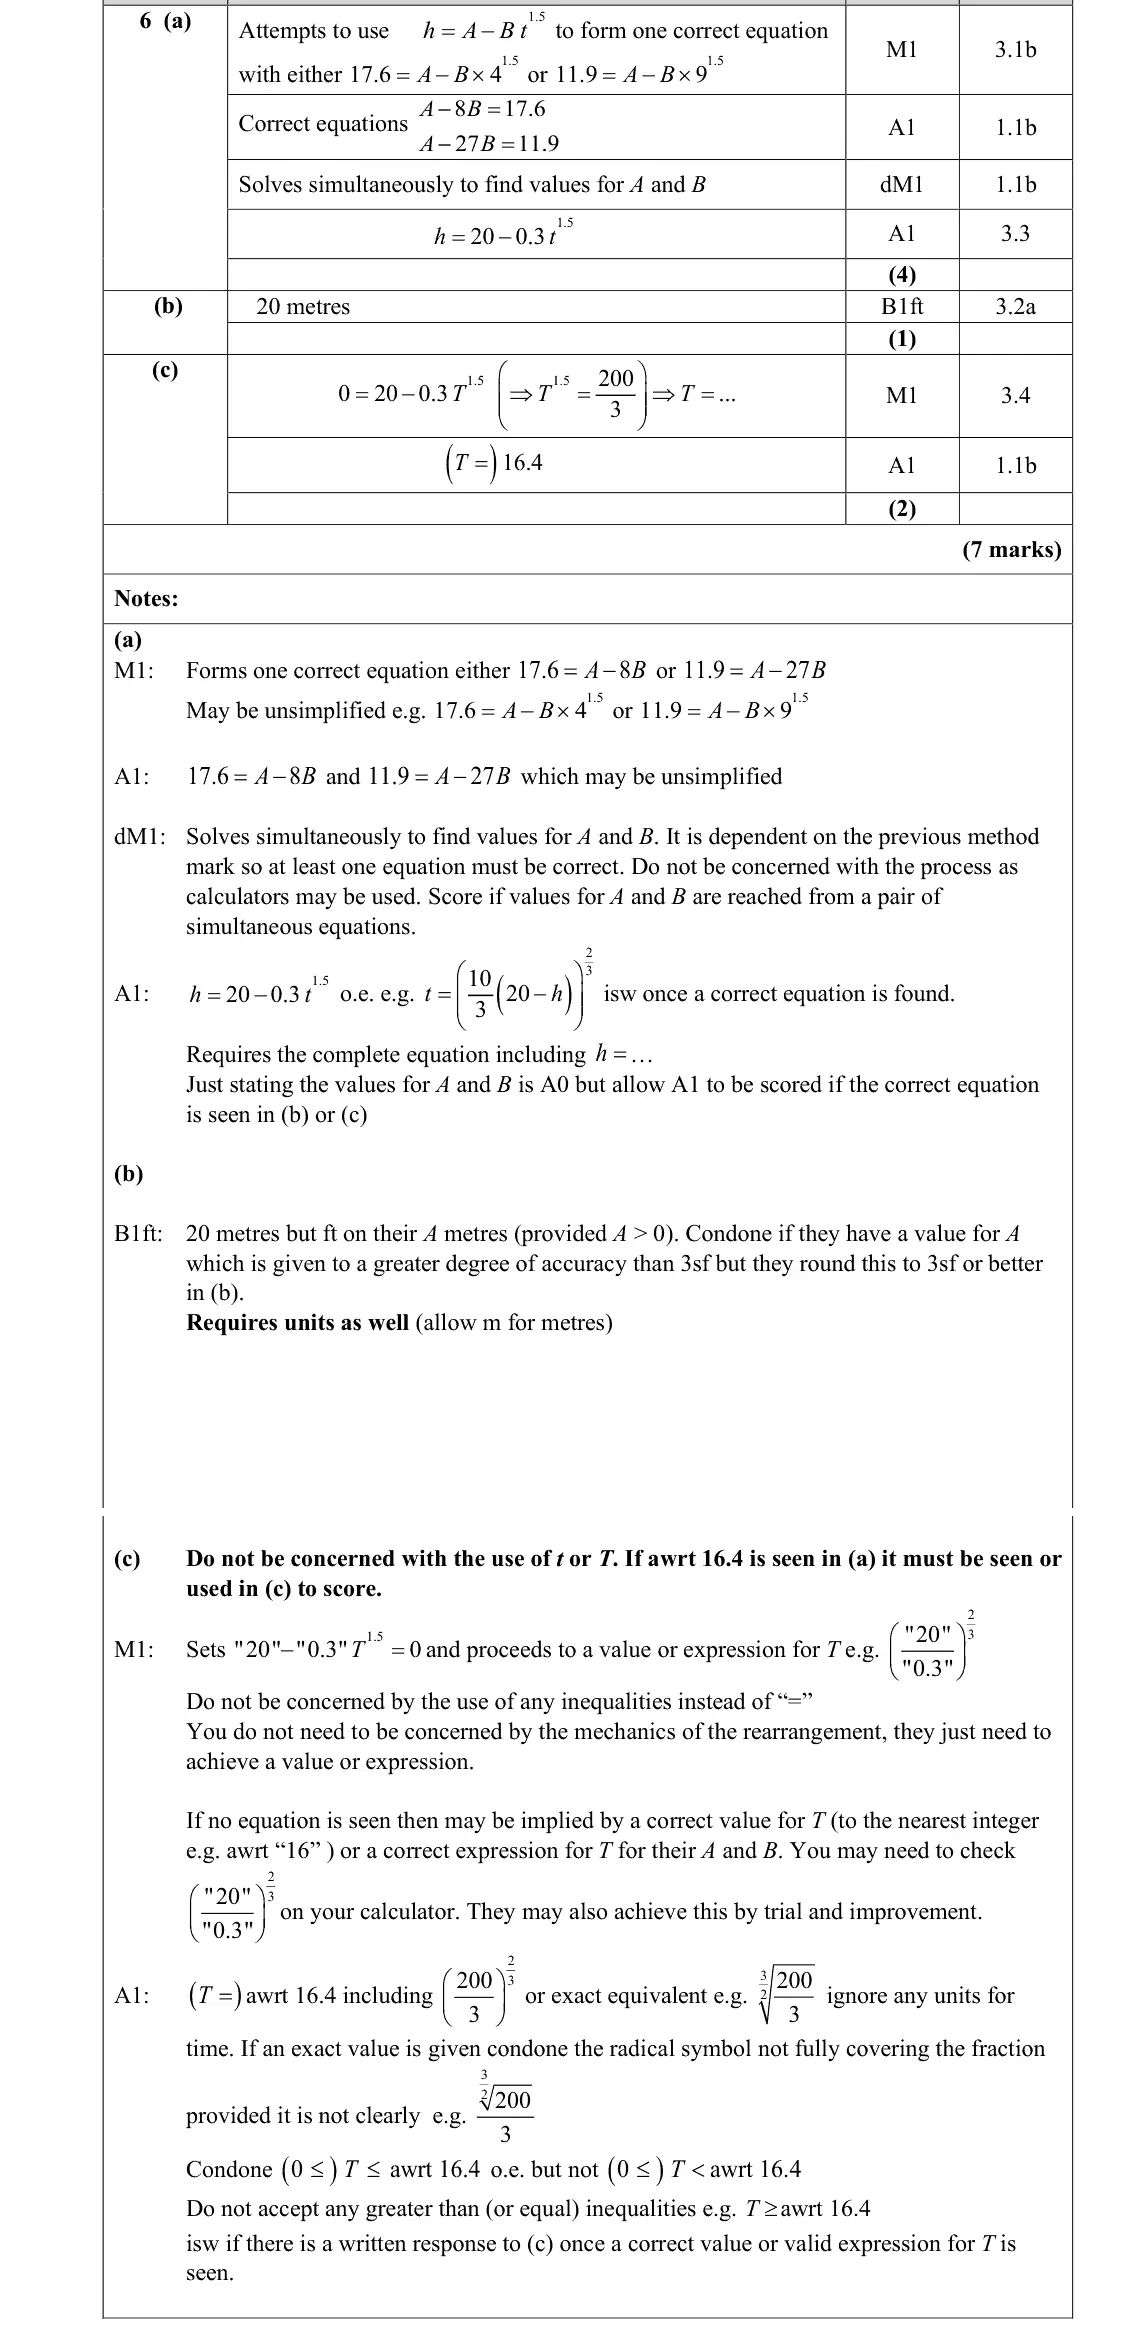
This was the first modelling question on the paper. In part (a), most learners demonstrated a strong grasp of the initial requirements, successfully forming and solving the correct pair of simultaneous equations to determine the values of A and B. However, a minority of responses overcomplicated their approach by unnecessarily introducing logarithms or misapplying algebraic techniques, leading to errors. Common mistakes included arithmetic slips, particularly with decimal values such as 17.6 or 11.9, and confusion between addition and subtraction within algebraic manipulation. It was observed that learners relying on calculators tended to achieve more accurate results than those attempting manual algebraic solutions, with the latter occasionally making sign errors or misplacing powers. Some responses applied the power of 1.5 to B instead of t, or incorrectly simplified expressions such as 41.5 and 91.5. The final mark was sometimes not awarded due to omission of the complete model equation as their answer, or by not checking that their solution met the question’s requirement for B to be a positive constant. A small number disregarded the model altogether and adopted a linear approach.
Common mistakes
17.6 = A − 8B and 11.9 = A − 27B give A = 20, B = 0.3
must state the complete equation h = 20 − 0.3t^1.5
some put the power on B or used a linear model
June 2025 · Paper 1 · Q6(b)1 mark
Mark scheme (whole question; this part is marked with the orange bar)
Examiner's comment
This was the first modelling question on the paper. In part (b), the majority substituted 0 t = correctly into their model to obtain the numerical value of the nest's height, most frequently arriving at 20. However, a significant number did not include the correct unit (metres), resulting in the mark not being awarded. A recurring incorrect answer was 19.7, usually due to improper subtraction or mishandling of exponents. Learners should be reminded to include units in these modelling questions, particular where it does not just ask for the value.
Common mistakes
height of the nest is h when t = 0: 20 metres (units needed)
19.7 is a common wrong answer
June 2025 · Paper 1 · Q6(c)2 marks
Mark scheme (whole question; this part is marked with the orange bar)
Examiner's comment
This was the first modelling question on the paper. In part (c), many responses identified the conceptual constraint that the height cannot be negative and explained this convincingly in words. However, fewer responses set up and solved an equation to find the critical value of T where the height is zero. Those who attempted to find the value of T were generally successful, though some struggled with the algebra or worked by trial and error to estimate the boundary. Issues included inconsistent use of inequalities when rounding and a tendency to provide descriptive rather than numerical responses. 10
Common mistakes
h ≥ 0 so solve 20 − 0.3T^1.5 = 0: T = (200/3)^(2/3) = 16.4, i.e. T ≤ 16.4 (not T ≥)
many explained h cannot be negative but did not find the value
June 2025 · Paper 1 · Q9(a)2 marks
Mark scheme (whole question; this part is marked with the orange bar)
Examiner's comment
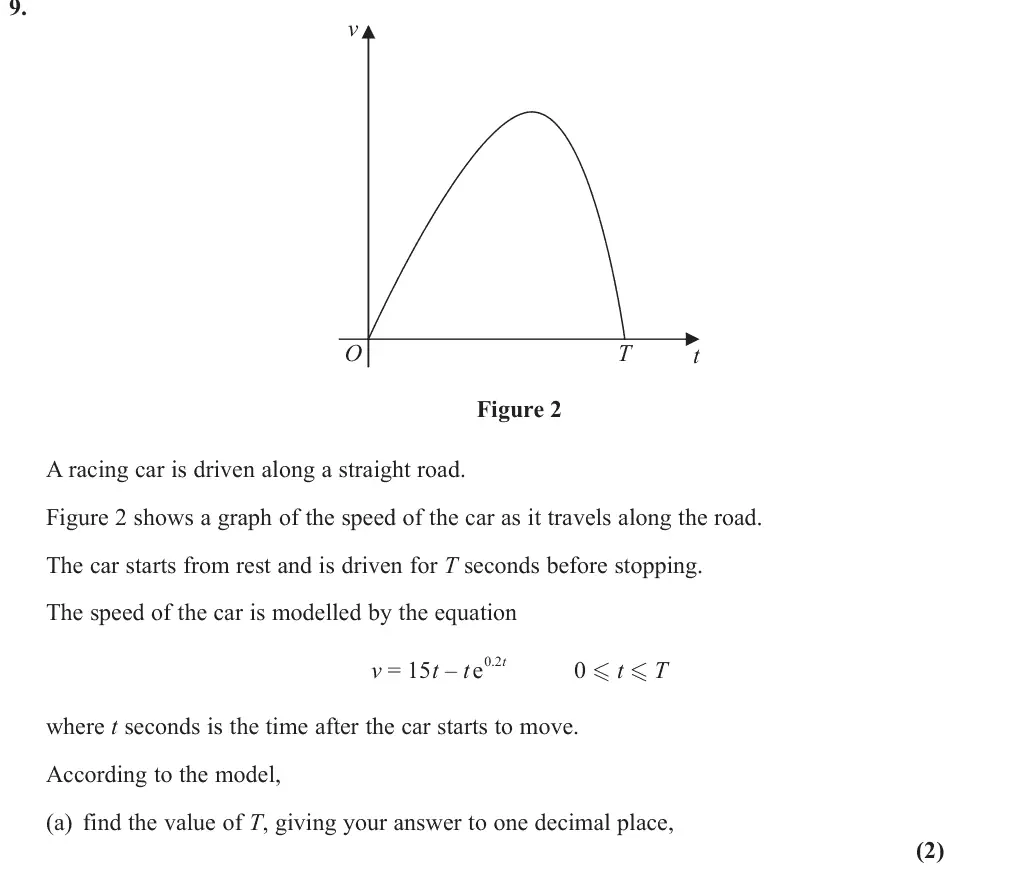
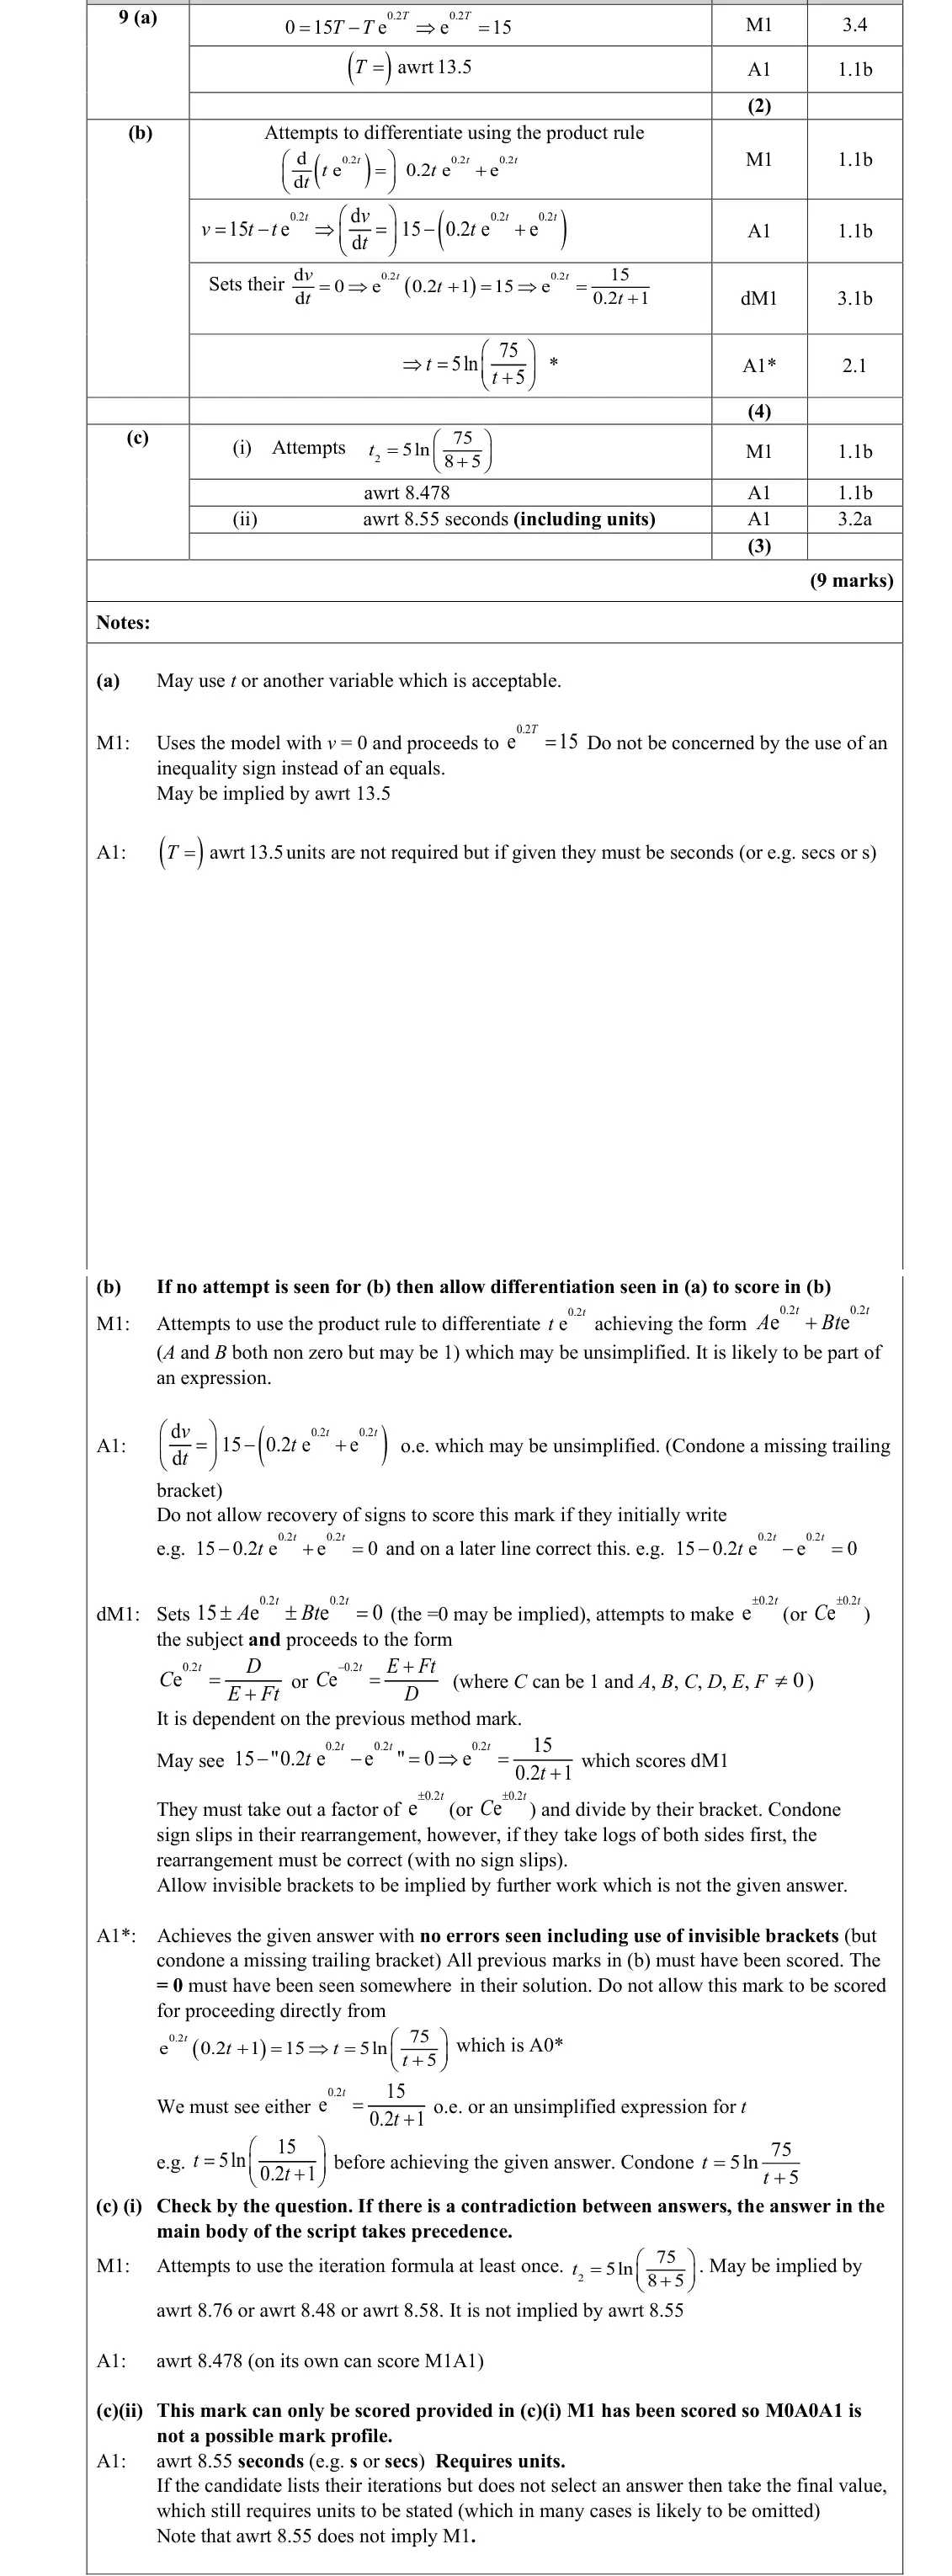
This question was generally well-answered, with most learners demonstrating a good grasp of the concepts. However, some common pitfalls were noted, particularly in differentiation and the inclusion of units. Part (a) required the learners to set the given model equal to zero and solve. Many made good progress in this part, by setting 0 v = , mostly dividing by t and attempting to rearrange to the form 0.2 e 15 t = or 0.2 e 15 T = . The majority reached a correct answer rounded to the required degree of accuracy or left in a simplified exact form. Errors were rare but often stemmed from a fundamental misunderstanding of logarithms or not dividing by t.
Common mistakes
set v = 0 and divide by T (T ≠ 0): e^(0.2T) = 15, T = 5 ln 15 = 13.5 (1 d.p.)
log errors
June 2025 · Paper 1 · Q9(b)4 marks
Mark scheme (whole question; this part is marked with the orange bar)
Examiner's comment
This question was generally well-answered, with most learners demonstrating a good grasp of the concepts. However, some common pitfalls were noted, particularly in differentiation and the inclusion of units. Part (b) involved differentiating the given model, setting this equal to zero and rearranging to the given form. This was generally well-answered, however a significant number of learners lost all the marks by not using the product rule. Accuracy marks were typically not awarded due to sign errors as a result of not using brackets correctly. Learners who wrote out the product rule separately before substitution were more likely to avoid such errors. In addition, some learners struggled with algebraic manipulation after differentiation, particularly when taking natural logarithms too early or when simplifying fractions.
Common mistakes
product rule on te^(0.2t): dv/dt = 15 − (0.2te^(0.2t) + e^(0.2t)) = 0 (many did not use the product rule
bracket/sign errors)
factor e^(0.2t)(0.2t + 1) = 15 then take logs to reach the given t = 5 ln(75/(t + 5))
June 2025 · Paper 1 · Q9(c)3 marks
Mark scheme (whole question; this part is marked with the orange bar)
Examiner's comment
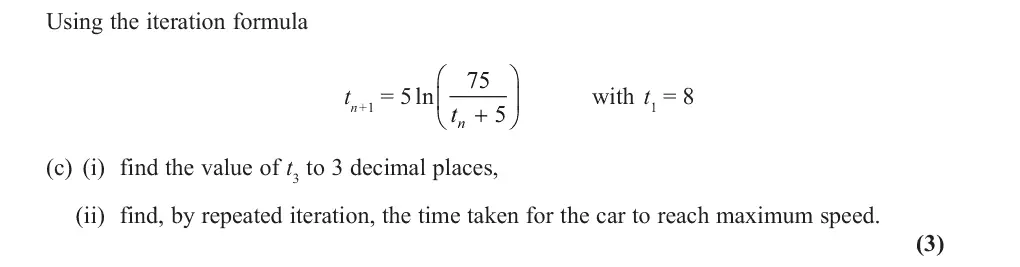
This question was generally well-answered, with most learners demonstrating a good grasp of the concepts. However, some common pitfalls were noted, particularly in differentiation and the inclusion of units. Part (c) involved using the given iterative formula and appeared accessible to almost all learners. In part (i), the vast majority gained the two marks in the first part with only occasional rounding inaccuracies such as giving the answer to 3 significant figures instead of 3 decimal places or only calculating the second iteration 2 t . In part (ii) many responses did not include units in their final answer or used incorrect units. A large number also spent time writing down a list of subsequent iterations, not realising that for a one-mark question the final answer is sufficient. 14
Mark scheme (whole question; this part is marked with the orange bar)
Examiner's comment
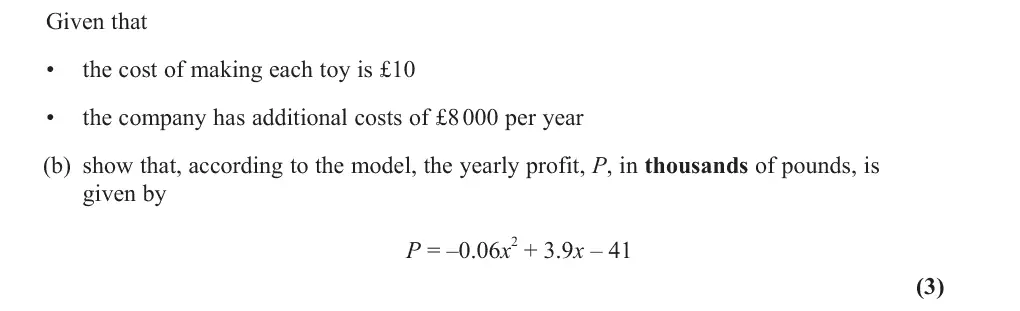
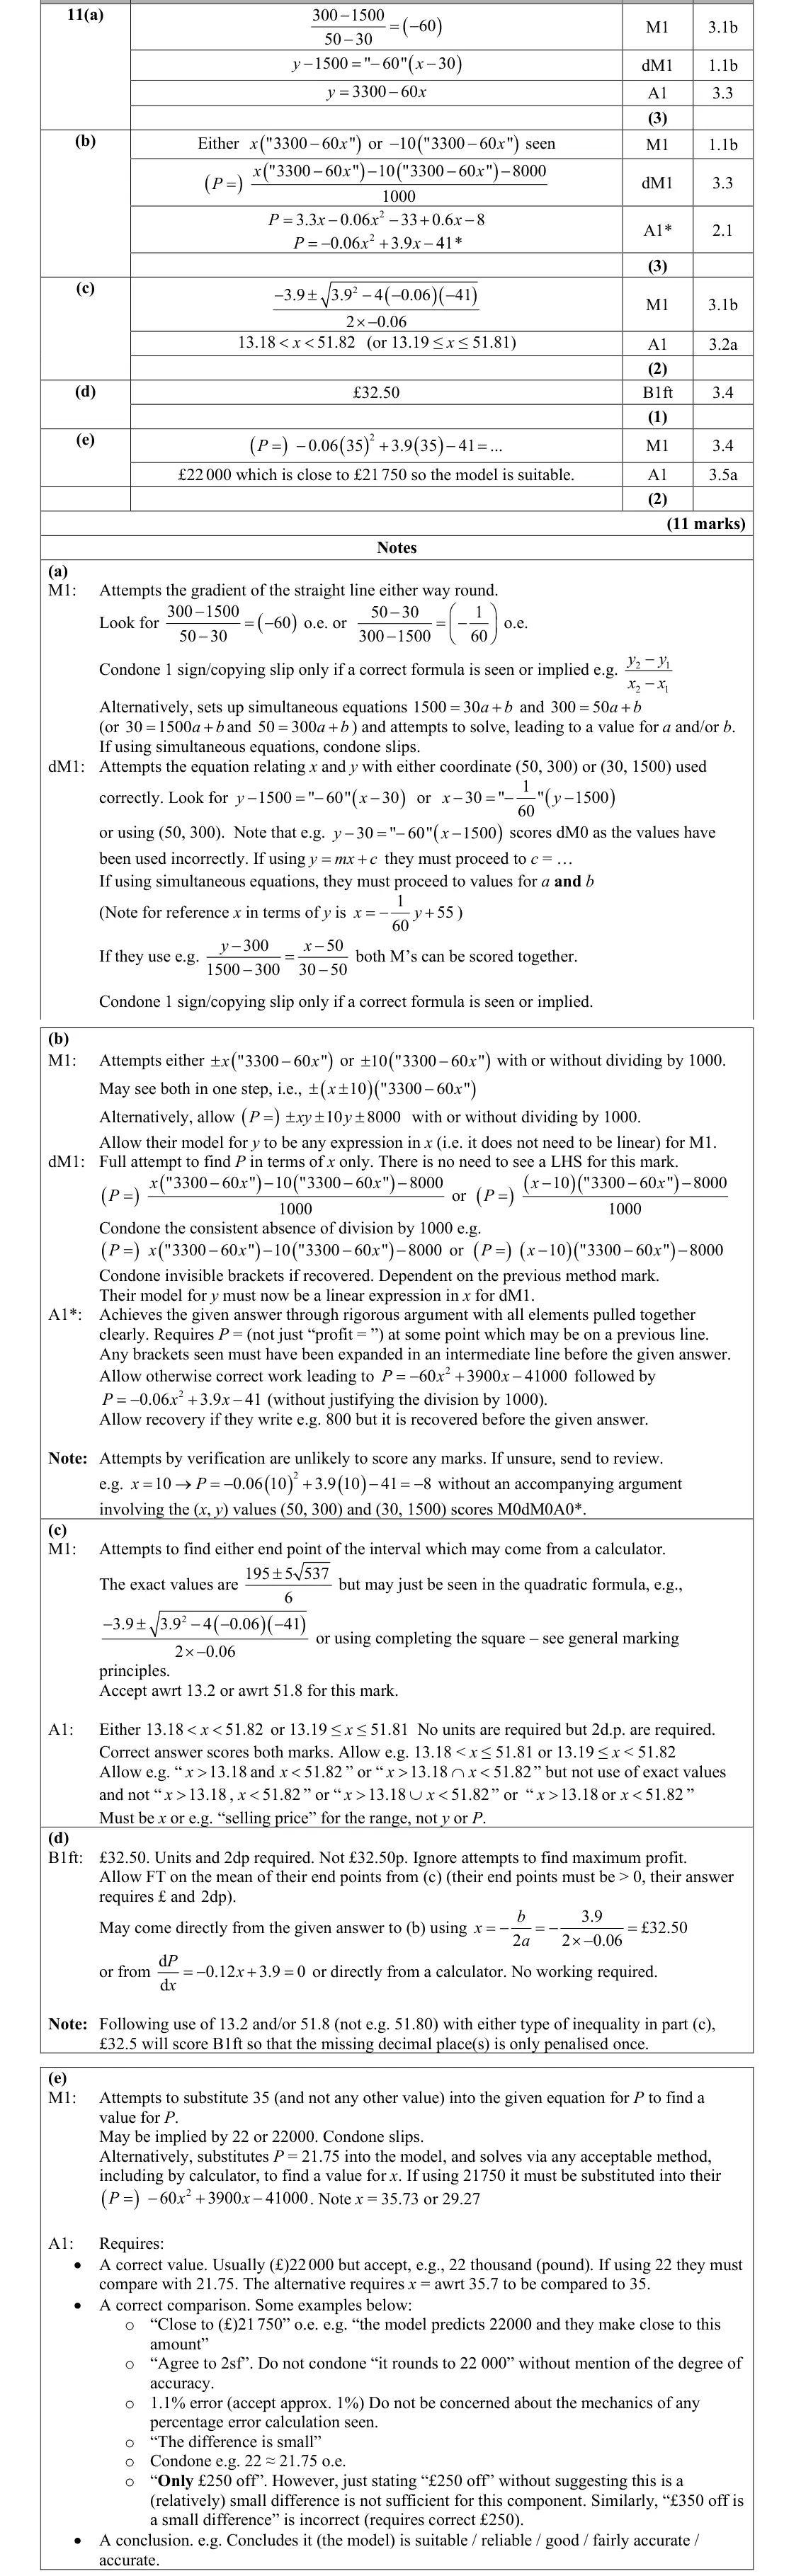
This modelling question required learners to construct and interpret a linear demand model, derive a profit function, solve a quadratic inequality, identify the optimal selling price, and assess the suitability of a model against real data. Overall, performance was mixed across the different parts of the question. Part (b) proved to be much more challenging. Learners who made an otherwise strong attempt sometimes omitted the -8000 term or made errors while expanding the brackets. Those who reached the correct expression connecting variable and fixed costs without initially dividing by 1000 generally recognised the need to do so, since the final answer was provided, and divided by 1000 at the end to match the printed equation. Common errors for those that attempted this part were missing the fixed cost, incorrect expressions for revenue or cost and failure to divide by 1000 accurately. A few responses tried to verify the formula for the given data but often fell short of a full method by only testing the given two values and not forming a conclusion.
Common mistakes
profit = xy − 10y − 8000 then divide by 1000
−8000 fixed cost often omitted
expand brackets before the given answer
verification with two values scores 0
June 2025 · Paper 2 · Q11(c)2 marks
Mark scheme (whole question; this part is marked with the orange bar)
Examiner's comment
This modelling question required learners to construct and interpret a linear demand model, derive a profit function, solve a quadratic inequality, identify the optimal selling price, and assess the suitability of a model against real data. Overall, performance was mixed across the different parts of the question. Part (c) allowed many learners to make the most of the restart opportunity, with the majority attempting this part. Most recognised that they needed to solve the equation by setting P equal to zero and most did so by directly calculating values of x using their calculators. As this was a question involving money, responses did not gain the accuracy mark for not rounding their answers to two decimal places as required. Among those who gave a decimal answer, many did not earn the A mark either because they rounded to one decimal place or used an incorrect inequality, misinterpreting when the profit would be positive in the vicinity of their critical values, with a common incorrect answer being 13.19 < x < 51.81.
Common mistakes
solve P = 0 and take the inside region where P > 0
money so 2 d.p.: 13.18 < x < 51.82 (13.19 < x < 51.81 with strict signs is wrong)
June 2025 · Paper 2 · Q11(d)1 mark
Mark scheme (whole question; this part is marked with the orange bar)
Examiner's comment
This modelling question required learners to construct and interpret a linear demand model, derive a profit function, solve a quadratic inequality, identify the optimal selling price, and assess the suitability of a model against real data. Overall, performance was mixed across the different parts of the question. In part (d), many learners did not earn the mark due to the omission of the pound sign or failure to round their answer to two decimal places. It would be advisable for learners to pay closer attention to the word 'price' in the question, as it implies that both the correct unit and an answer given to two decimal places are required.
Common mistakes
midpoint of the roots or x = −b/2a
a price needs £ and 2 d.p.: £32.50
June 2025 · Paper 2 · Q11(e)2 marks
Mark scheme (whole question; this part is marked with the orange bar)
Examiner's comment
This modelling question required learners to construct and interpret a linear demand model, derive a profit function, solve a quadratic inequality, identify the optimal selling price, and assess the suitability of a model against real data. Overall, performance was mixed across the different parts of the question. Part (e) was generally well answered and the vast majority of responses correctly substituted 35 and obtained a profit of £22,000. Those who did not gain the final mark typically did not acknowledge that £22,000 is close to £21,750 or only mentioned this in their conclusion. Some appeared to expect the output of the model to match the real value exactly. This part effectively distinguished between those who understood the purpose of model validation and those who performed substitution without interpretation.
Common mistakes
P(35) = 22 so £22 000
must say this is close to £21 750 and conclude the model is suitable (not expect an exact match)
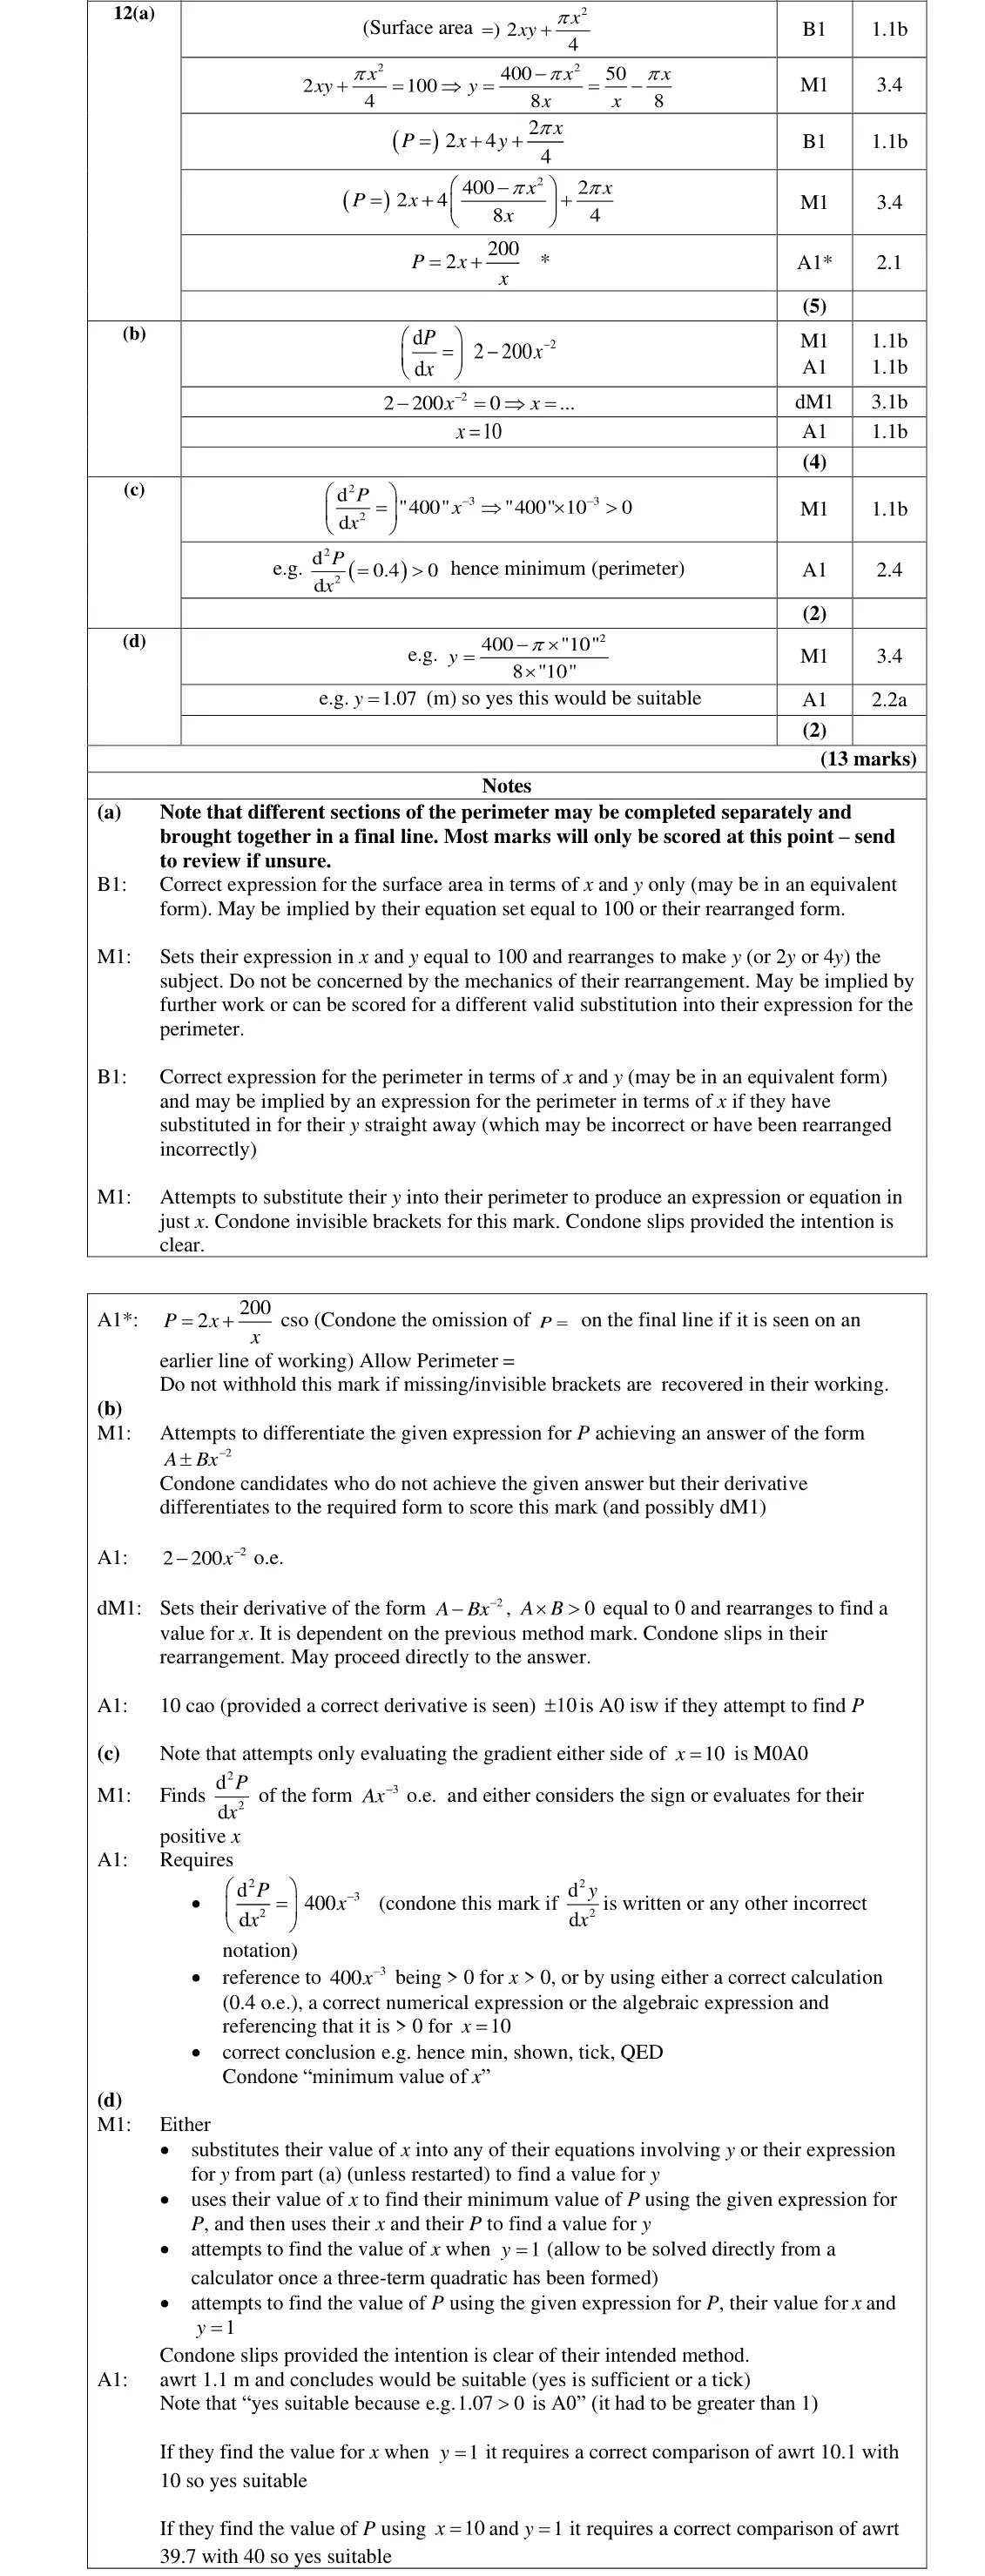
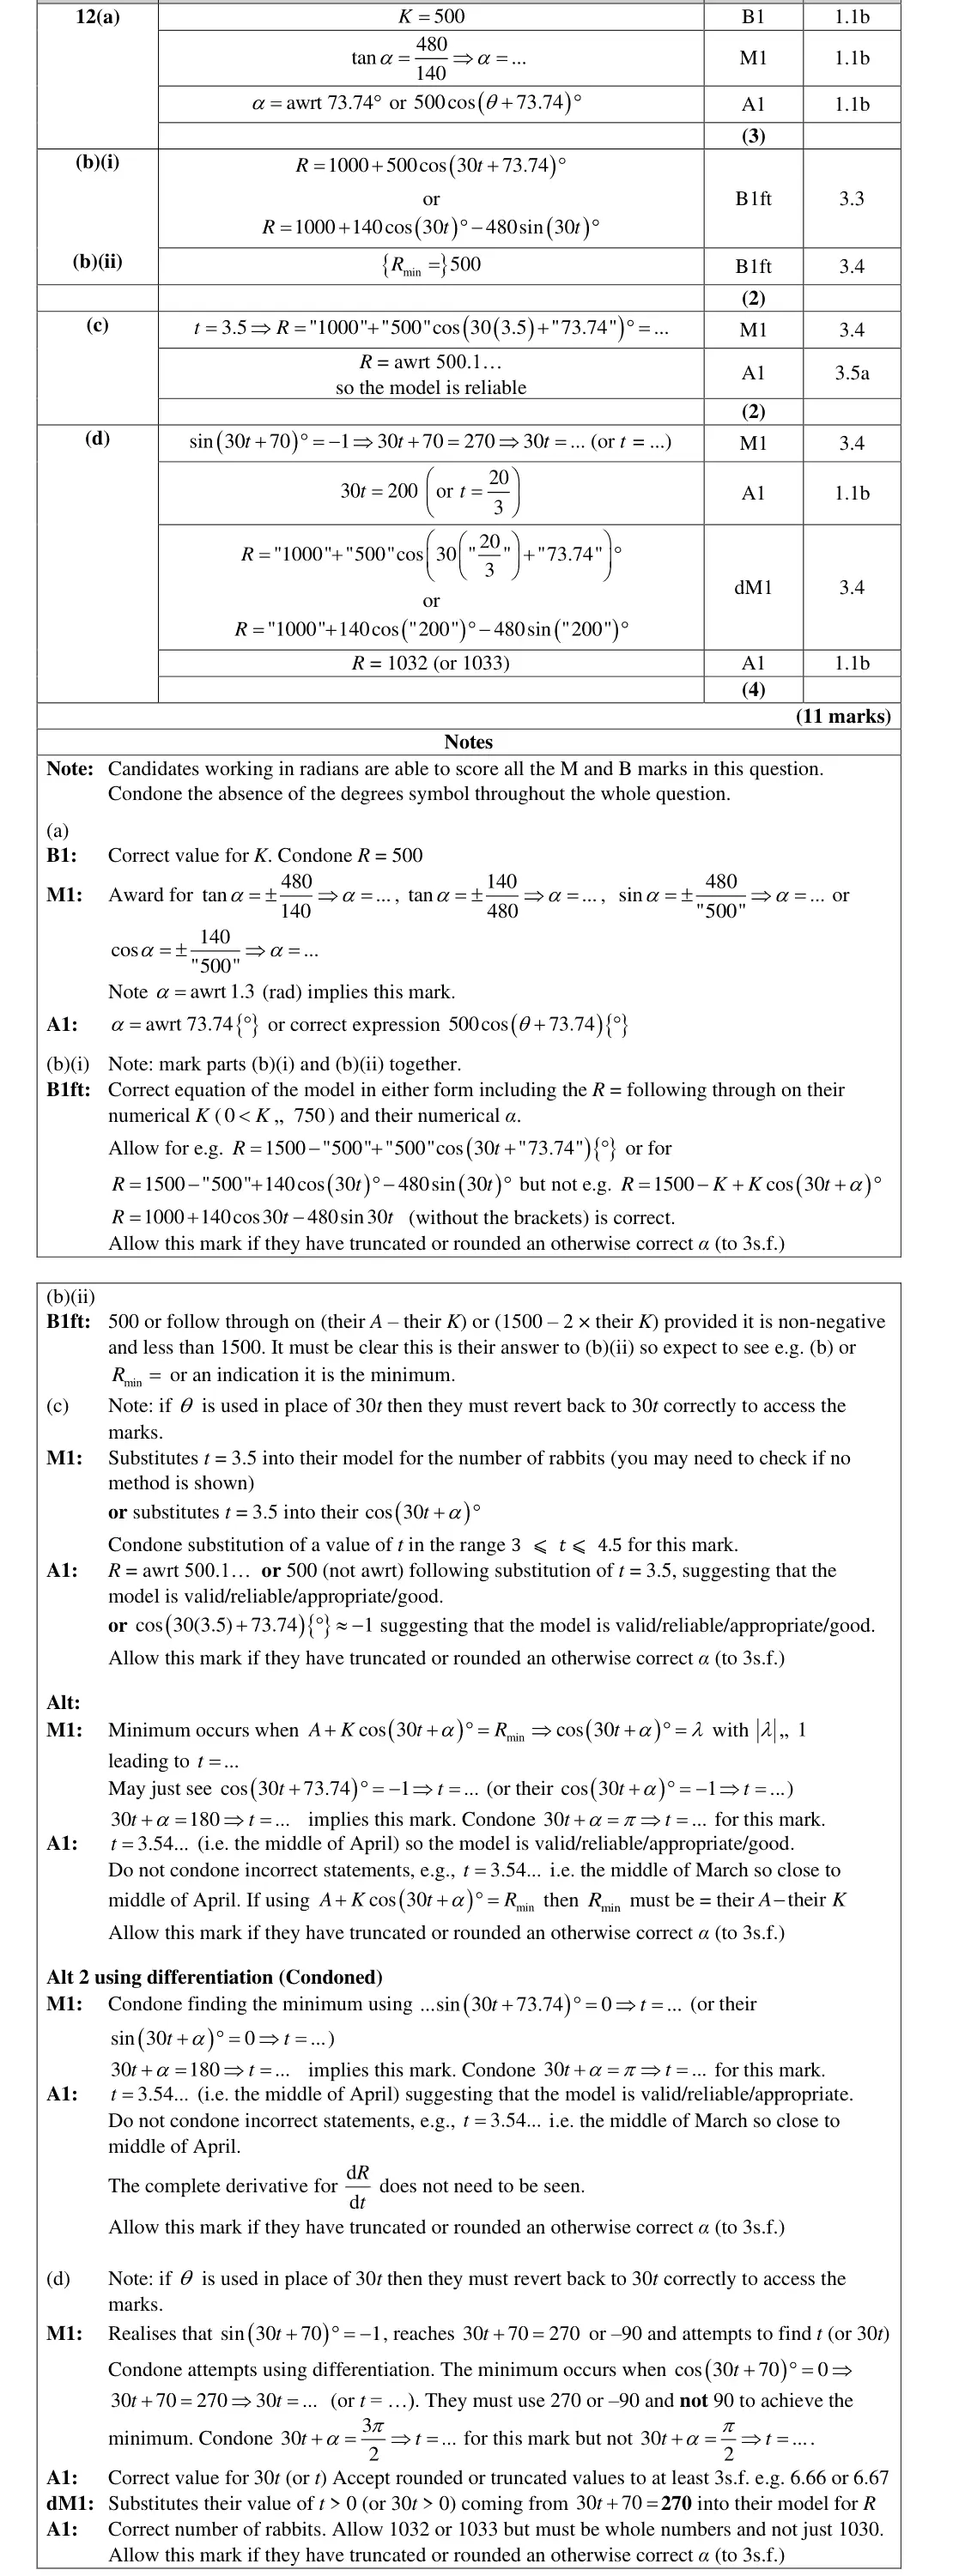
June 2024 · AS Paper 1 · Q12(d)2 marks
Mark scheme (whole question; this part is marked with the orange bar)
Examiner's comment
A number of approaches to part (d) were observed. Most commonly, candidates evaluated y using their value of x and the relationship derived in part (a), to determine whether y
Common mistakes
y = (400 − 100π)/80 = 1.07 m ≥ 1 so suitable
"1.07 > 0" is wrong comparison
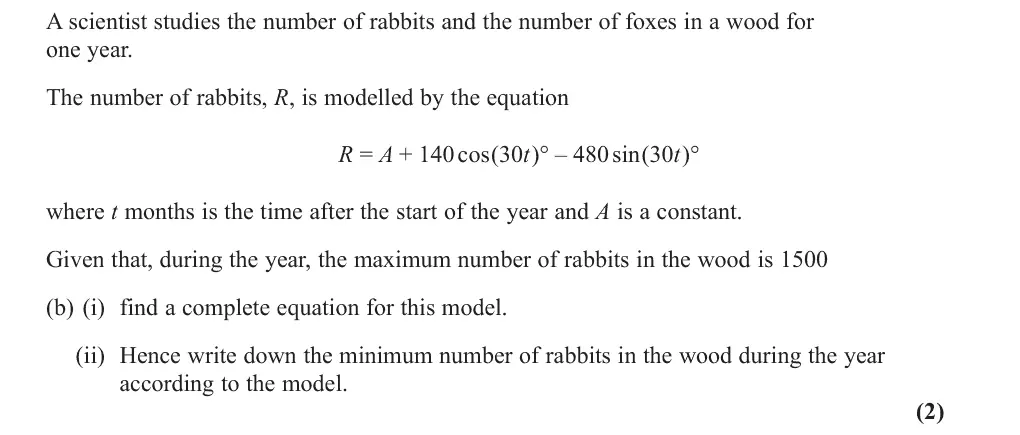
June 2024 · Paper 1 · Q12(b)2 marks
Mark scheme (whole question; this part is marked with the orange bar)
Examiner's comment
This harmonic form question was seen to be relatively challenging, despite similar questions being seen on several previous exam papers. That said, many candidates were able to attempt all parts of the question, and many follow through marks were available to those that made errors early on in their attempt. It was pleasing that most candidates identified that this question used degrees rather than radians. It was also pleasing to see many candidates continue to work through all parts of this modelling question despite having errors or not attempting previous parts. Responses to part (b)(i) suggested that candidates are not as confident at using the harmonic form as they are at forming it. Far too many candidates ignored their work from part (a) even if it was correct. Although given the maximum value for R, it was not uncommon to see candidates failing to use their harmonic form from part (a), but instead simultaneously setting 1500 R = , ( ) cos 30 1 t = - and ( ) sin 30 0 t = to obtain an incorrect value for A. Most of those who correctly identified that 1000 A = did then proceed to write down the full equation of the model, although many left this part with just a value for A. In part (b)(ii), some candidates struggled to calculate the value of min R as they did not recognise the link between their min R and the values of K and A. There were a few who added their values of A and K and hence did not score this B mark. Those who had found the correct value, 1000 A = , generally went on to identify the minimum value of R, but the follow through allowed those who understood the required method to gain this mark with an incorrect value for A.
Common mistakes
use the harmonic form: max = A + K so A = 1000 (not cos = −1 and sin = 0 together)
give the full equation, not just A
min = A − K = 500
June 2024 · Paper 1 · Q12(c)2 marks
Mark scheme (whole question; this part is marked with the orange bar)
Examiner's comment
This harmonic form question was seen to be relatively challenging, despite similar questions being seen on several previous exam papers. That said, many candidates were able to attempt all parts of the question, and many follow through marks were available to those that made errors early on in their attempt. It was pleasing that most candidates identified that this question used degrees rather than radians. It was also pleasing to see many candidates continue to work through all parts of this modelling question despite having errors or not attempting previous parts. Most candidates were able to gain some credit for part (c) as the method mark was quite generous regarding the candidates’ interpretation of the phrasing “middle of April” in terms of the model. Approaches using a value of t condoned values in the range 3 ⩽ 𝑡 ⩽ 4.5 to be substituted into their model for R. The most common incorrect values used were 4 t = or 4.5 t = and were condoned for the method mark. However, for full marks in part (c) candidates were required to translate ‘mid-April’ into 3.5 t = and substitute this into their model. A comparison with 500 R = could then be made, and the model was seen to be reliable. Another approach requiring more work was to set 500 R = and solve for t , via ( ) cos 30 73.74 1 t + = -. This value of t could then be used to identify the month in which the model predicted R would be minimum. A common mistake seen in this approach was to incorrectly identify 3.54 t = as being ‘mid-March’ which led to mixed responses of the model being both reliable and unreliable for different candidates.
Common mistakes
mid-April is t = 3.5 (not 4 or 4.5)
R ≈ 500 = the minimum so the model is reliable
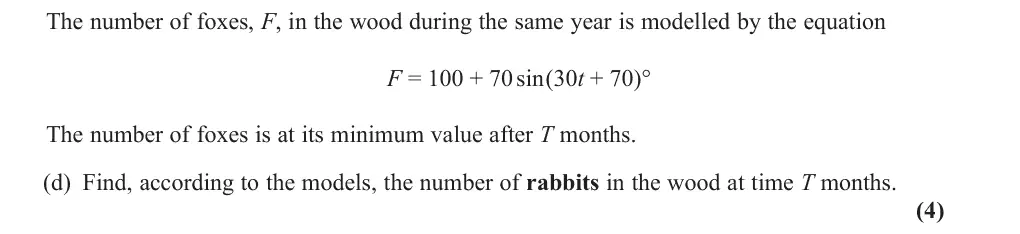
June 2024 · Paper 1 · Q12(d)4 marks
Mark scheme (whole question; this part is marked with the orange bar)
Examiner's comment
This harmonic form question was seen to be relatively challenging, despite similar questions being seen on several previous exam papers. That said, many candidates were able to attempt all parts of the question, and many follow through marks were available to those that made errors early on in their attempt. It was pleasing that most candidates identified that this question used degrees rather than radians. It was also pleasing to see many candidates continue to work through all parts of this modelling question despite having errors or not attempting previous parts. Part (d) was accessible to most candidates and fully correct answers were not uncommon. The simplest and most successful approach was to set ( ) sin 30 70 1 t + = - and solve for t, then substitute this into their model for R. Some candidates incorrectly set ( ) sin 30 70 1 t + = or 0, leading to the equation 30 70 90 t + = or 180. To score full marks for this part of the question, candidates needed to find a value of t from 30 70 270 t + = , use it with sufficient accuracy when substituting into their expression for R and round their final answer to an integer. Some candidates obtained a correct decimal answer but then rounded to 3 significant figures, giving 1030 as their final answer rather than the required 1032 or 1033. Many candidates incorrectly found a value of 16 3 t = - (coming from 30 70 90 t + = - ) which should have been an indication to restart this part having recognised that time cannot be negative. A significant proportion of candidates used 90 on the right-hand side, or even 0 or 180, which were not acceptable, and these failed to score any marks. There was also a minority of candidates who thought they were being asked to find the value of F. Another minority of candidates incorrectly assumed the question was asking when the populations of foxes and rabbits were the same and wrote down equations which they quickly concluded they could not solve.
Common mistakes
fox minimum when sin(30t + 70)° = −1 so 30t + 70 = 270 (not 90 or 180), t = 20/3
substitute into the rabbit model
whole number 1032
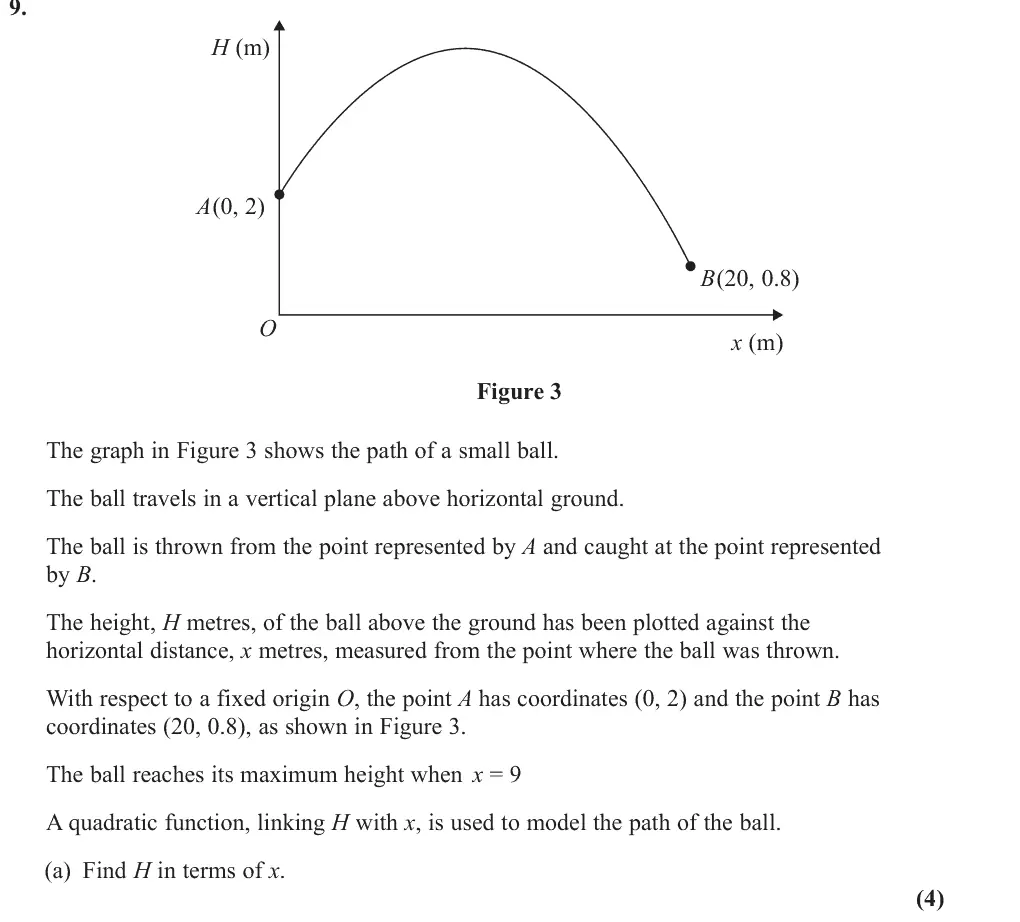
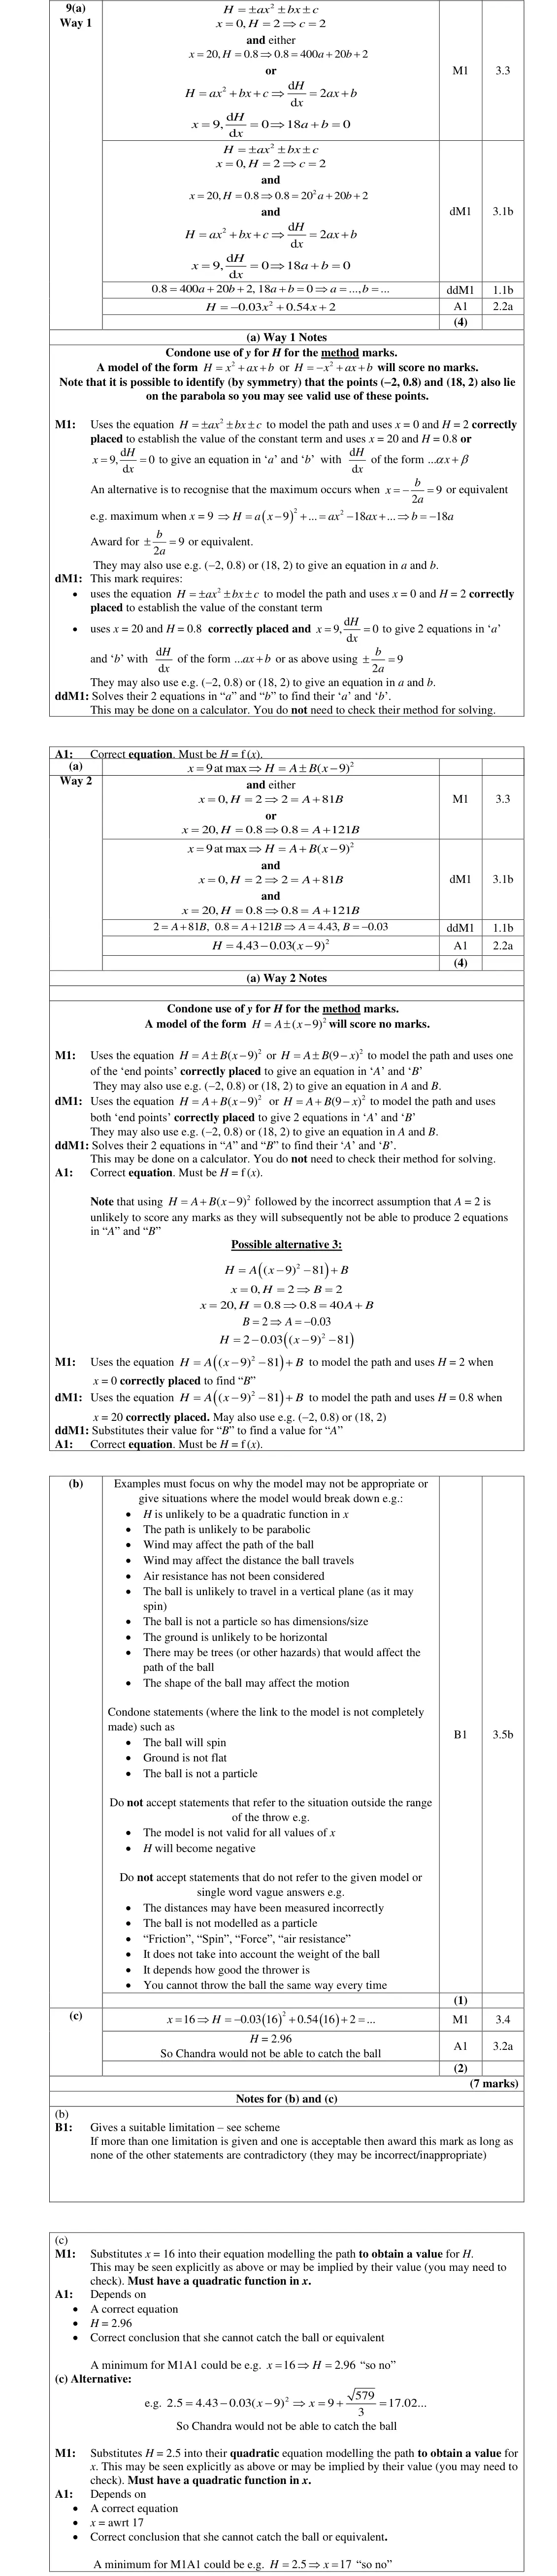
June 2024 · Paper 2 · Q9(a)4 marks
Mark scheme (whole question; this part is marked with the orange bar)
Examiner's comment
and candidates who achieved an incorrect quadratic model in part (a) were still able to achieve the method mark. When candidates achieved full marks in part (a) they usually went on to achieve full marks in part (c) too. It was extremely rare for H = 2.96 to be achieved and an incorrect
Common mistakes
H = ax² + bx + c with c = 2
use (20, 0.8) and max at x = 9 (dH/dx = 0 or −b/2a = 9)
H = −0.03x² + 0.54x + 2
assuming vertex form with A = 2 fails
June 2024 · Paper 2 · Q9(b)1 mark
Mark scheme (whole question; this part is marked with the orange bar)
Examiner's comment
In part (b), most candidates were able to identify a limitation of the model, so this part was well answered, often independently to the rest of the question. Most successful responses referred to the fact that air resistance hadn't been considered. Other common responses achieving the mark included “the spin of the ball has not been considered” or “the ground is unlikely to be completely horizontal/flat”. A small number of responses did correctly refer to the fact that H is unlikely to be a perfect quadratic function in x or that the ball is unlikely to travel in a vertical plane therefore adding a third dimension to the motion. The most common incorrect responses involved candidates referring to the ball outside its flight path e.g. “H will become negative” or “the ball will go below the ground”. Some candidates did give vague single word answers like “air resistance” or “spin” which did not gain them any credit as there was no link to the model.
Common mistakes
must link to the model, e.g. path unlikely to be exactly parabolic, air resistance not considered, ball spins
single words ("air resistance") not enough
"H becomes negative" is outside the throw so not accepted
June 2024 · Paper 2 · Q9(c)2 marks
Mark scheme (whole question; this part is marked with the orange bar)
Examiner's comment
In part (c), the vast majority of candidates recognised the need to substitute x = 16 into their model and candidates who achieved an incorrect quadratic model in part (a) were still able to achieve full marks in part (c) too. It was extremely rare for H = 2.96 to be achieved and an incorrect conclusion to follow as most candidates knew to conclude correctly, fully linking back to the question. Very few candidates attempted the alternative approach of substituting in H = 2.5 into the model to create and solve a quadratic equation in x. This approach did then require candidates to understand that the (larger) solution of x = 17.0 meant that Chandra could not catch the ball. This seemed a more challenging approach than just substituting x = 16 in the model.
Common mistakes
substitute x = 16: H = 2.96 > 2.5 so Chandra cannot catch it
conclusion must link back to the question
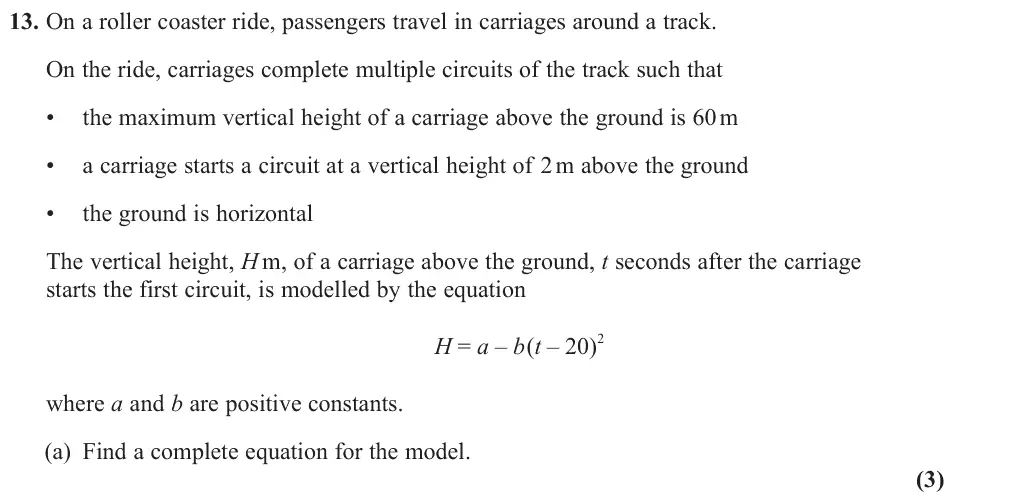
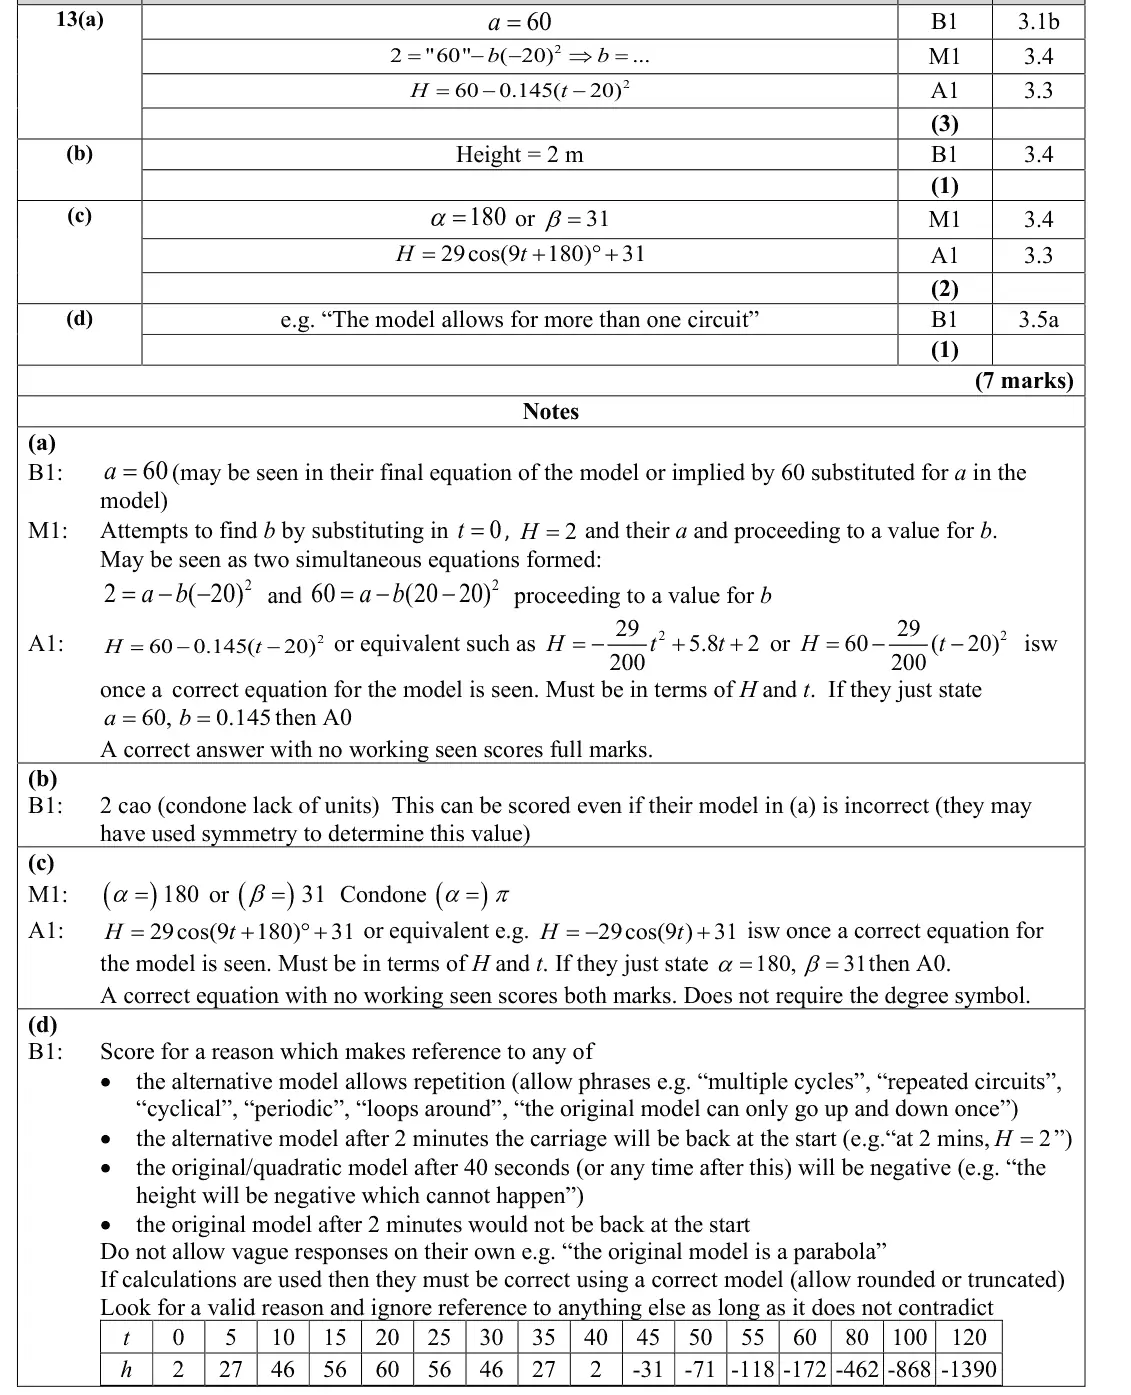
June 2023 · Paper 1 · Q13(a)3 marks
Mark scheme (whole question; this part is marked with the orange bar)
Examiner's comment
A significant number of candidates found this question very challenging, with a fair proportion of blank answers, and another significant number working with various substitutions in (a) that were quickly abandoned. Those who were able to work with both the quadratic and trigonometric models confidently were able to score highly and demonstrated a good understanding of how mathematics can be used to model real life contextual problems. In part (a), there were two common approaches that led to successfully scoring full marks. One was applying the knowledge that 2 ( 20) 0 b t - = when 60 H = which therefore meant 60 a = . This then enabled the candidate to substitute 2, 0 H t = = and find a complete equation. It was clear when candidates were able to apply this knowledge, and knowing this gave them a huge advantage in this question. Noticing that b was positive was pivotal when taking this approach. The other approach that led to successful answers involved multiplying out the brackets, and differentiating with respect tot. This enabled the candidate to find that 20 t = when d 0 d H t = , thus overcoming a shortfall in knowledge over when geometrically the maximum occurs in a negative quadratic. This second approach led to success less often, and candidates often ended up with a page of various quadratic expressions and equations that looked costly in terms of time and did not yield marks.
Common mistakes
a = 60 (maximum height)
use H = 2 at t = 0 to find b = 0.145
complete equation in H and t
June 2023 · Paper 1 · Q13(b)1 mark
Mark scheme (whole question; this part is marked with the orange bar)
Examiner's comment
A significant number of candidates found this question very challenging, with a fair proportion of blank answers, and another significant number working with various substitutions in (a) that were quickly abandoned. Those who were able to work with both the quadratic and trigonometric models confidently were able to score highly and demonstrated a good understanding of how mathematics can be used to model real life contextual problems. An overwhelming majority of candidates who scored full marks in (a) successfully found H to be 2 m in part (b). Some candidates still managed to find this value with either an incorrect answer in (a) or no answer at all, by perhaps noticing that due to the symmetry of the quadratic, the height after 40 seconds was the same as at the start, which they are told was 2 m in the question.
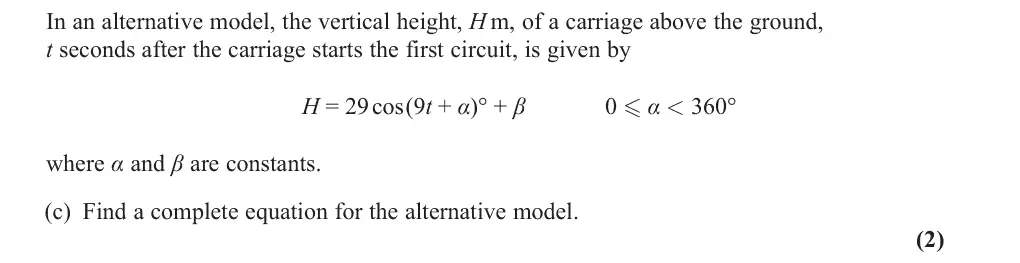
June 2023 · Paper 1 · Q13(c)2 marks
Mark scheme (whole question; this part is marked with the orange bar)
Examiner's comment
A significant number of candidates found this question very challenging, with a fair proportion of blank answers, and another significant number working with various substitutions in (a) that were quickly abandoned. Those who were able to work with both the quadratic and trigonometric models confidently were able to score highly and demonstrated a good understanding of how mathematics can be used to model real life contextual problems. In part (c), a significant number of candidates had no real idea how to start this. Many attempts involved fruitlessly expanding cos(9 ) t + but most candidates who successfully found and did not do this. The candidates who realised that when 60 H = , cos(9 ) 1 t + = which meant 31 = had the most success. Candidates who did this typically then substituted 20 t = into cos(9 ) 1 t + = to find a value of . Candidates who found one value typically found the other. There were a number of candidates who found the two values that did not ‘find a complete equation’ as the question required. However, there were a pleasing number of fully correct solutions, and almost all candidates who found and continued to give the full model.
Common mistakes
β = 31 (mid-height), α = 180 so that H = 2 at t = 0
June 2023 · Paper 1 · Q13(d)1 mark
Mark scheme (whole question; this part is marked with the orange bar)
Examiner's comment
A significant number of candidates found this question very challenging, with a fair proportion of blank answers, and another significant number working with various substitutions in (a) that were quickly abandoned. Those who were able to work with both the quadratic and trigonometric models confidently were able to score highly and demonstrated a good understanding of how mathematics can be used to model real life contextual problems. In part (d), the most popular correct answers involved an identification of the cyclic nature of the trigonometric function, or realising the first model would become very negative. A significant number of incorrect answers involved candidates saying the original model would keep increasing over time, which showed a lack of understanding of the negative quadratic model. Others made reference to the alternative model being continuous which was too vague. Some candidates managed to score this mark without scoring any other mark on this question which was, again, pleasing to see candidates attempting later parts of questions even if they have made little progress on earlier parts.
Common mistakes
the cosine model repeats (multiple circuits)
the quadratic goes negative after 40 s
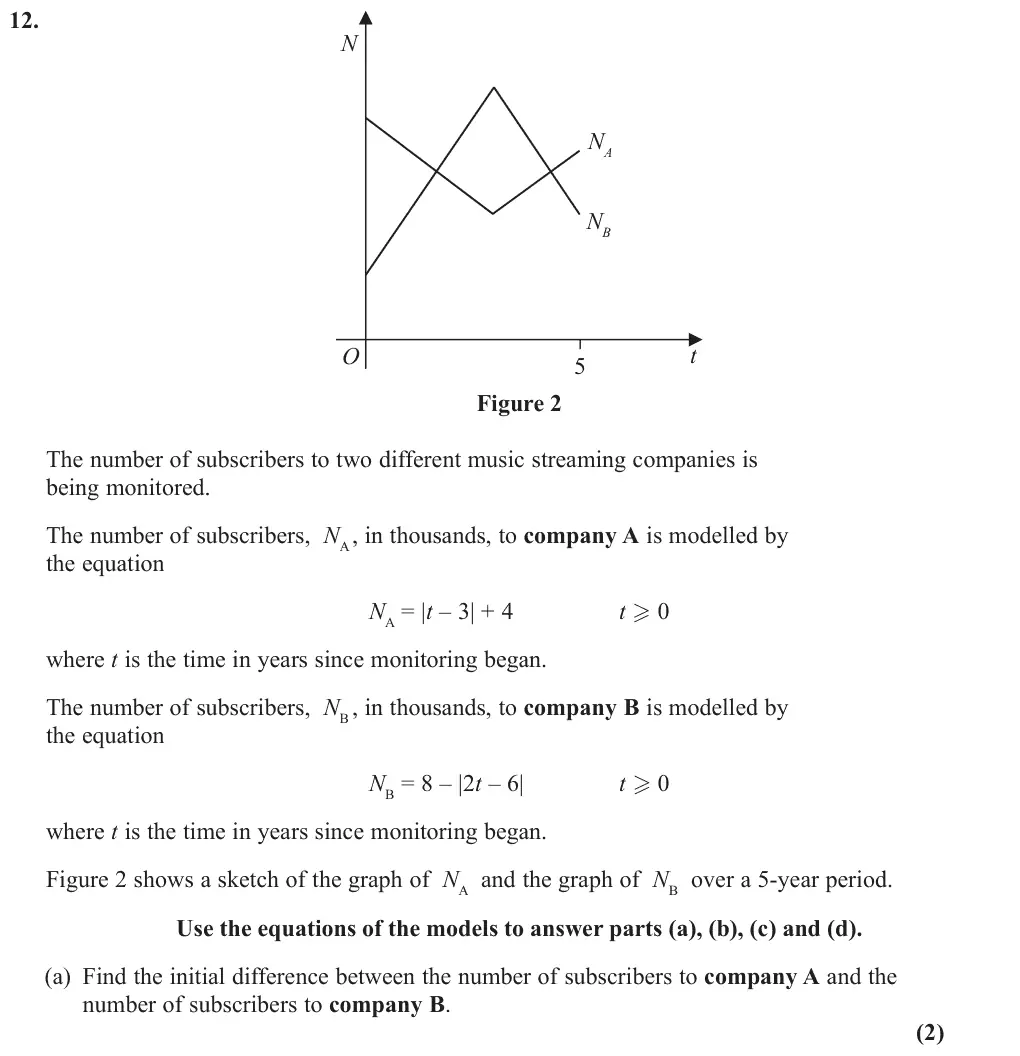
June 2023 · Paper 2 · Q12(a)2 marks
Mark scheme (whole question; this part is marked with the orange bar)
Examiner's comment
In part (a), most candidates were successful in understanding the requirement to substitute zero into NA and NB. There were some processing errors resulting in incorrect values for NA and NB. A significant number failed to score the method mark by not subtracting their values. There were a few candidates that did not recognise the question was scaled in thousands and left a final answer of 5.
Common mistakes
substitute t = 0: N_A − N_B = 7 − 2 = 5 thousand = 5000 subscribers (5 alone loses the A mark)
must subtract
June 2023 · Paper 2 · Q12(b)2 marks
Mark scheme (whole question; this part is marked with the orange bar)
Examiner's comment
In part (b), a large majority of candidates were able to deduce that T = 3 and most explanations were around the idea of the values increasing after this point. The next most common explanation centred on the graph being a minimum or having “turning point” at this location. There were also candidates who stated the gradient has increased or was positive.
Common mistakes
T = 3, when N_A is at its minimum and starts to increase (vertex of the modulus graph)
June 2023 · Paper 2 · Q12(c)5 marks
Mark scheme (whole question; this part is marked with the orange bar)
Examiner's comment
In part (c), a significant number of candidates failed to identify either of the correct equations. Many were able to identify and solve correctly at least one equation to find one critical value for t. A common error often followed their correct equation of 5 = 3t when they wrote the value of t as 3/5 and similarly, but less common, 13 = 3t leading to 3 13 t = . Some students kept the modulus signs within their equations and ignored them at various stages in their working which often led to incorrect equations. There was an array of methods seen trying to negotiate the modulus signs, and A B A B + = + was seen a few times and 2 2 2 A B k A B k + = + = was also seen. Those who found two values for t were generally able to score the 2nd follow through accuracy mark for choosing the outside region for their critical values. The biggest challenge was the final accuracy mark as quite a few candidates did not write the inequalities using set notation. Those who attempted set notation usually were unable to write their answer correctly in that form, some confusing with . A common answer was 5 13 3 3 t t which was condoned for this final mark. Those who attempted the squaring method in this part had minimal success depending on when they chose to square.
Common mistakes
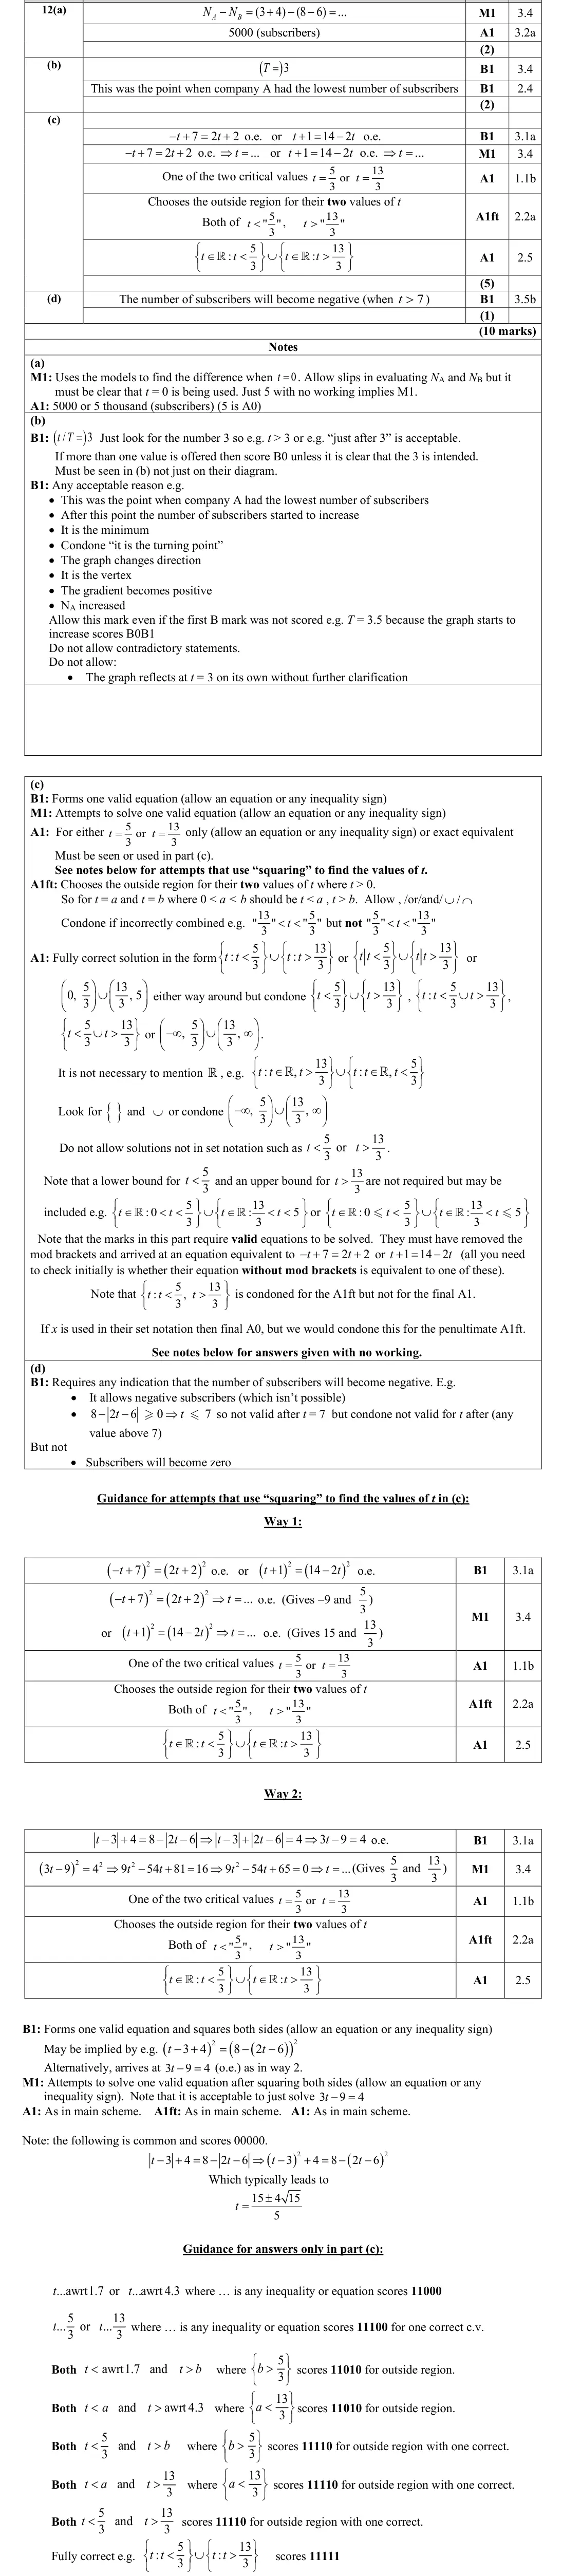
from the graph form the two valid linear equations without modulus: −t + 7 = 2t + 2 (t = 5/3) and t + 1 = 14 − 2t (t = 13/3)
outside region
answer in set notation {t : t < 5/3} ∪ {t : t > 13/3}
5 = 3t written as t = 3/5
squaring incorrectly
ignoring modulus signs
June 2023 · Paper 2 · Q12(d)1 mark
Mark scheme (whole question; this part is marked with the orange bar)
Examiner's comment
Many candidates were successful in part (d) even if they had not progressed with the other parts of the question. The majority of candidates correctly referenced the subscribers will become negative to obtain this B mark. Where a candidate attempted this part but did not obtain this mark, it was usually due to not making a reference to the number of subscribers becoming negative, saying it goes to zero or that it is linear or decreasing. Several candidates thought it couldn’t go above 8000 subscribers.
Common mistakes
N_B becomes negative for t > 7, impossible
"it becomes zero" or "it is linear/decreasing" not accepted
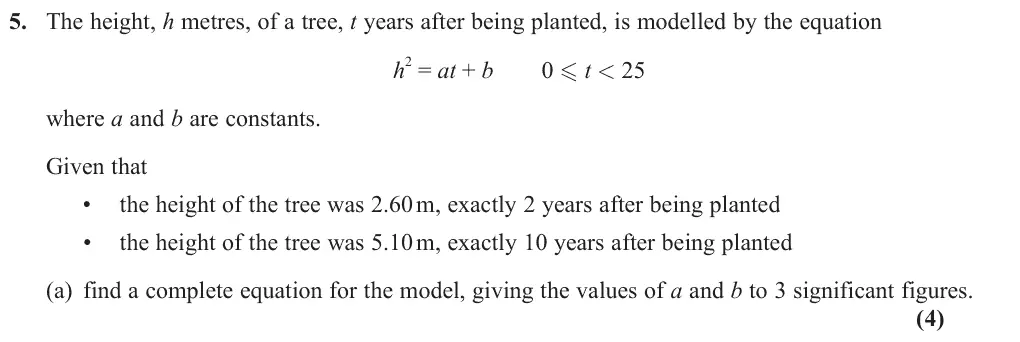
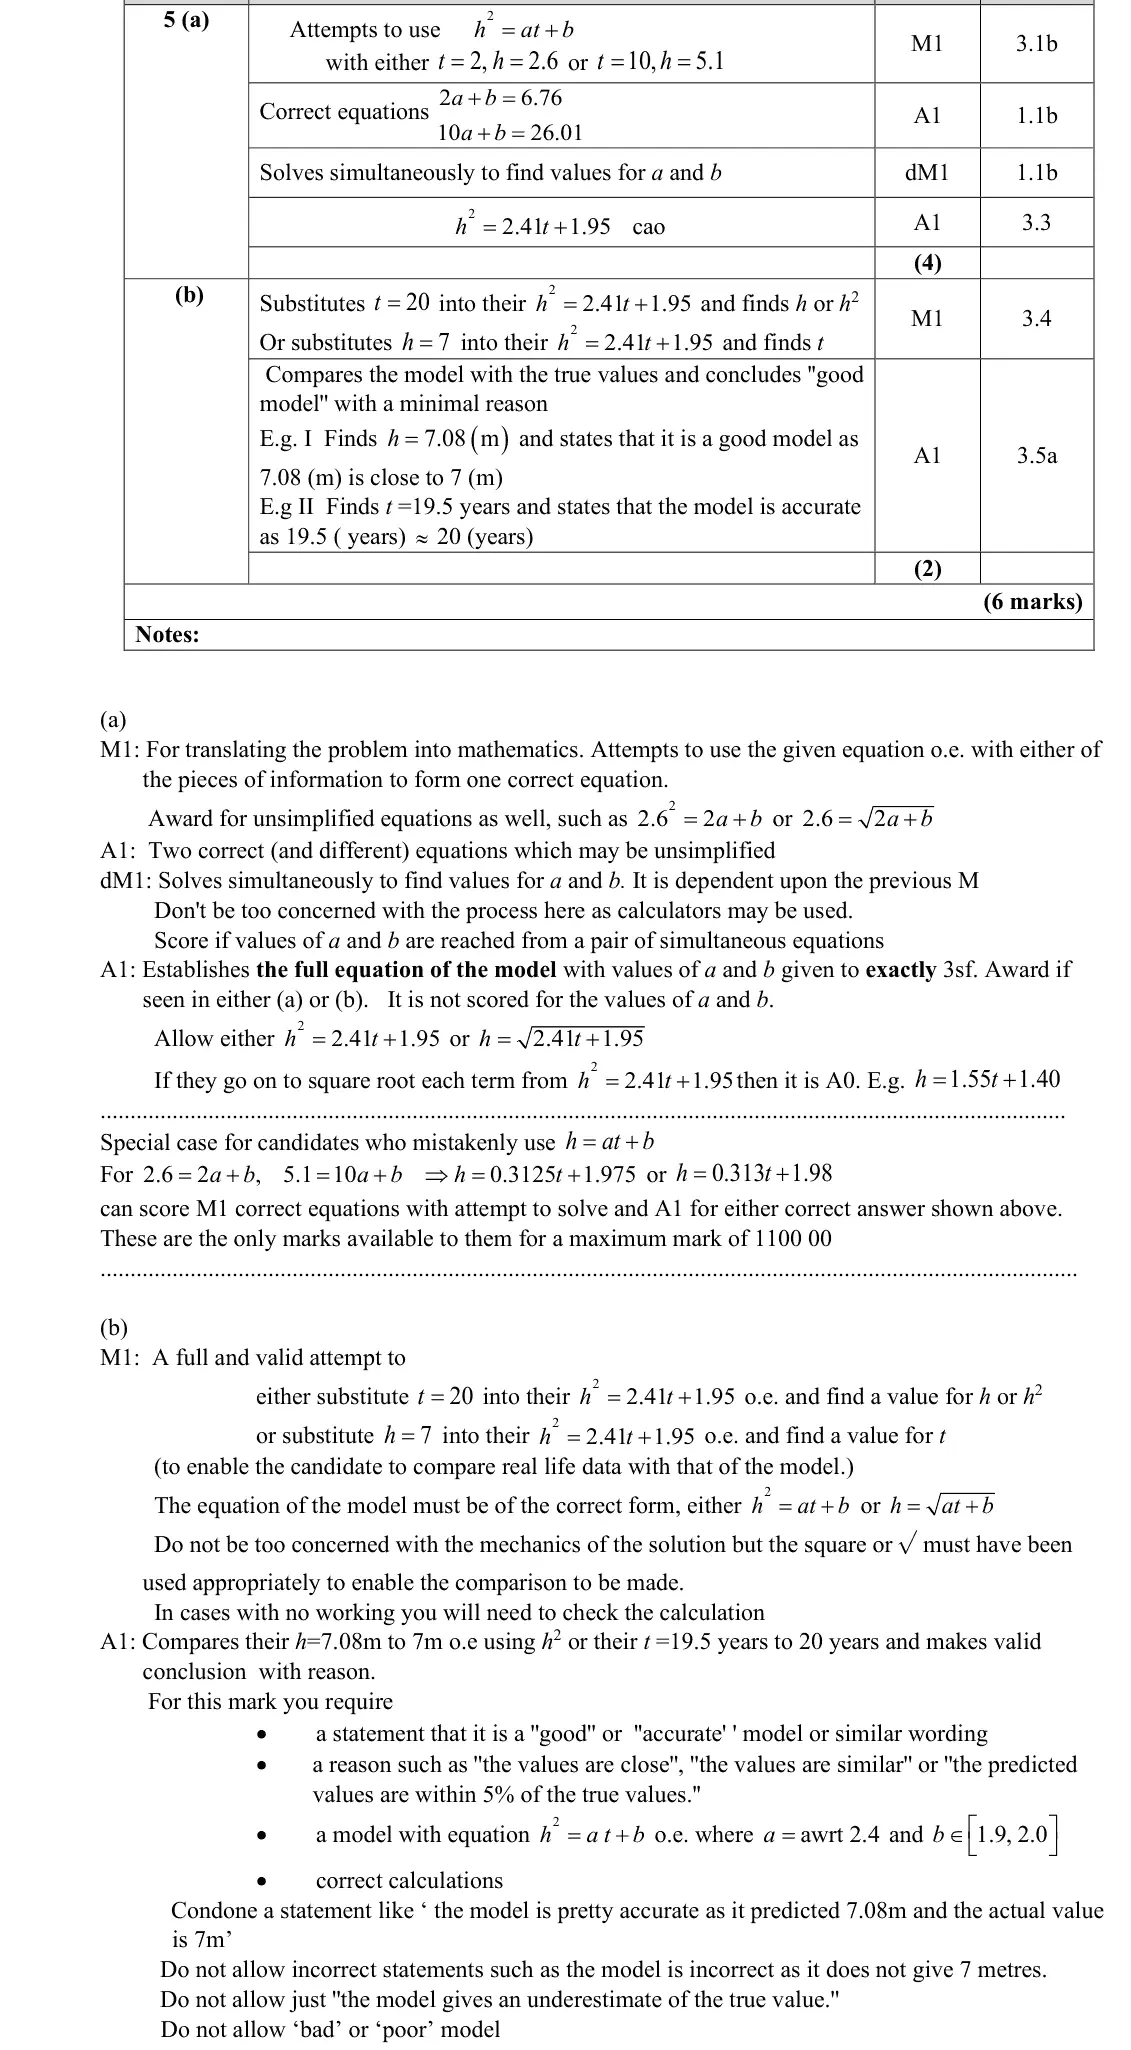
June 2022 · Paper 1 · Q5(a)4 marksEasy
Mark scheme (whole question; this part is marked with the orange bar)
Examiner's comment
This question involved solving simultaneous equations set within the context of the height of a tree modelled over a number of years. The question was very accessible for many candidates. In part (a) the majority of candidates gained the first three marks for forming and solving two correct simultaneous equations. Many went to a great deal of effort to solve the simultaneous equations using algebraic methods, whereas some just put the equations into a calculator and wrote down the values of the constants a and b. Some candidates used the 3 significant figure value of a to subsequently find the value of b, resulting in finding b as 1.94 rather than 1.95 and thus losing the final A mark. A significant number of candidates correctly found the values of the constants a and b, but then failed to state the equation of the model explicitly anywhere in their answer, losing the final A mark.
Common mistakes
square the heights: 2a + b = 6.76, 10a + b = 26.01
h² = 2.41t + 1.95 must be stated as a complete equation
using rounded a gives b = 1.94
using h = at + b is a special case
June 2022 · Paper 1 · Q5(b)2 marksEasy
Mark scheme (whole question; this part is marked with the orange bar)
Examiner's comment
This question involved solving simultaneous equations set within the context of the height of a tree modelled over a number of years. The question was very accessible for many candidates. In part (b) most candidates realised they had to substitute either t =20 or h =7 into their model and compare the value obtained with the given values. However, some candidates did not know how to evaluate the model with several coming to the wrong conclusion that the model was poor, because it didn’t give the exact values for h or t. There were quite a few candidates who correctly calculated the percentage error as an impressive comparison. It is very important for candidates to give a reason for their answer when the question explicitly demands it.
Common mistakes
t = 20 gives h = 7.08 m (or h = 7 gives t = 19.5) so a good model as close to the true value
a reason is required
"poor model because not exactly 7" is wrong
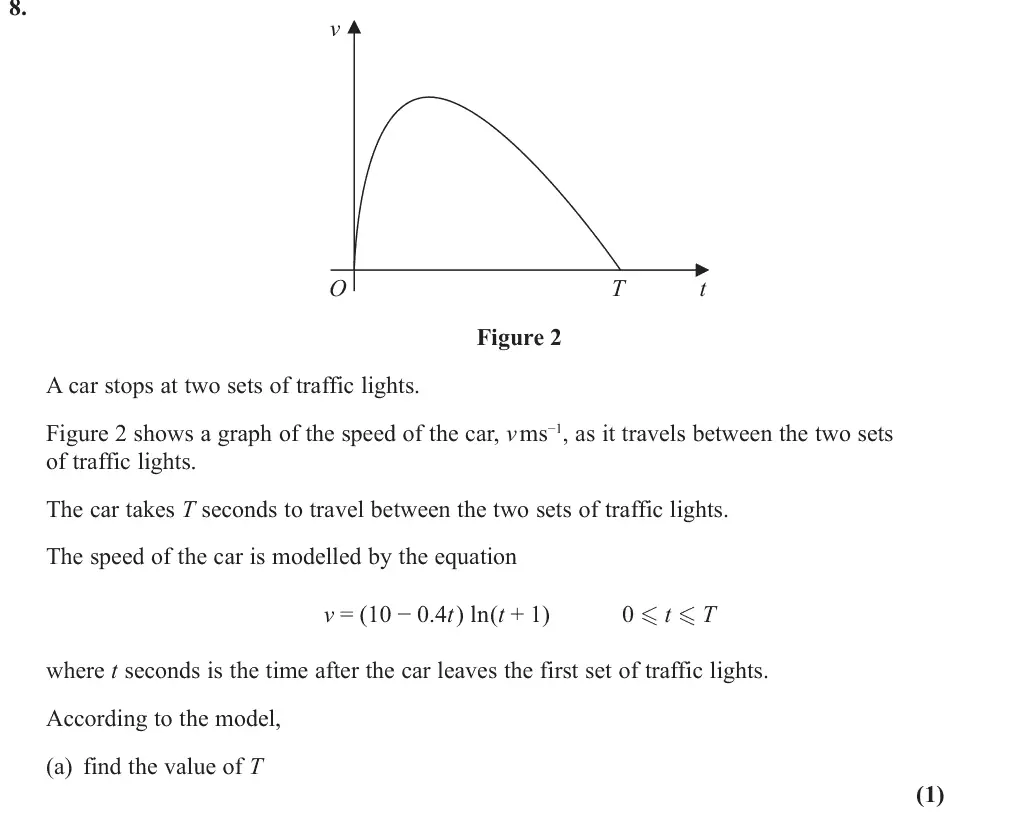
June 2022 · Paper 1 · Q8(a)1 markMedium
Mark scheme (whole question; this part is marked with the orange bar)
Examiner's comment
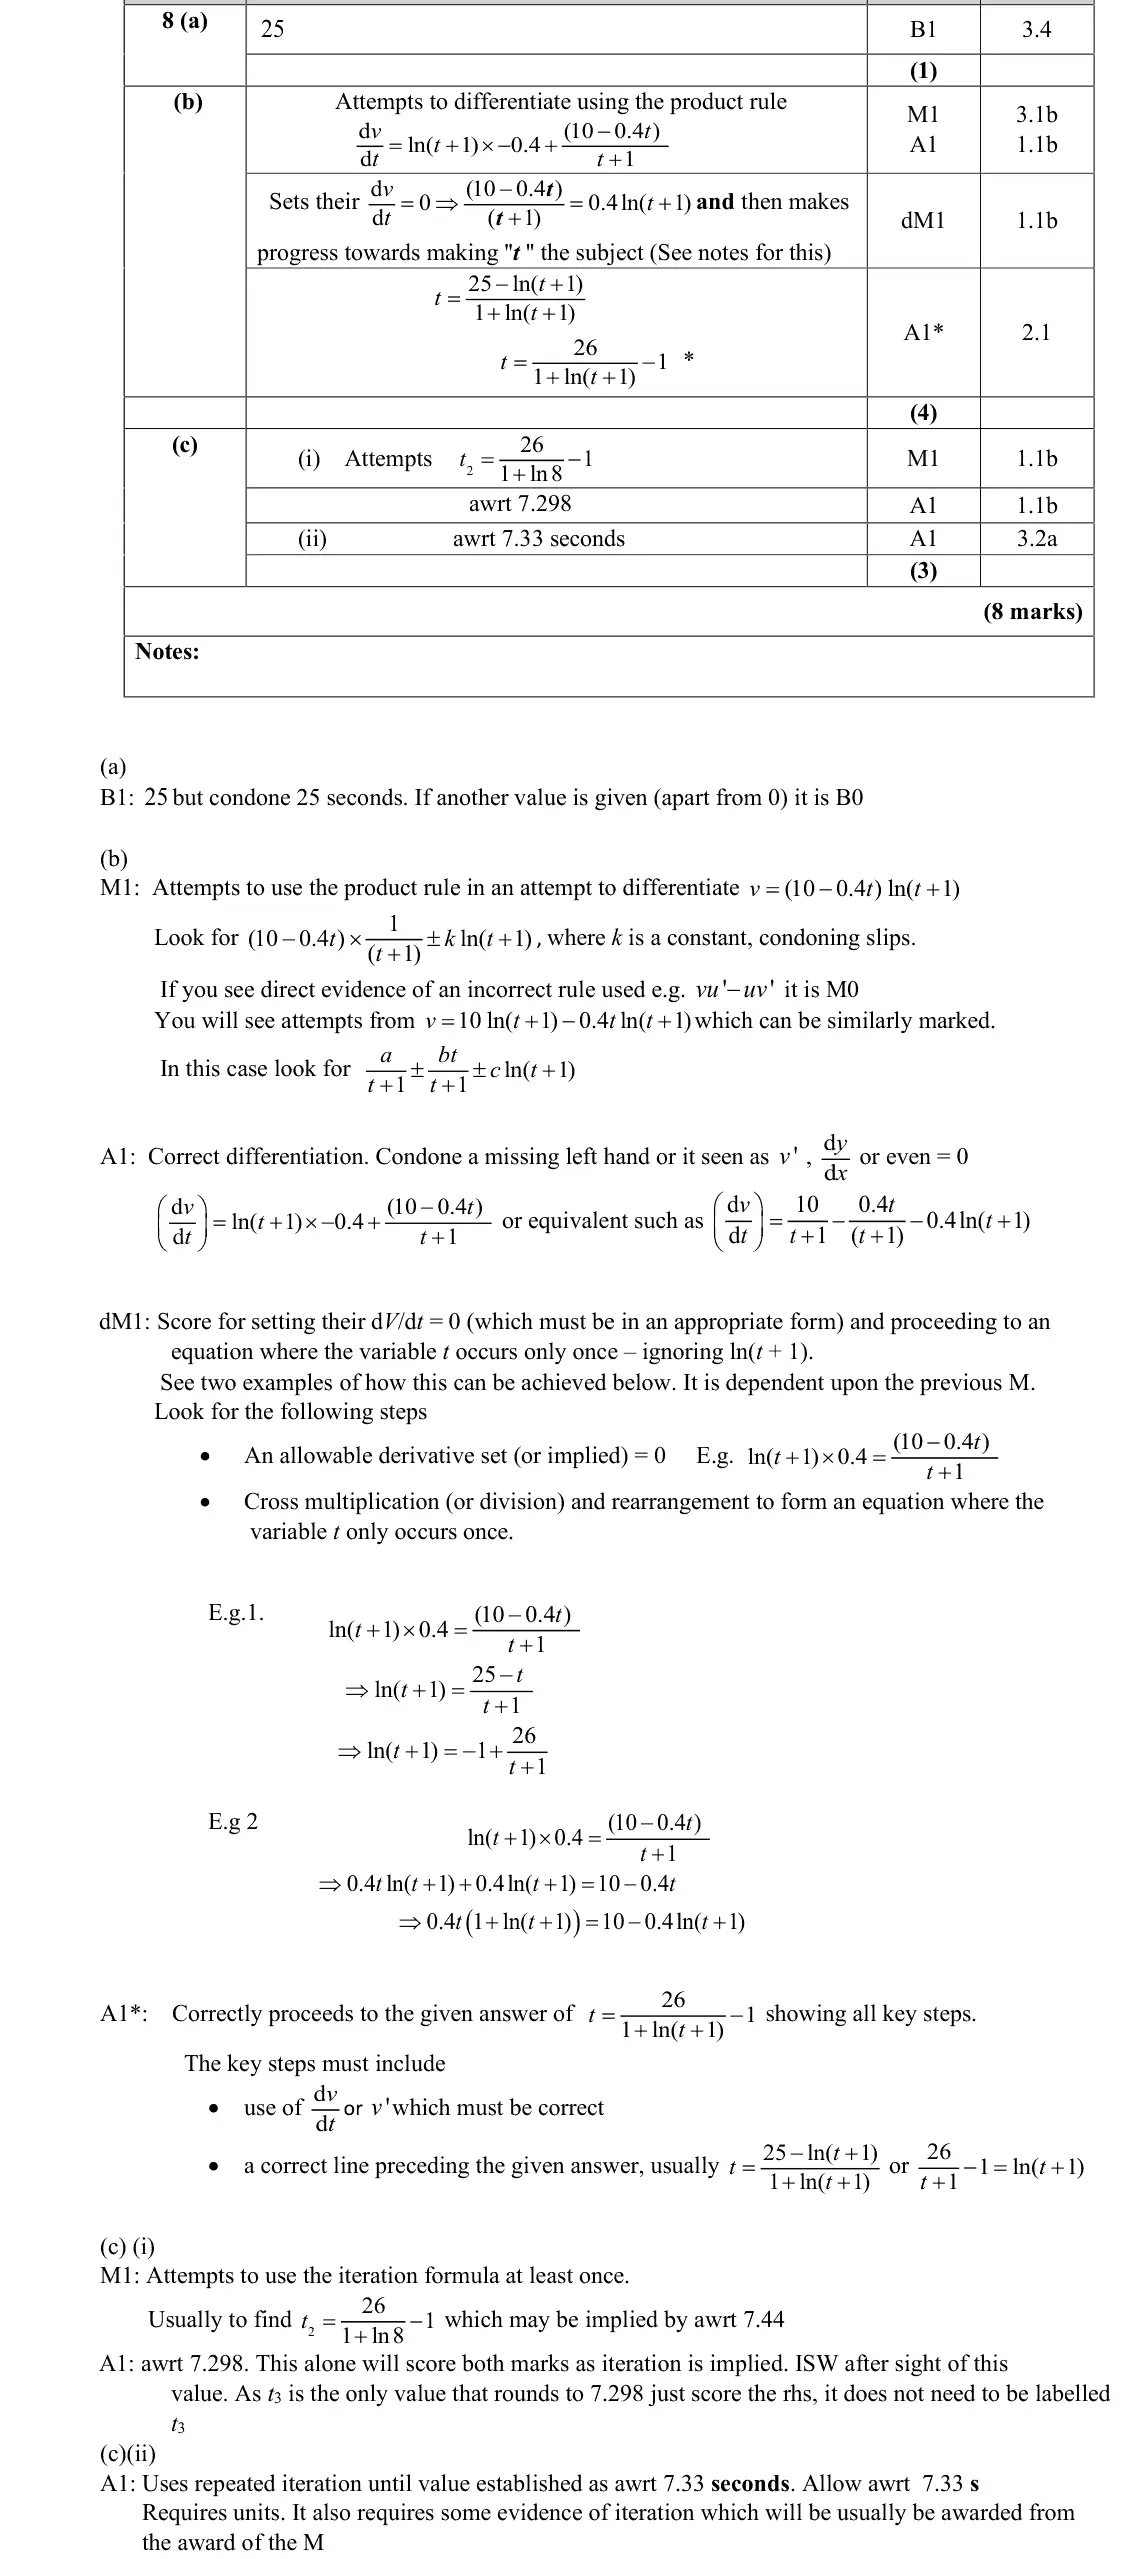
This was the second modelling question on the paper. The given equation modelled the speed of and scored marks in the more accessible parts (a) and (c). Most candidates managed to reach the correct answer of 25 in part (a). A common incorrect answer was 10, (10 0.4 )ln( 1) v t t = - + possibly from sight of the 10 in the given equation The first two marks in part (b) were often achieved by those who attempted it. Using the product rule to find
Common mistakes
v = 0 when 10 − 0.4t = 0, T = 25
10 is a common wrong answer
June 2022 · Paper 2 · Q9(a)4 marks
Mark scheme (whole question; this part is marked with the orange bar)
Examiner's comment
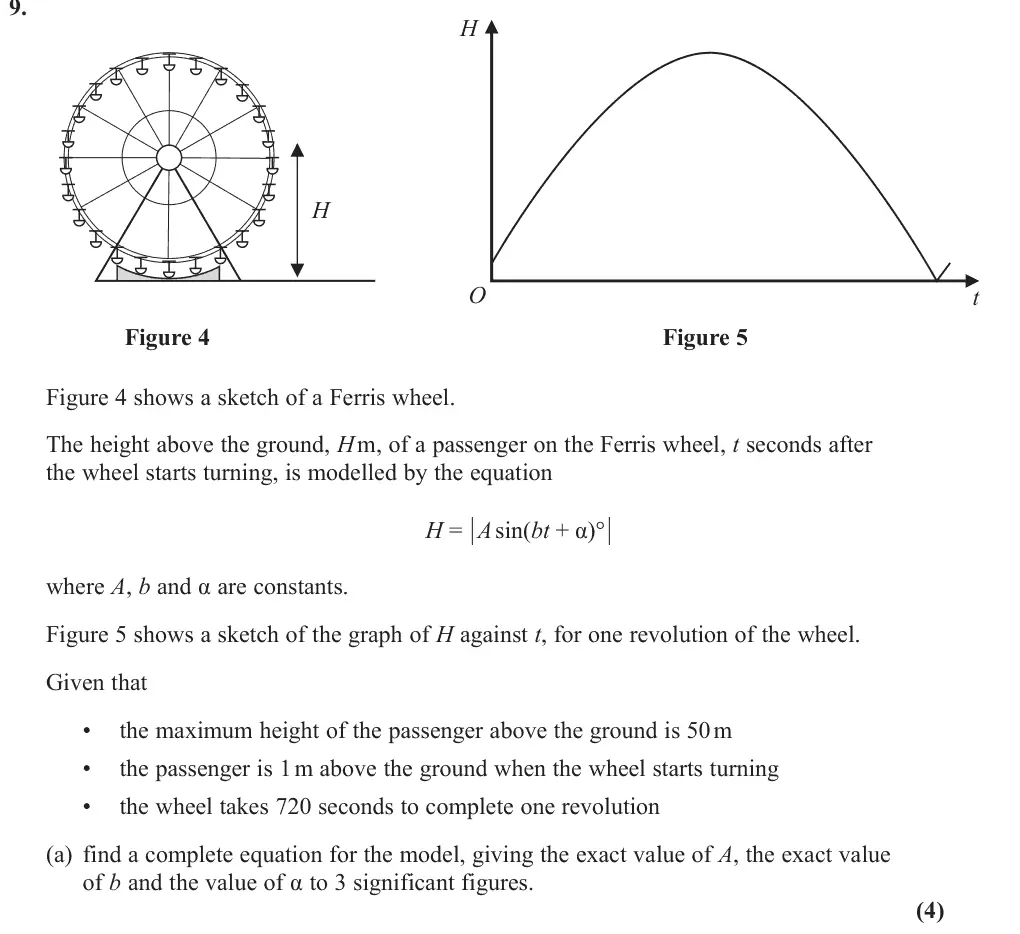
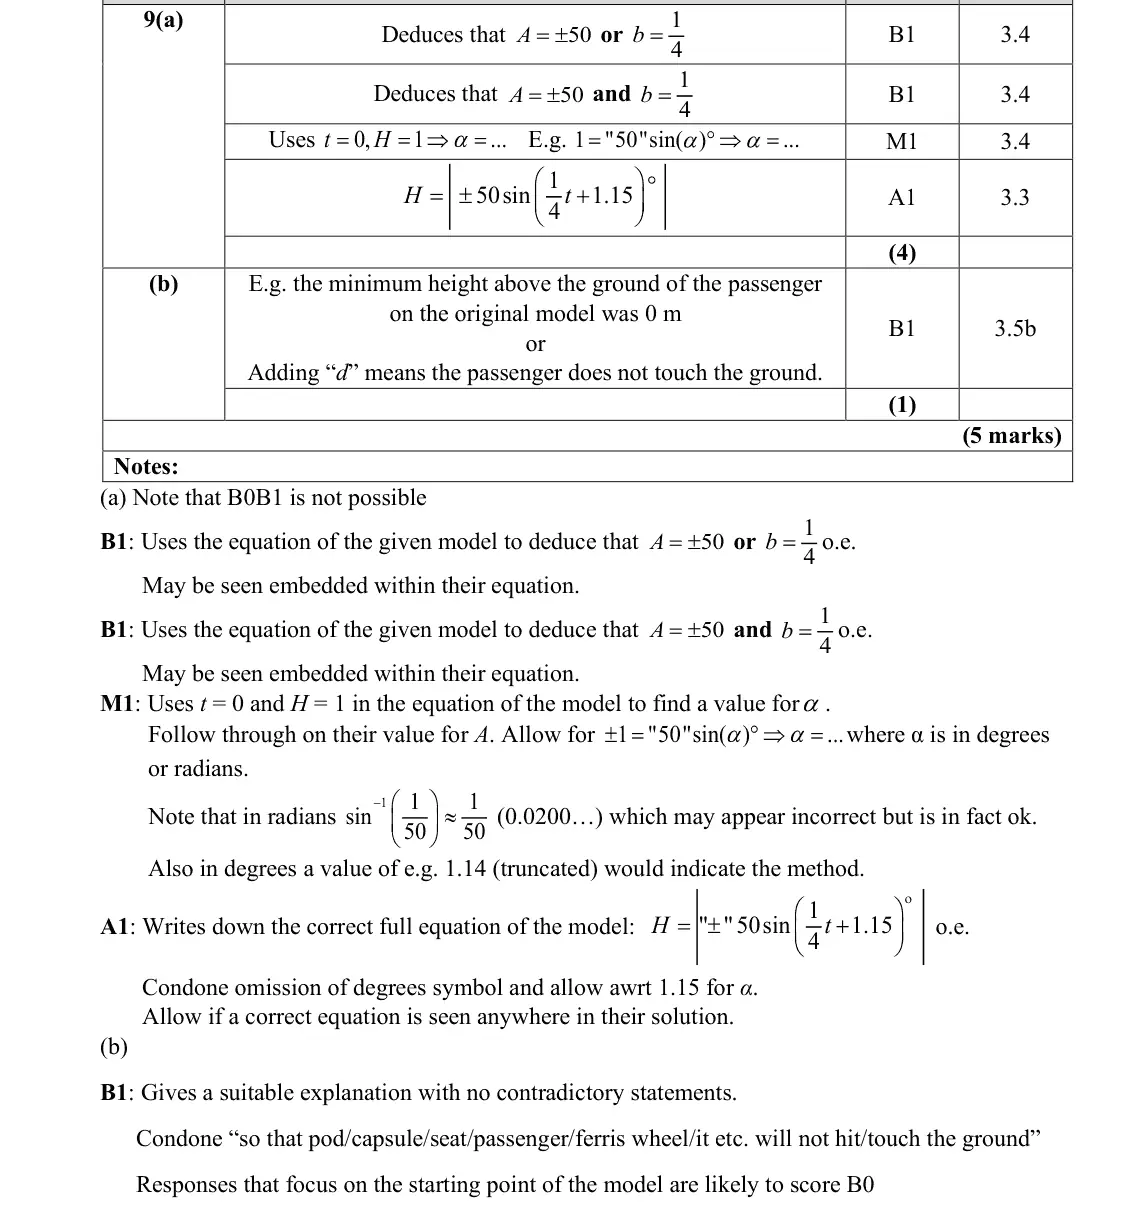
This was a challenging question for the majority of the candidates with very few scoring most 1 or 2 marks. These were the initial B1 mark for realising that 𝐴𝐴= 50, however all four of the marks in part (a). For those that attempted the question, most scored at many wrote that 𝐻𝐻= 50 and did not relate that 𝐻𝐻 meant 𝐴𝐴. The second B mark for finding a value for 𝑏𝑏 was very poorly answered, with many not realising a simple 720 was needed and attempted to use an ‘𝑅𝑅-𝛼𝛼’ method or failed to take 180 calculation of d𝐻𝐻 into account transformations of the sine function, showing a lack of understanding of d𝑡𝑡 with very limited success. A the properties of the sine wave. Some also tried to use small minority of students achieved b = 1/4. The best answers tended to use transformation arguments, recognising that the full cycle depicted must represent a scale factor of 4 though many students attempting this approach did not appreciate the effect of the modulus in determining the value of b, obtaining instead a value of b = ½. A common incorrect method came from consideration of the wheel taking 720 seconds to complete 1 revolution leading candidates to solve the equation 720b + 1.15 = 180 or from thinking that the maximum occurs at t = 360 leading to 360b + 1.15 = 90. Of those 𝜋𝜋 2𝜋𝜋 that managed to access the question, few mixed radians with degrees and managed to 720 or 720, which scored no marks. 1010 was the most common mark profile for this question, as a significant number of students went on to find 𝛼𝛼 correctly give an answer as (albeit occasionally in radians) as they were able to spot that at 𝑡𝑡= 0, 𝐻𝐻= 1. Sadly, a few that did achieve all three elements did not conclude with an equation of the model and so lost the (easy) last mark, with this final mark being scored very rarely, at less than 5% of the cohort (the second least commonly scored mark in the paper). In part (b), many candidates incorrectly referred to the fact that the passenger was 1 m above the ground and related the value of 𝑑𝑑 to this fact, for the most part because they had not appreciated that the original model already took this into account. Some responses referred to the fact that the height needed to be a positive value or could not There were many attempts at part (b) without any attempt at part (a). It was unfortunately quite common that responses to this part were very difficult to read and centres need to stress to candidates that work cannot be awarded marks if it is illegible.
Common mistakes
A = 50
the modulus means one revolution is half a sine period, so 180/b = 720 gives b = ¼ (not ½ or 1/720)
α from 1 = 50 sin α, α = 1.15 (degrees)
give the full equation H = modulus of 50 sin(¼t + 1.15)°
June 2022 · Paper 2 · Q9(b)1 mark
Mark scheme (whole question; this part is marked with the orange bar)
Examiner's comment
than 5% of the cohort (the second least commonly scored mark in the paper). In part (b), many candidates incorrectly referred to the fact that the passenger was 1 m above the ground and related the value of 𝑑𝑑 to this fact, for the most part because they had not appreciated that the original model already took this into account. Some responses referred to the fact that the height needed to be a positive value or could not be negative, again missing that the modulus signs in the original model accounted for this. Some responses did not refer to the context of the model in their explanation. ground without adding the constant ‘𝑑𝑑.’ There were also a few illogical answers Overall, around a fifth of candidates understood that the passenger would touch the referring to air resistance, etc. A few students also incorrectly though that ‘+ d’ was in reference to the different heights of the passengers. A small number of candidates seemed to think that the graph showed the path of the position of the passenger, referencing that the passenger “bounced off the ground” and that the ‘+ d’ had the effect of smoothing out the ride. When students were successful in this part the most common responses were that ‘+ d’ meant that: the Ferris wheel would not touch/scrape the ground, the passenger/seat cannot touch the ground or there needed to be a minimum gap between the passenger/wheel and the ground. There were many attempts at part (b) without any attempt at part (a). It was unfortunately quite common that responses to this part were very difficult to read and centres need to stress to candidates that work cannot be awarded marks if it is illegible.
Common mistakes
the original model has minimum height 0 m, so the passenger would touch the ground
answers about starting 1 m above the ground or H being non-negative score 0
June 2022 · Paper 2 · Q14(c)2 marks
Mark scheme (whole question; this part is marked with the orange bar)
Examiner's comment
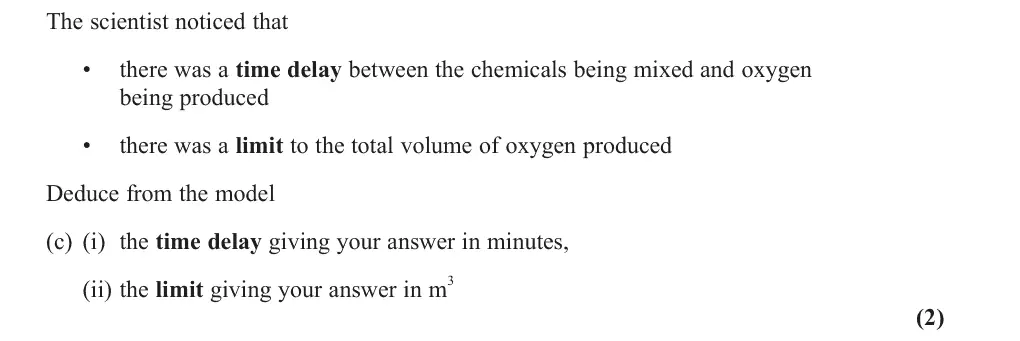
In part (c) the solution of 30mins was only obtained by the strongest candidates although many did not attempt this part of the question or possibly failed to see it. Of those that did attempt this part, a common answer was to obtain ½ but not recognise the units of the question were in hours, some giving it incorrectly as 0.5 minutes As the equation for the volume was a given in this question most candidates were able to attempt this in spite of their attempt at part (b). Candidates gave the correct 6m3 although a substantial number thought that 3m3 was the answer. Although candidates were not required to provide units, many did so correctly and marks were rarely lost for stating incorrect units although a few instances of mm3 were seen.
Common mistakes
(i) V = 0 at t = ½ hour = 30 minutes (not 0.5 or 0.5 minutes)
(ii) V → 6 m³ as t → ∞ (3 is wrong)
Oct 2021 · Paper 1 · Q12(a)5 marks
Mark scheme (whole question; this part is marked with the orange bar)
Examiner's comment
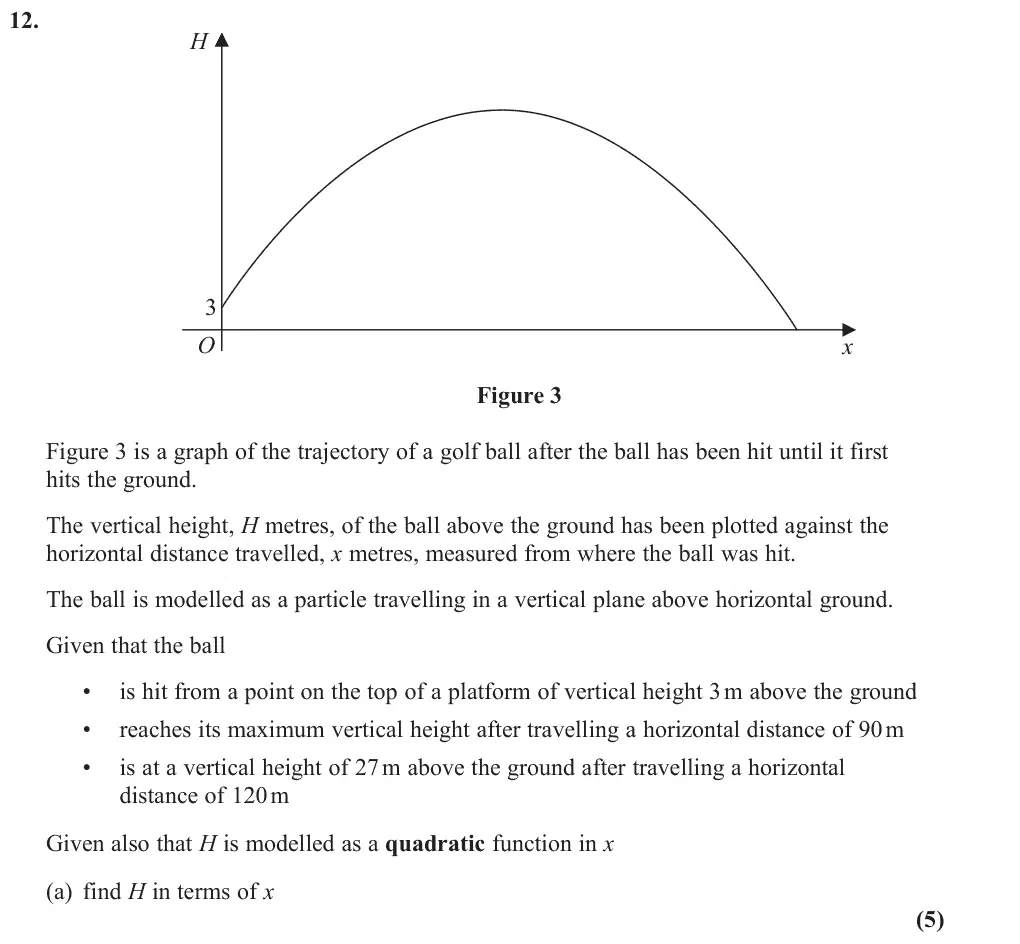
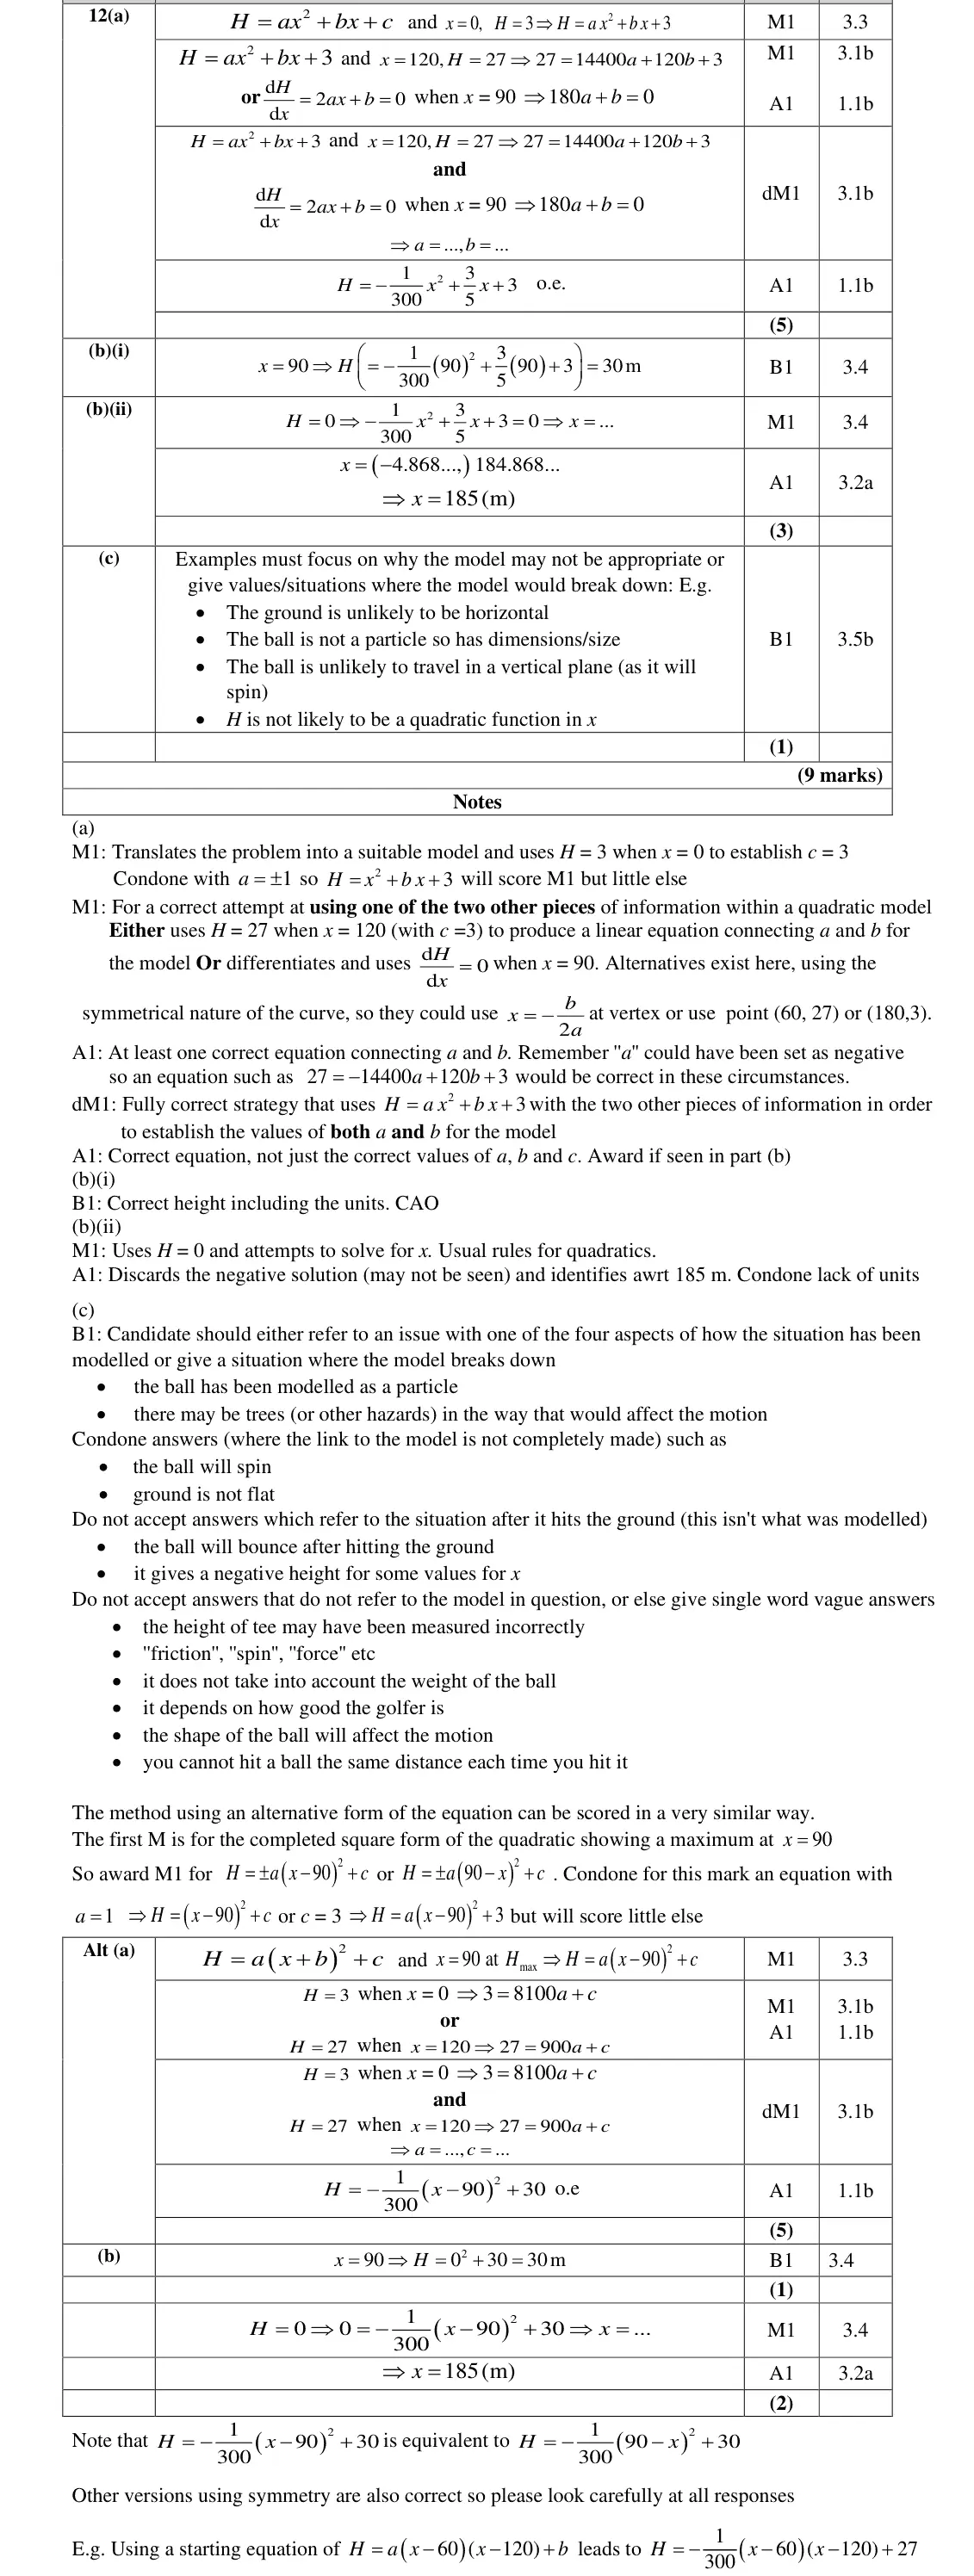
This was the second modelling question on this paper. It proved to be a significant discriminator between candidates, with a significant minority making little or no progress. It certainly seems to be a topic that students find hard to access. Part (a) The most common approach which led to either partial or complete success was to start with H=ax2+bx+c and use (0,3) to find that c =3. Many candidates then used (120,27) to find an equation connecting a and b, but sometimes no more progress was made. Of those who did make further progress, the most common approach was to use differentiation and the knowledge that the gradient was zero when x=90 to get a second equation in a and b. Candidates using this approach often went on to get (a) fully correct and then also to gain most if not all of the marks in (b) as well. It was only rarely that there was a misunderstanding about H=0 rather than H=3 when x=0. There were other methods used in (a) and any of these could have led to success if applied correctly. For example, using the fact that the quadratic has a turning point when x =90 and so H = a(x-90)2+c was used correctly by some candidates. Alternatively, using additional implied points such as (60,27) or (180,3) due to the symmetry of quadratic curves, was used appropriately by candidates.
Common mistakes
H = ax² + bx + 3 (H = 3 when x = 0, not 0)
use H = 27 at x = 120 and dH/dx = 0 at x = 90 (or vertex form a(x − 90)² + c, or symmetry points (60, 27), (180, 3))
H = −x²/300 + 3x/5 + 3
Oct 2021 · Paper 1 · Q12(b)3 marks
Mark scheme (whole question; this part is marked with the orange bar)
Examiner's comment
This was the second modelling question on this paper. It proved to be a significant discriminator between candidates, with a significant minority making little or no progress. It certainly seems to be a topic that students find hard to access. Part (b) Both parts were done well by candidates who had achieved a correct answer to (a). Part (b) (i) There were only a very few who omitted the units here. A wrong answer to (a) would have had made it difficult to gain the accuracy mark here. Part (b)(ii) A wrong answer to (a) could have scored a method mark here if the candidate’s quadratic had been solved correctly.
Common mistakes
maximum at x = 90: H = 30 m (units needed)
set H = 0 and reject the negative root: 185 m
Oct 2021 · Paper 1 · Q12(c)1 mark
Mark scheme (whole question; this part is marked with the orange bar)
Examiner's comment
This was the second modelling question on this paper. It proved to be a significant discriminator between candidates, with a significant minority making little or no progress. It certainly seems to be a topic that students find hard to access. Part (c) A wide range of comments were quoted here– some of those that did not gain the B1. Many of these focussed on what happened to the ball after hitting the ground, or picked out a relatively trivial aspect such as the height of the tee being inaccurate. Others mentioned the weight of the ball, or that it depended on the force of the contact. There were many acceptable comments. These should have focussed on why one of the four modelling assumptions referred to in the question may not have been valid. Acceptable responses included the fact that the ball is not a particle, the ground may not be horizontal, the path may not be a quadratic (parabola) or it might not travel in a vertical plane (Spin was mentioned in this context).
Common mistakes
refer to an assumption of the model: ball not a particle, ground not horizontal, not in a vertical plane (spin), path not quadratic
comments about bouncing, negative heights, the weight of the ball or the golfer score 0
Oct 2021 · Paper 2 · Q15(d)1 mark
Mark scheme (whole question; this part is marked with the orange bar)
Examiner's comment
This question discriminated well between candidates that got this far, but it did appear that many candidates had simply run out of time, perhaps indicative of a generally lower understanding than in a June series because of it being a resit paper following the pandemic. The final mark in this question, in part (d), was rarely scored, and demonstrated that candidates are generally not well prepared to answer questions about refining models, as required in AO3.5c. Many candidates did attempt this part, often despite making little or no progress with the earlier parts of the question. Most concentrated on having an extra constant, wanted the average water level to be used, or simply restated the question by saying that the varying water level needed to be accounted for, without suggesting how this might be done. Others knew that they needed to adjust the model, but suggested exponential, linear or quadratic terms to do this, which would not have been appropriate. Again, there were some excellent and detailed explanations of how a trigonometric function could be included to taken into account the varying water level .
Common mistakes
the constant 3 must vary with t, e.g. a trigonometric function (not linear/quadratic or just "use an average")
June 2019 · Paper 1 · Q12(c)3 marksMedium
Mark scheme (whole question; this part is marked with the orange bar)
Examiner's comment
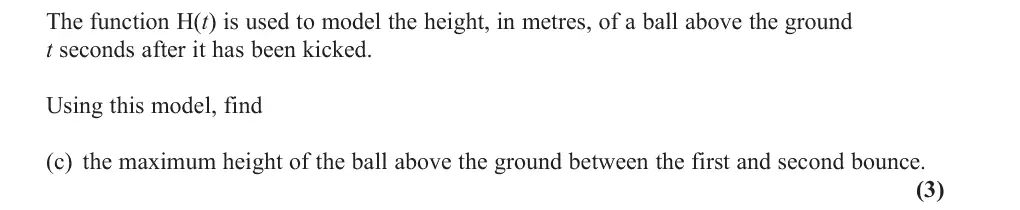
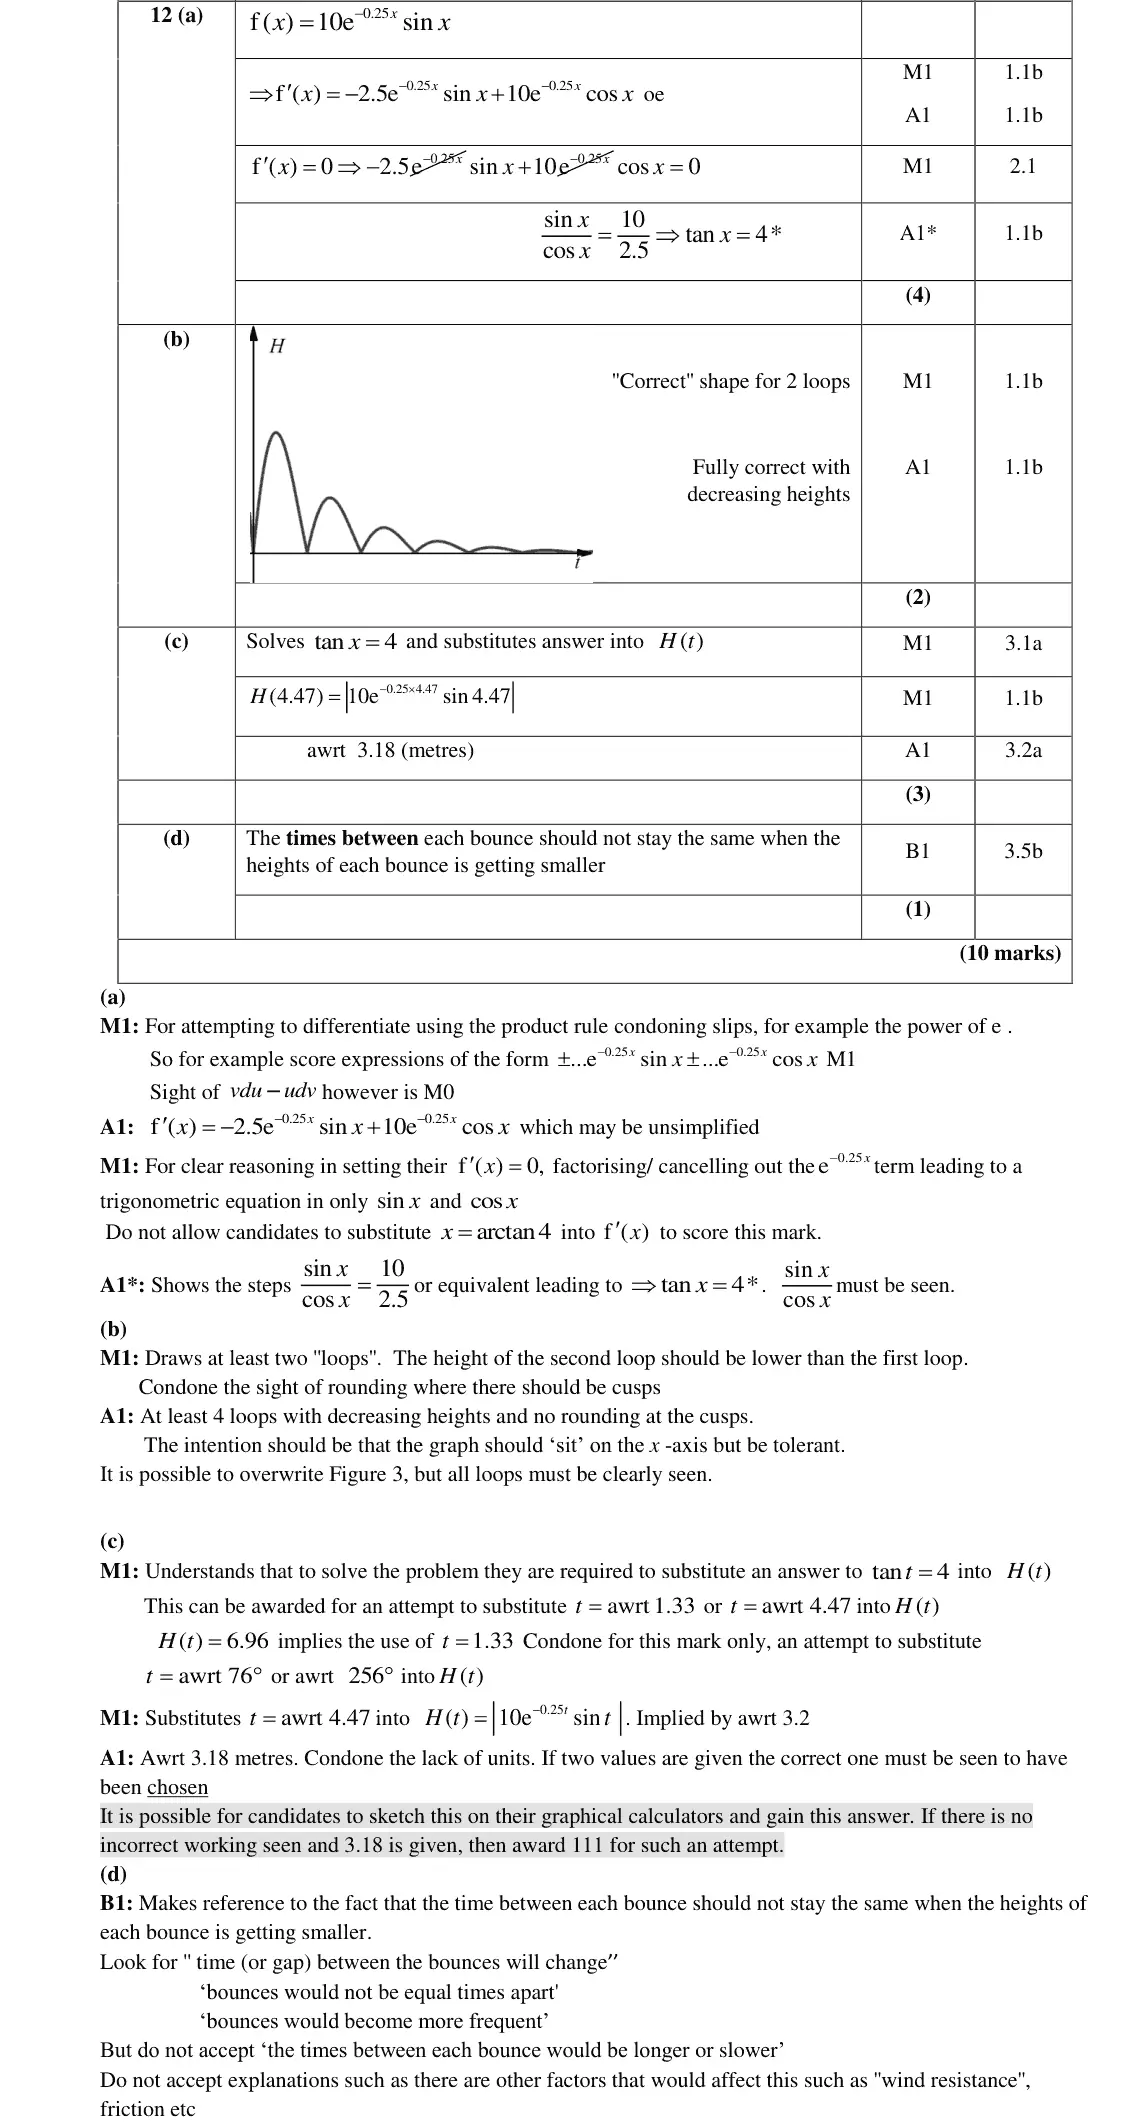
This question discriminated well between students of all abilities with part (a) and (b) more accessible to students compared to part (c) and (d). There was less success in part (c). Attempts at this part were varied, with a sizeable proportion not making the connection with part (a) at all and attempting to find the value of H(t) at pi /2 or some other value, or failing to substitute into H(t) at all. Many solved tan x = 4 to find the acute angle but did not then look for the further solution which was needed for the height between the first and second bounces and so achieved only the first mark. Also, use of degrees instead of radians was a common error, but this was allowed the first method mark. The magnitude of their resulting answer should have alerted them to the fact that something had gone very wrong.
Common mistakes
need the second solution of tan t = 4, t = 4.47 (not 1.33)
radians not degrees
H ≈ 3.18 m
June 2019 · Paper 1 · Q12(d)1 markMedium
Mark scheme (whole question; this part is marked with the orange bar)
Examiner's comment
This question discriminated well between students of all abilities with part (a) and (b) more accessible to students compared to part (c) and (d). Part (d) was another part with a varied array of answers. Common incorrect responses referred to negative time, and the times between each bounce would be longer or that the ball would not bounce forever. Many students gave a rote answer of “the effect of air resistance has not been taken into account” or “energy loss” or similar vague reasons rather than relate to the context of the question. Since the model may have taken air resistance into account (the contributing factors to the model were not listed in the question), such an answer was unacceptable.
Common mistakes
time between bounces stays constant (π) while heights decrease
vague "air resistance" answers not accepted
June 2019 · Paper 2 · Q9(c)3 marks
Mark scheme (whole question; this part is marked with the orange bar)
Examiner's comment
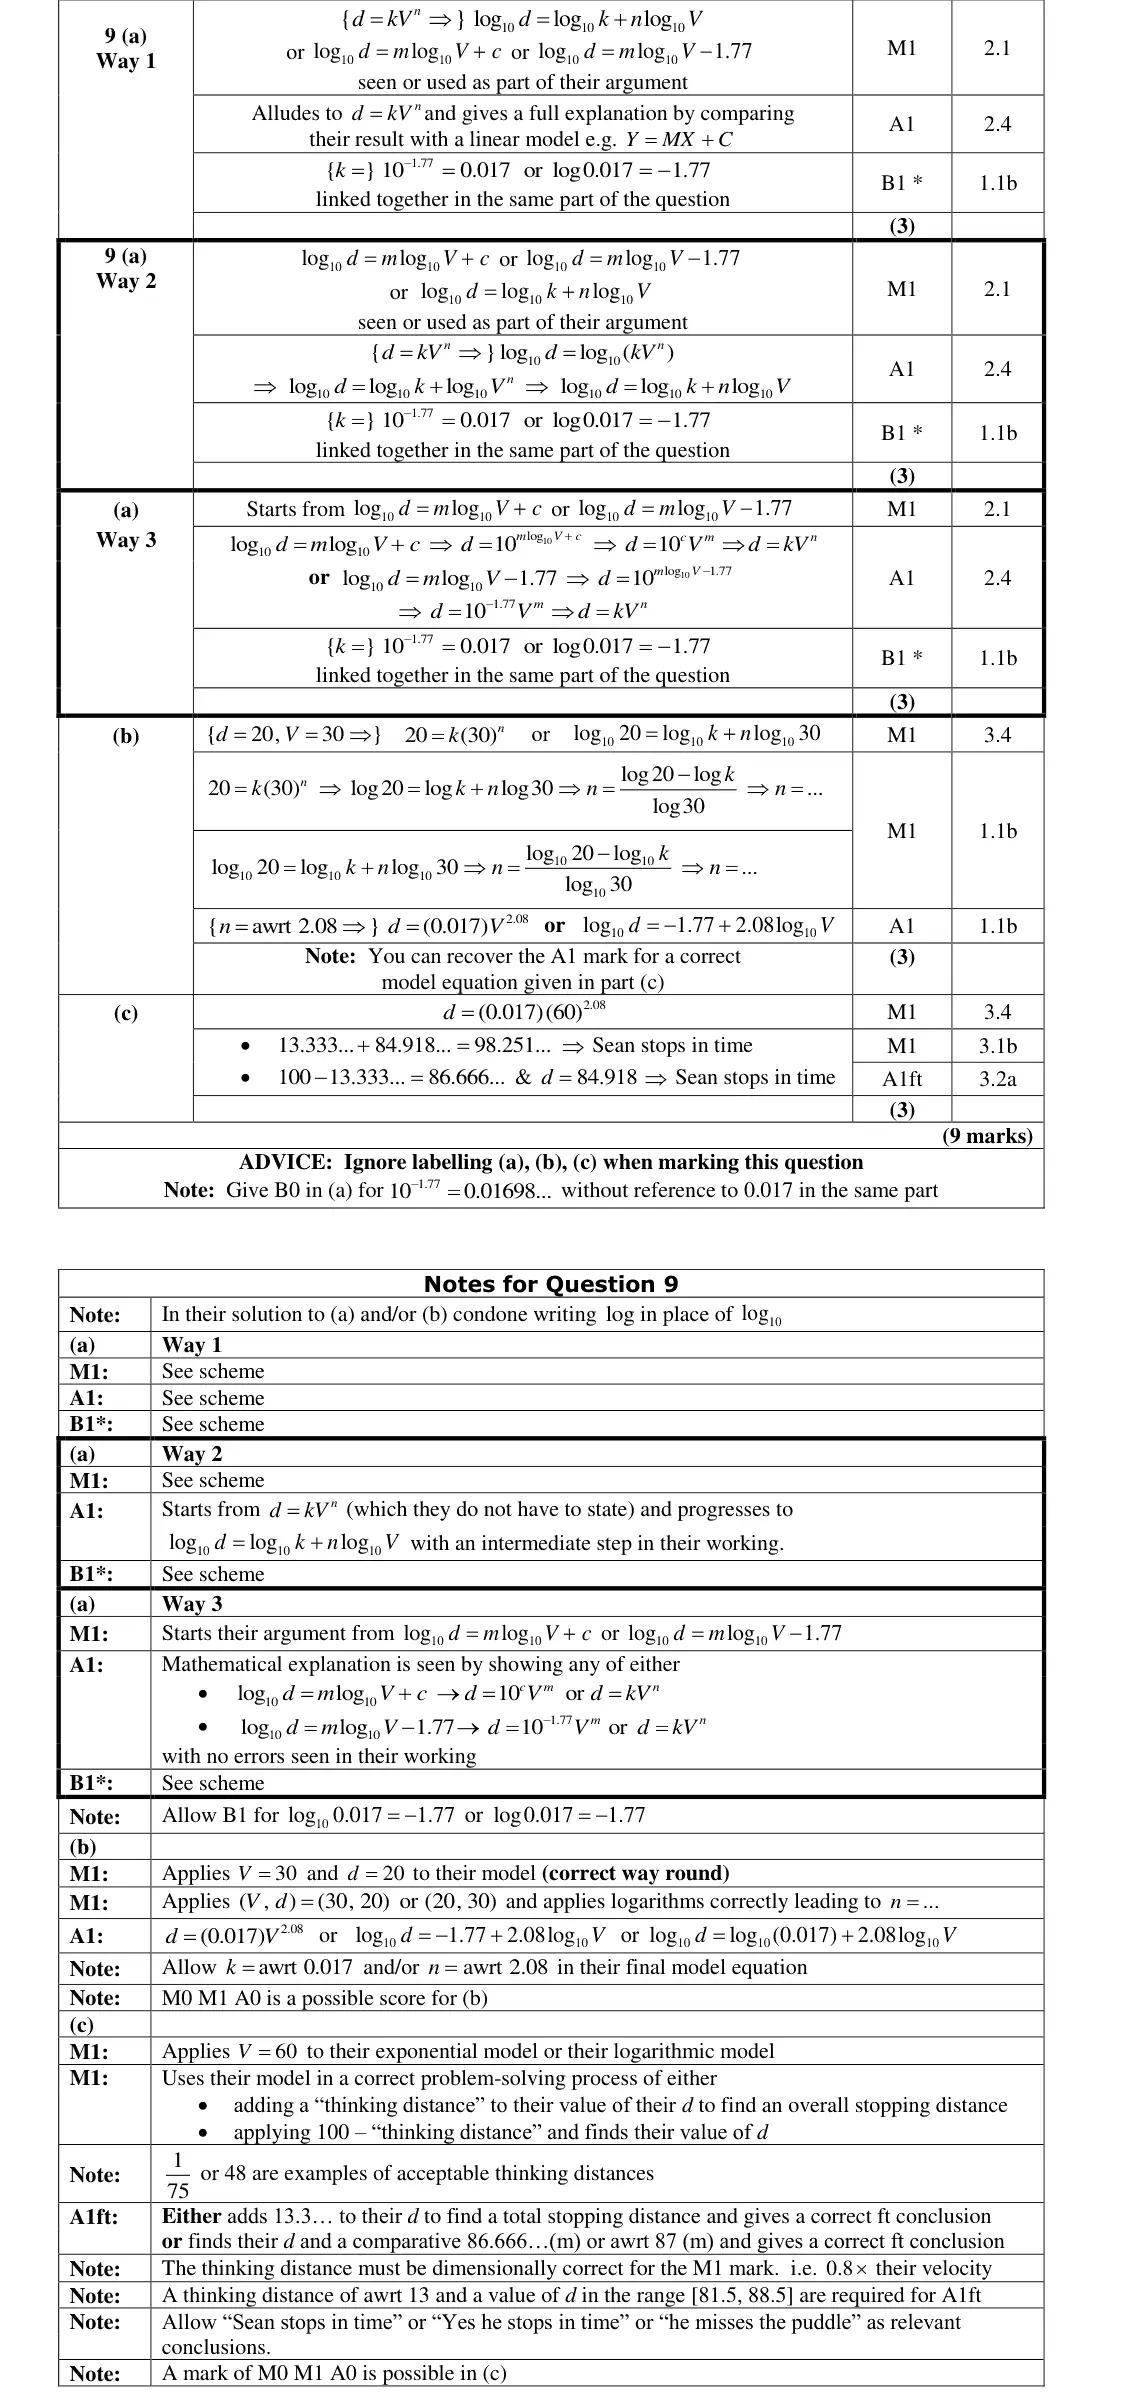
In general, Q09 discriminated well between candidates of all abilities. Q09(b) and Q09(c) were more accessible to candidates than Q09(a). Some candidates left Q09(a) blank while others struggled to make any creditable progress. In Q09(a), many candidates wrote down a valid log equation as part of their explanation. log log log d k n V Those who used mathematical reasoning to progress from 10 10 10 n d kV to (or vice versa) usually showed an intermediate step in their working and so were successful in their explanation. A few candidates made errors in progressing between these two equations, such as an incorrect method of combining logarithms (e.g. c n log log d n kV 10 ). d V ), or an incorrect use of powers (e.g. Those who 10 10 usually did so clearly made a direct comparison of their log equation with y mx c n log k in d kV enough but sometimes did not allude to (if using 1.77 rather than 10 10 1.77 their log equation). A significant number of candidates did not apply or use k logarithms to show that 0.017. V d n d kV In Q09(b), the majority of candidates substituted and into and 30 20 n 2.08. applied logarithms correctly, leading to the correct value of A few 0.017(30)n candidates used the incorrect method of simplifying 20 to give n 20 (0.51) . Some candidates substituted in V and d the wrong way around, usually n 2.50, leading to and a few used both V and d as 20. A small minority substituted V d and into a correct log equation, while a few others correctly found n by 30 20 (log 30, log 20). finding the gradient between the known points (0, 1.77) and 10 10 2.08 (0.017) d V The most common mistake was not writing a complete equation or n log 1.77 2.08log d V 2.08. after finding a correct 10 10 V In Q09(c), most candidates applied to their exponential model and found the 60 braking distance. Some then used the incorrect method of comparing this breaking distance with the overall stopping distance. The majority attempted to calculate the thinking distance and either added it to their breaking distance d or subtracted it from 100. The main error was due to the units. Some candidates did not attempt to convert 60 kmh to ms and simply multiplied 60 by the thinking time of 0.8 seconds to 1 1 obtain a thinking distance of 48 metres. Others only managed a partial conversion, with 1 some using 1 instead of 13.3m km 75 metres as their thinking distance. In 75 some of the answers, candidates used an incorrect method of combining their values to give a dimensionally incorrect quantity. For example, they might add their breaking distance to either a speed or a time. Candidates who obtained a thinking distance of 13.3m usually reached a correct answer and conclusion. A few compared the maximum speed needed to stop at the puddle with the given 60, while even fewer n 2.08; compared the maximum value of n needed to stop at the puddle with and with correct conclusions these were valid solutions.
Common mistakes
d(60) = 84.9 m
thinking distance 60 km/h = 16.7 m/s × 0.8 = 13.3 m (not 48 m – convert units)
98.3 < 100 so he stops in time
compare total stopping distance, not braking distance alone
June 2019 · Paper 2 · Q13(a)4 marks
Mark scheme (whole question; this part is marked with the orange bar)
Examiner's comment
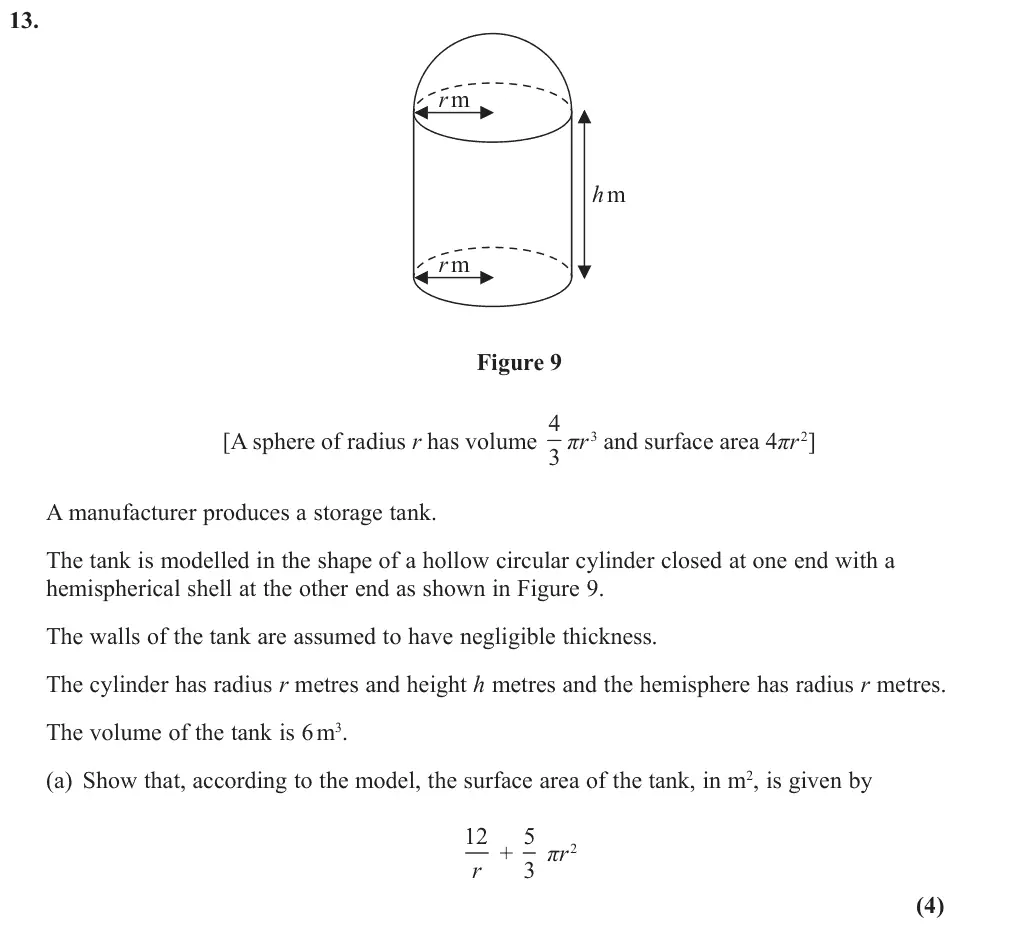
Q13 discriminated well between the medium and higher ability candidates. Lower ability candidates, however, struggled to gain any creditable progress. It was obvious that some candidates had been well prepared for this ‘optimisation’ question and the quality of their responses reflected this. candidates who attempted this question generally found Q13(b) and Q13(c) accessible but some struggled to complete the proof in Q13(a). In a few cases, candidates who scored zero marks in Q13(a) went on to achieve full marks in the remainder of Q13 by using the given result for the surface area. There were, however, many instances where candidates who struggled with Q13(a) then gave up and did not attempt the remainder of the question. In Q13(a), successful candidates followed a correct strategy of forming an equation for the volume of the tank, rearranging their equation to give an expression for h in terms of r and substituting their expression for h into their formula for the surface area of the tank. Some candidates did not halve the given sphere formulae so that they could use these for the hemispherical shell. This led to errors in both their volume equation and surface area expression. Other candidates did not include the area of the circular base in their surface area expression. These errors led to an incorrect volume equation 4 2 3 2 and incorrect surface area expressions and 6 r h r 5 2 A r rh 3 2 In other cases, bracketing errors, manipulation errors, or using 2 2 . A r rh incorrect formulae for the curved surface area of a cylinder, prevented candidates from achieving the given result. In Q13(b), many candidates who attempted this part applied a complete method to find their value of r for which d A r r 0. Most successful candidates found metres, 1.05 d 3 18 r with a few giving an exact answer metres, which was condoned. Some 5 candidates differentiated A incorrectly to give d 10 A 12ln , r r while others used d 3 r 12 10 0. r incorrect algebra when solving the correct equation A few 2 3 r 2 d A 0. candidates used the incorrect method of finding a value of r for which 2 d r In Q13(c), most candidates who attempted this part correctly substituted their value of r, found from solving d A 12 5 r 2 0, , A r into the model with equation with d 3 r 2 17m . A few candidates, who many obtaining a correct minimum surface area of 2 d A 0, made no creditable progress, substituted their value for r, found from solving 2 d r into the model for A.
Common mistakes
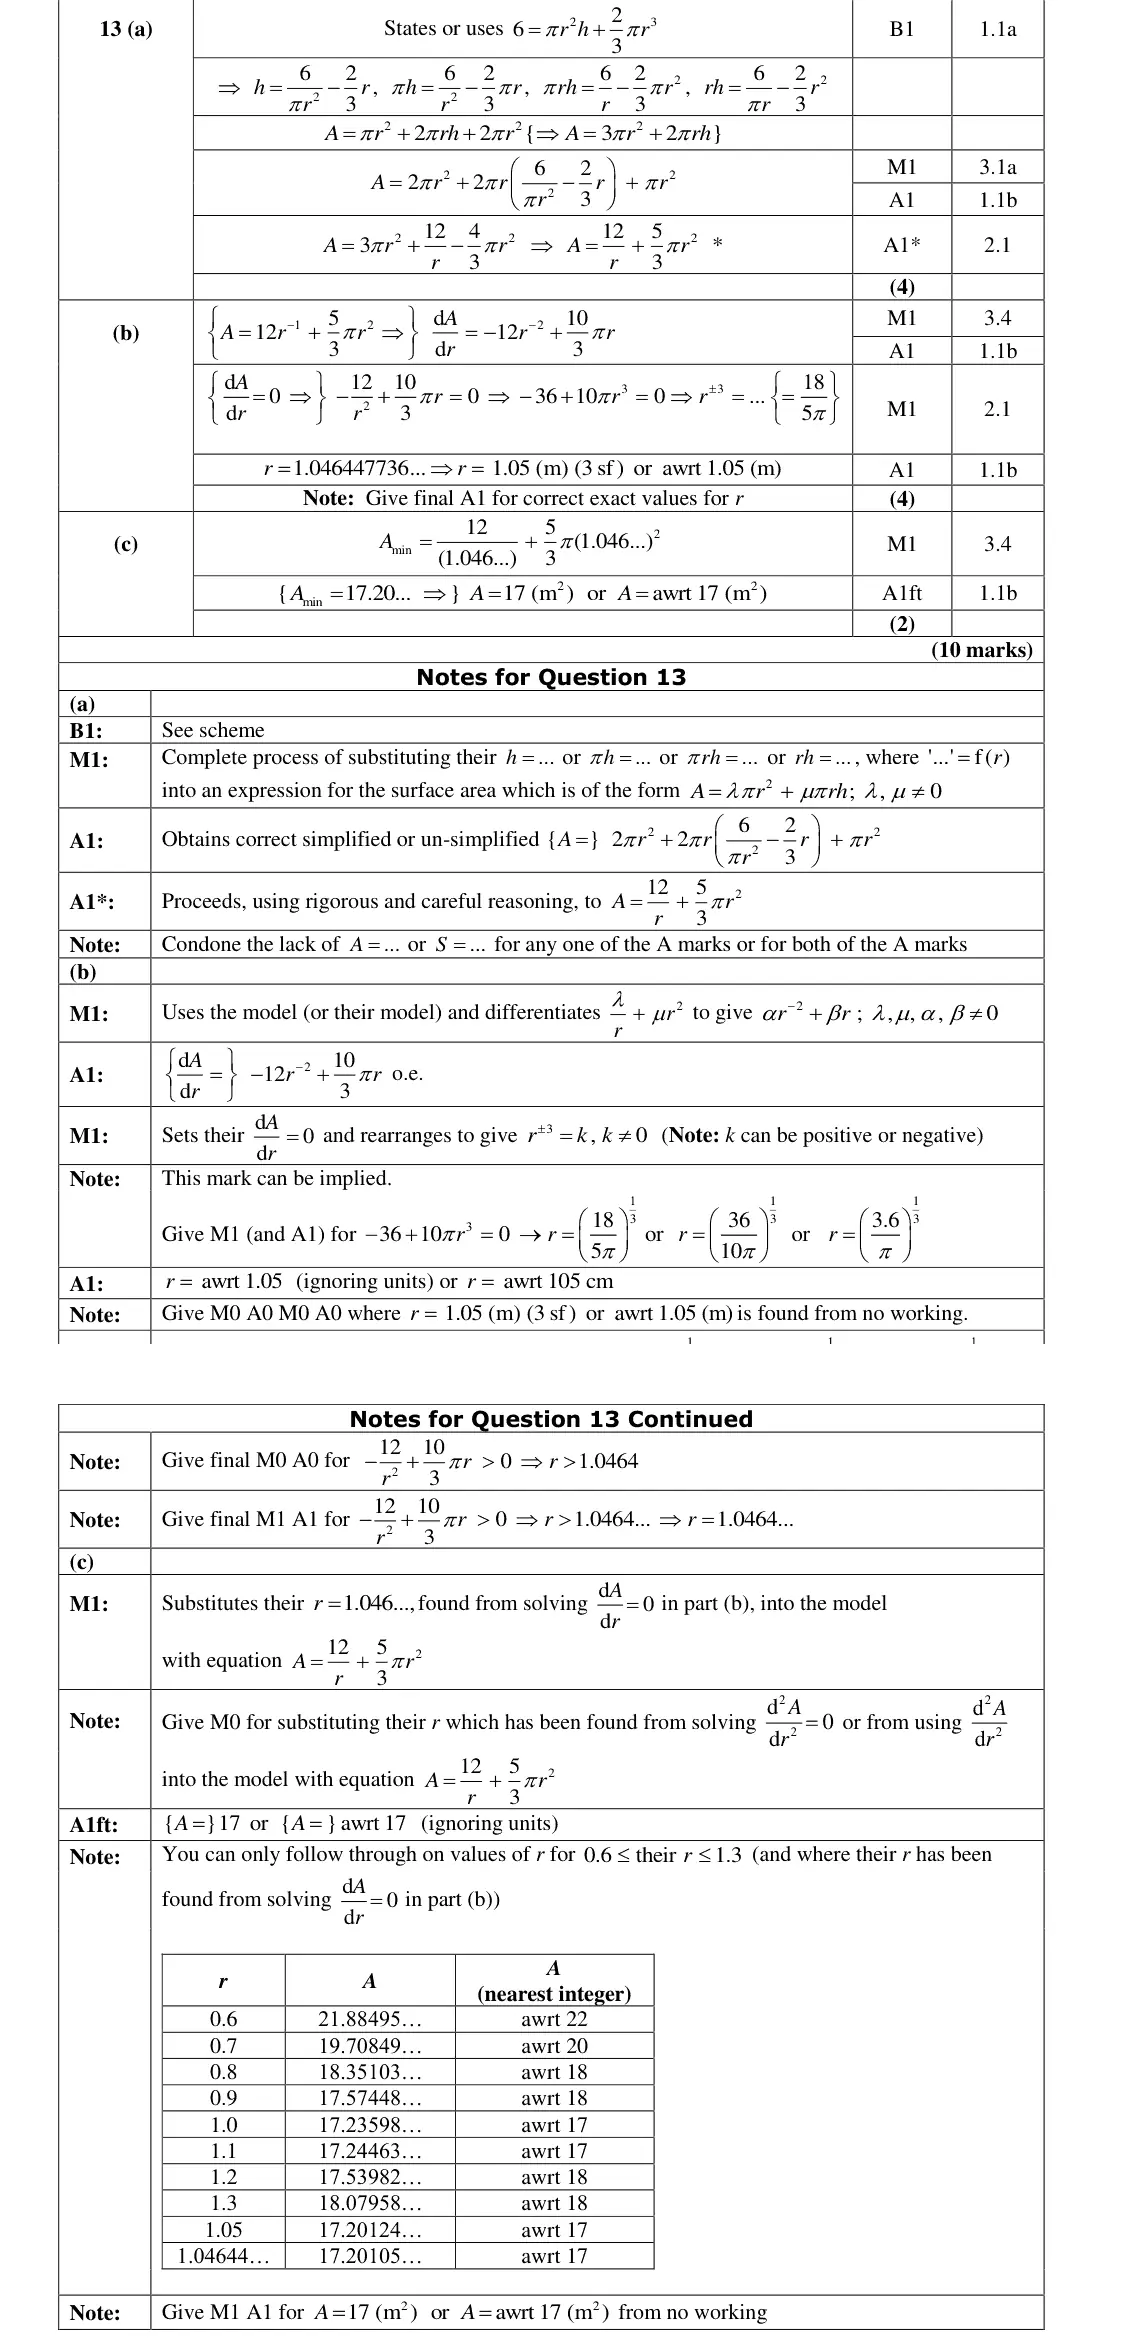
6 = πr²h + ⅔πr³ (halve the sphere formulae)
A = πr² + 2πrh + 2πr² (include the circular base)
substitute h to reach the given A
June 2019 · Paper 2 · Q13(c)2 marks
Mark scheme (whole question; this part is marked with the orange bar)
Examiner's comment
Q13 discriminated well between the medium and higher ability candidates. Lower ability candidates, however, struggled to gain any creditable progress. It was obvious that some candidates had been well prepared for this ‘optimisation’ question and the quality of their responses reflected this. candidates who attempted this question generally found Q13(b) and Q13(c) accessible but some struggled to complete the proof in Q13(a). In a few cases, candidates who scored zero marks in Q13(a) went on to achieve full marks in the remainder of Q13 by using the given result for the surface area. There were, however, many instances where candidates who struggled with Q13(a) then gave up and did not attempt the remainder of the question. In Q13(a), successful candidates followed a correct strategy of forming an equation for the volume of the tank, rearranging their equation to give an expression for h in terms of r and substituting their expression for h into their formula for the surface area of the tank. Some candidates did not halve the given sphere formulae so that they could use these for the hemispherical shell. This led to errors in both their volume equation and surface area expression. Other candidates did not include the area of the circular base in their surface area expression. These errors led to an incorrect volume equation 4 2 3 2 and incorrect surface area expressions and 6 r h r 5 2 A r rh 3 2 In other cases, bracketing errors, manipulation errors, or using 2 2 . A r rh incorrect formulae for the curved surface area of a cylinder, prevented candidates from achieving the given result. In Q13(b), many candidates who attempted this part applied a complete method to find their value of r for which d A r r 0. Most successful candidates found metres, 1.05 d 3 18 r with a few giving an exact answer metres, which was condoned. Some 5 candidates differentiated A incorrectly to give d 10 A 12ln , r r while others used d 3 r 12 10 0. r incorrect algebra when solving the correct equation A few 2 3 r 2 d A 0. candidates used the incorrect method of finding a value of r for which 2 d r In Q13(c), most candidates who attempted this part correctly substituted their value of r, found from solving d A 12 5 r 2 0, , A r into the model with equation with d 3 r 2 17m . A few candidates, who many obtaining a correct minimum surface area of 2 d A 0, made no creditable progress, substituted their value for r, found from solving 2 d r into the model for A.
Common mistakes
substitute r = 1.046 (from dA/dr = 0) into A: 17 m² to nearest integer
June 2018 · AS Paper 1 · Q6(a)2 marks
Mark scheme (whole question; this part is marked with the orange bar)
Examiner's comment
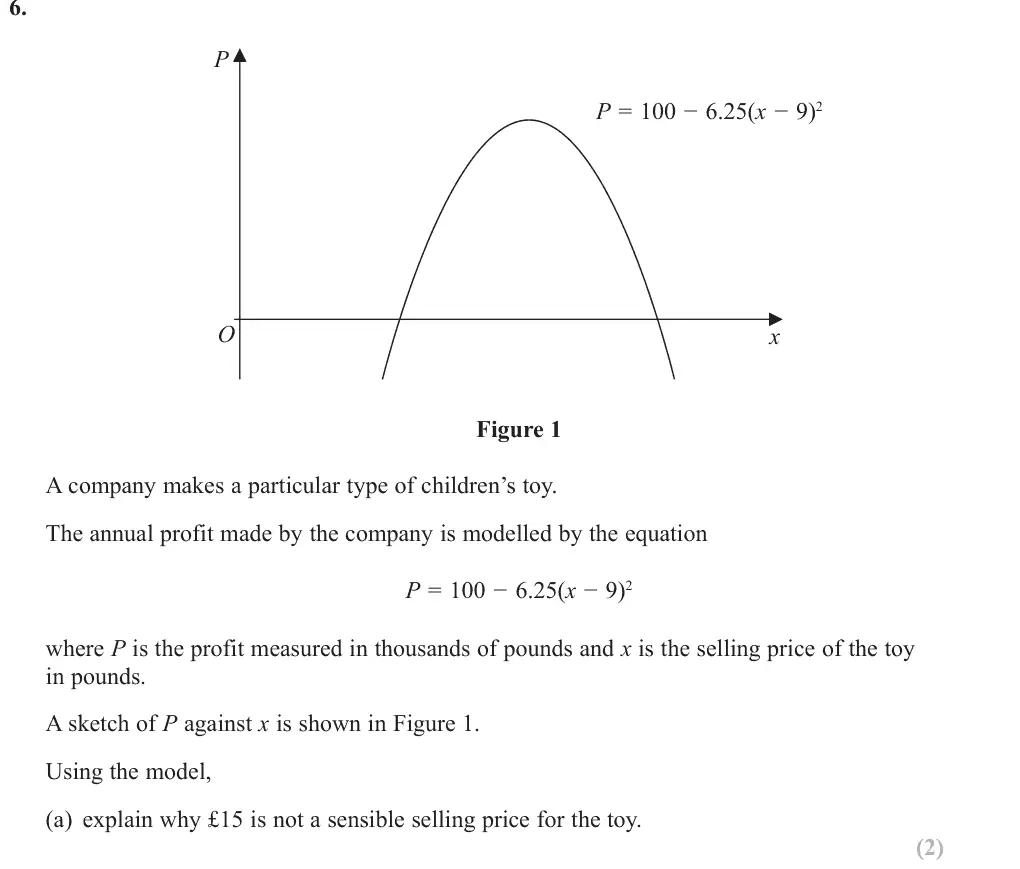
Success on this question was partially determined by students realising that P was measured in thousands of pounds. Additionally, students should be aware that units are necessary in modelling questions and in particular the answer to (c)(i) is £100 000 and not 100, £100 or 100 000 as commonly seen. (a) Most students gained at least one mark on this part. The easiest method is to substitute x =15 into the given equation and explain that it isn’t a sensible selling price as the company would be making a loss of £125 000. The most common errors in this part were: (1) substituting in P = 0 and finding x, (2) stating that the company would not make any money or “may/could” make a loss.
Common mistakes
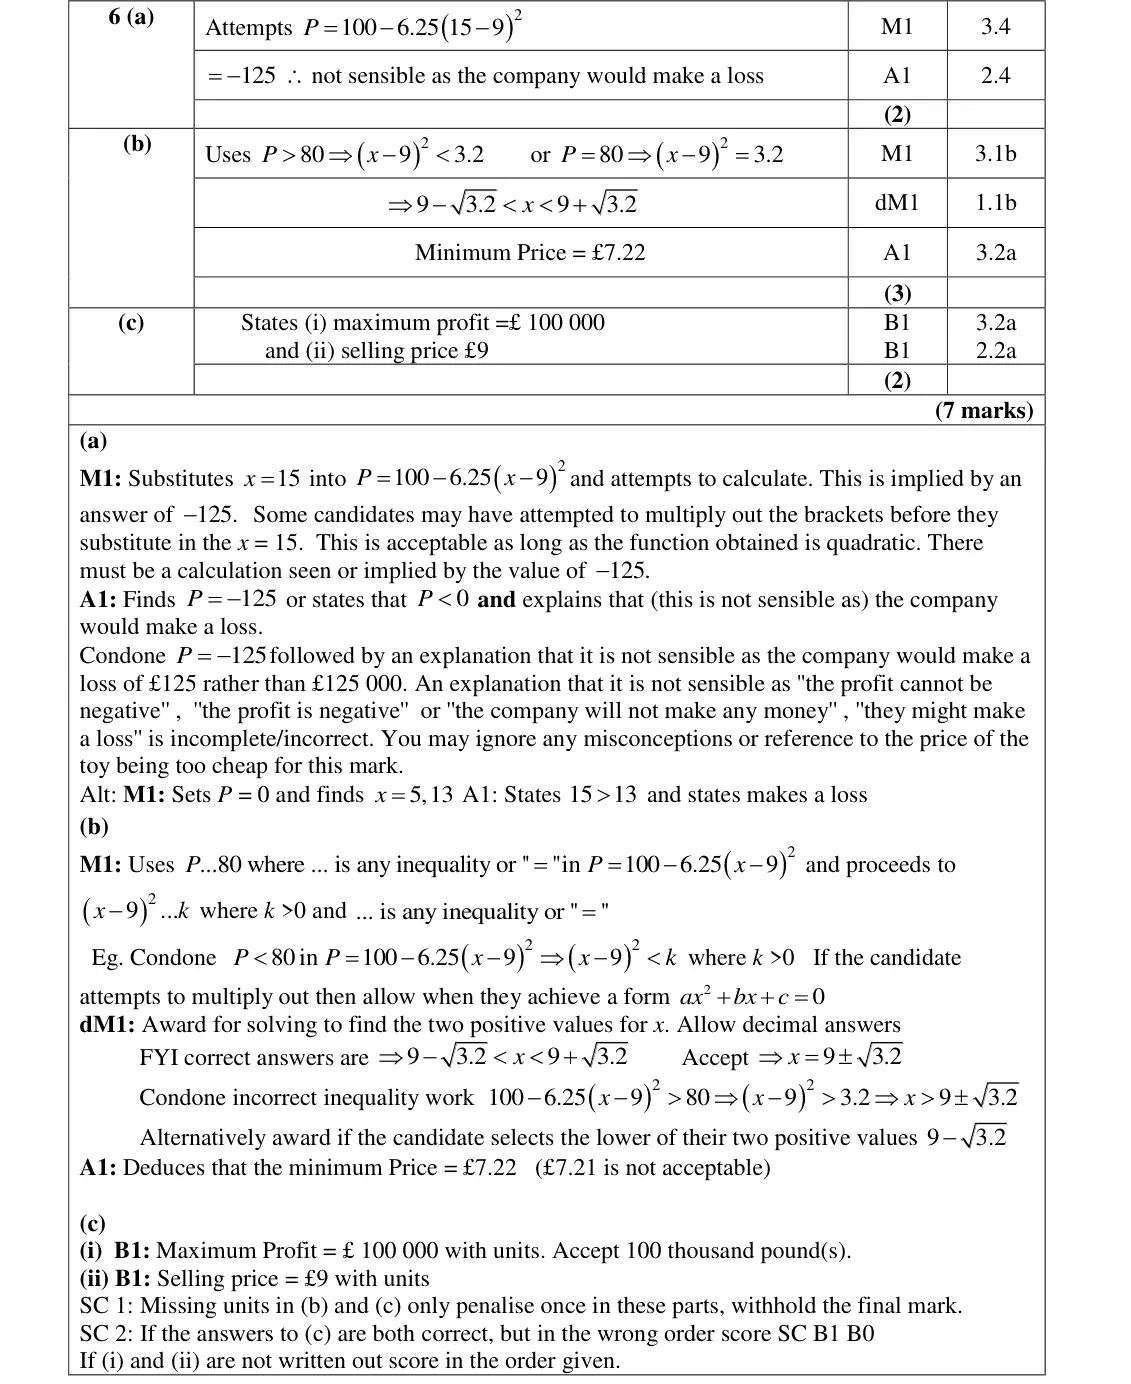
substitute x = 15: P = −125, i.e. a loss of £125 000
must say it would make a loss (not "may" make a loss)
setting P = 0 is the wrong approach
June 2018 · AS Paper 1 · Q6(b)3 marks
Mark scheme (whole question; this part is marked with the orange bar)
Examiner's comment
Success on this question was partially determined by students realising that P was measured in thousands of pounds. Additionally, students should be aware that units are necessary in modelling questions and in particular the answer to (c)(i) is £100 000 and not 100, £100 or 100 000 as commonly seen. (b) Many students attempted this part. The most common error was to use 80,000 rather than 80. This error resulted in a score of 000. Students who did use 80 usually attempted to solve the quadratic, but many by expanding and factorising rather than by using the form given. Some students only found one solution, rather than the two required. Very few students gained the final accuracy mark, with most students incorrectly stating £7.21 as the final value, not taking into account the need to round up. A small number of students used a trial and improvement method, which was often more successful in achieving the correct answer. Others used their graphical calculators to gain the correct answer with limited working.
Common mistakes
P is in thousands, so use P > 80 not 80 000
(x − 9)² < 3.2 gives 9 − √3.2 < x < 9 + √3.2 (use the completed-square form rather than expanding)
round up to £7.22 (£7.21 is not acceptable)
find both values
June 2018 · AS Paper 1 · Q6(c)2 marks
Mark scheme (whole question; this part is marked with the orange bar)
Examiner's comment
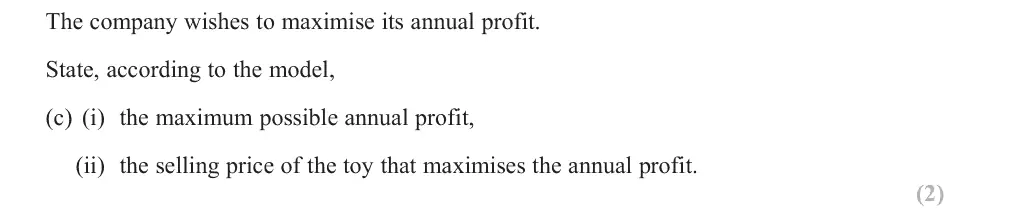
Success on this question was partially determined by students realising that P was measured in thousands of pounds. Additionally, students should be aware that units are necessary in modelling questions and in particular the answer to (c)(i) is £100 000 and not 100, £100 or 100 000 as commonly seen. (c) Most students attempted this part but were unable to use the given equation to just state the answers. Some students used differentiation to find the maximum. Common errors were omitting units, giving the answers in the wrong order (with no labelling) and giving the answer for the maximum profit as £100 instead of £100,000.
Common mistakes
read from the completed-square form: maximum profit £100 000 (with units
not 100 or £100) at a selling price of £9
differentiation is unnecessary
label (i) and (ii)
June 2018 · AS Paper 1 · Q8(c)1 mark
Mark scheme (whole question; this part is marked with the orange bar)
Examiner's comment
This proved to be a challenge and a large number of students did not recognise that it was a differentiation problem until asked to find the second derivative in (b). Part (c) was sometimes the only mark collected in this question by less able students. Some simply re- stated the model’s assumption of a constant speed without reference to this not being possible. Others gave vague or irrelevant statements such as “there might be different routes”.
Common mistakes
the lorry could not travel at a constant speed over the whole journey (traffic, stops)
just restating the constant-speed assumption, or vague comments such as different routes, score 0
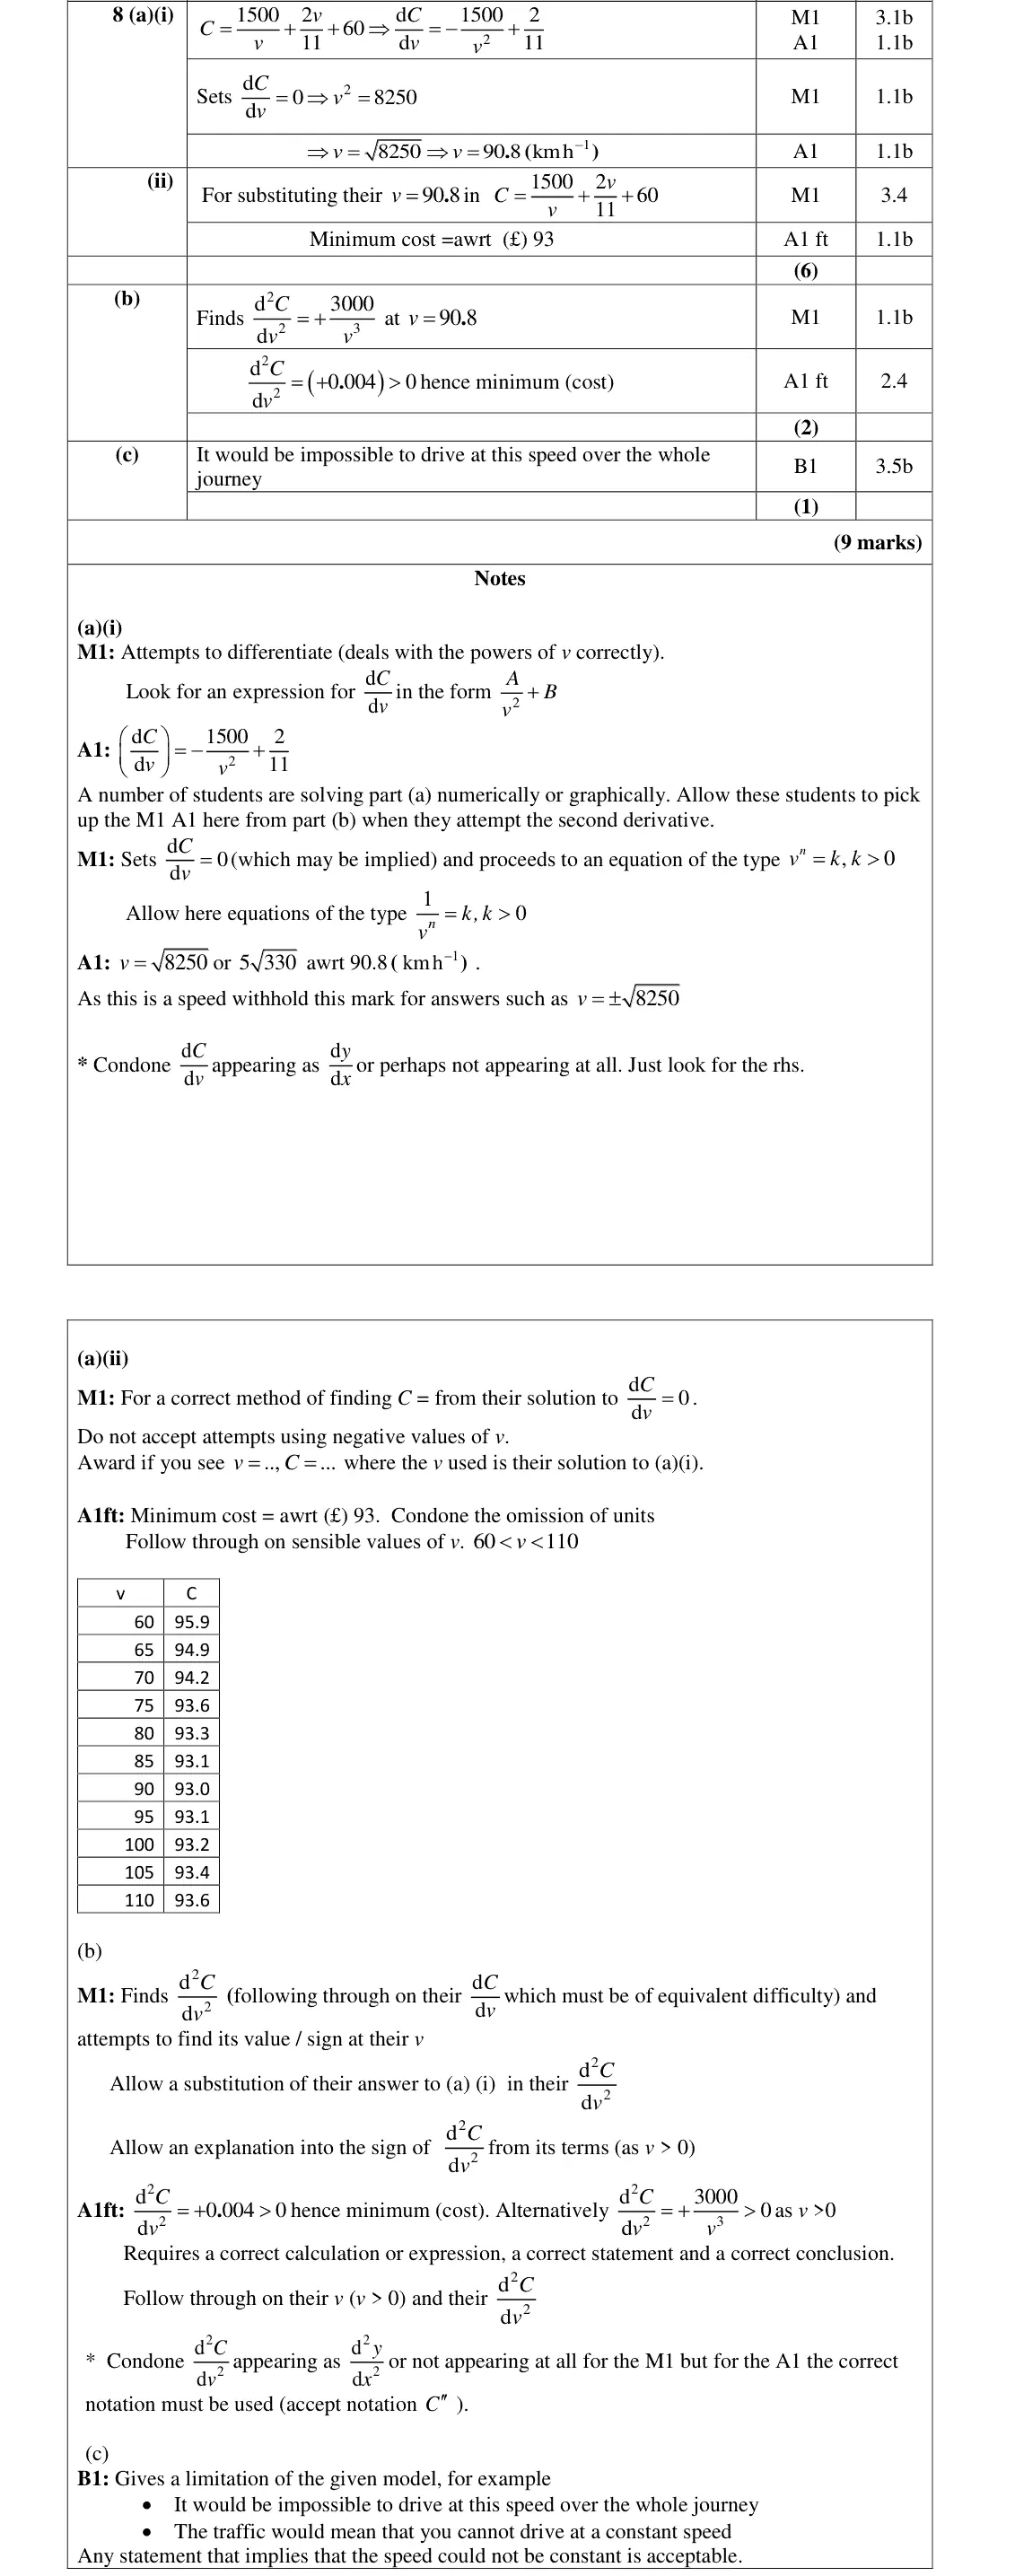
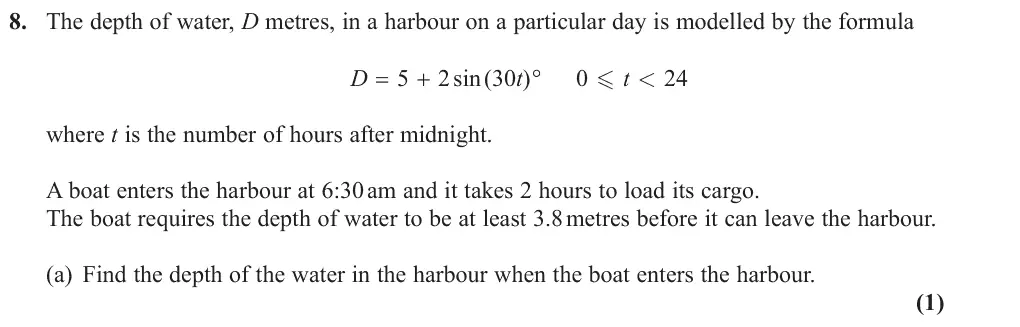
June 2018 · Paper 1 · Q8(a)1 mark
Mark scheme (whole question; this part is marked with the orange bar)
Examiner's comment
This question involved modelling the depth of water in a harbour using a trigonometric function. The mark in part (a) was usually scored, although some students did forget to include the units for the answer of 4.48 metres. Other errors seen were as a result of t 0 substituting incorrect values of t , usually , into the equation for D or prematurely rounding their answer to 4.5 metres. Most students also started part (b) correctly and were able to proceed to the intermediate
Common mistakes
t = 6.5 (not t = 0), calculator in degrees
4.48 m with units, not rounded to 4.5
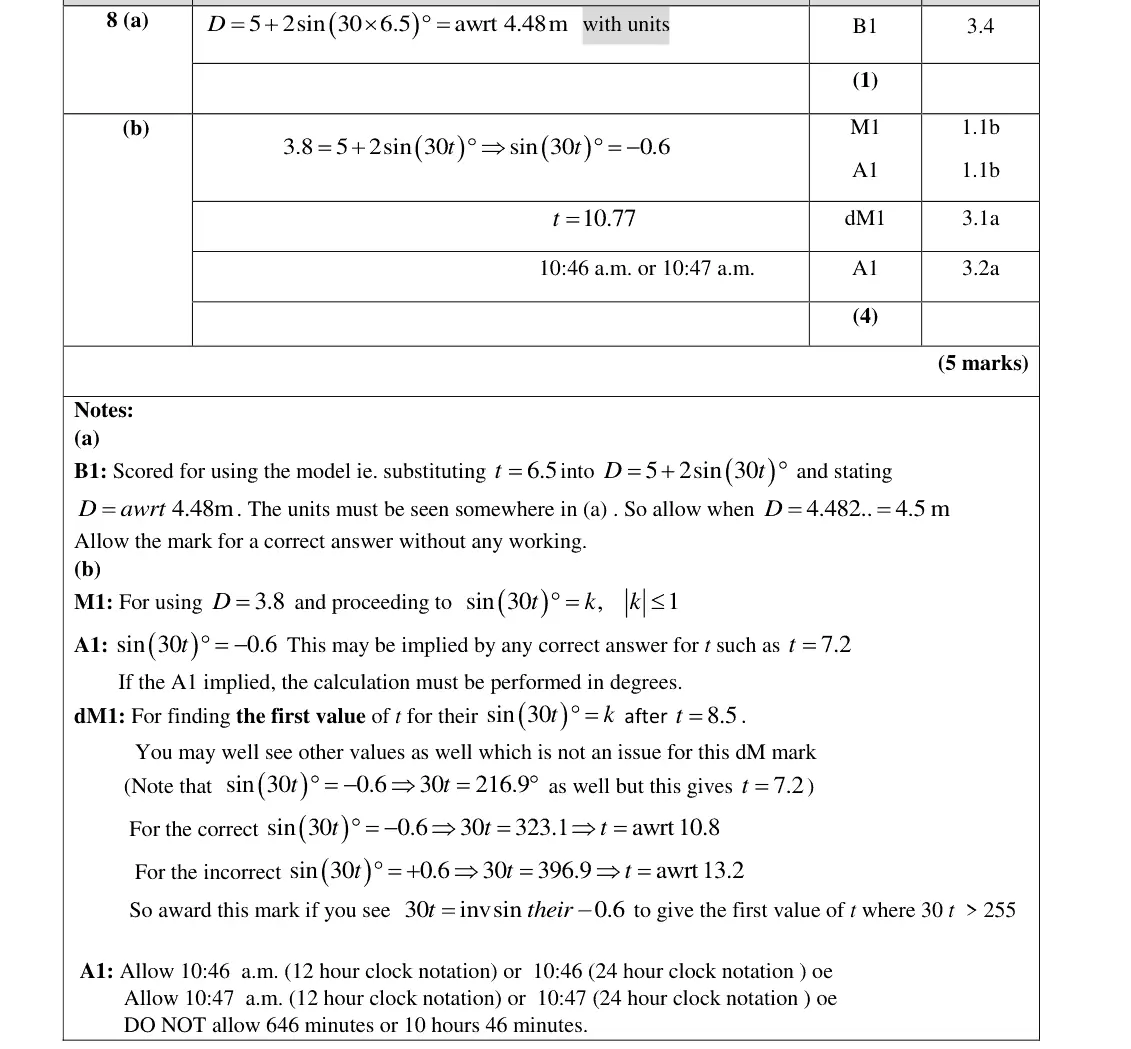
June 2018 · Paper 1 · Q8(b)4 marks
Mark scheme (whole question; this part is marked with the orange bar)
Examiner's comment
This question involved modelling the depth of water in a harbour using a trigonometric Most students also started part (b) correctly and were able to proceed to the intermediate t point of sin30 0.6 without much difficulty. The final part of the question, however, proved to be much more difficult, with many students not finding a value of t greater than 8.5, giving 𝑡= 7.2 then a time of 7: 14𝑎𝑚. Of those who correctly found 𝑡= 10.77 a large number failed to give their final answer as a time, with 10 hours and 46 minutes being common. A number of successful students were noteworthy in terms of the clear presentation and communication of their solutions, often producing sketch graphs of the sine curve to aid their understanding.
Common mistakes
sin(30t)° = −0.6
need the first t after 8.5 (loading ends 8:30): 30t = 323.1 so t = 10.77, not 7.2 (7:14 am)
answer as a time 10:46 am, not 10 hours 46 minutes
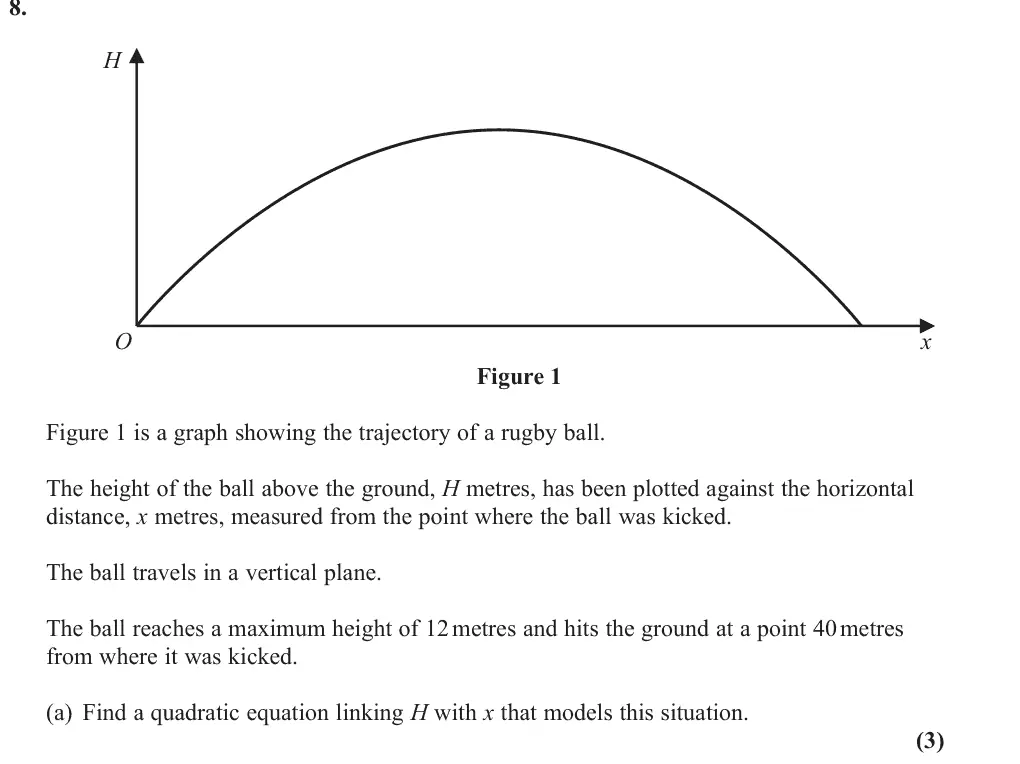
June 2018 · Paper 2 · Q8(a)3 marks
Mark scheme (whole question; this part is marked with the orange bar)
Examiner's comment
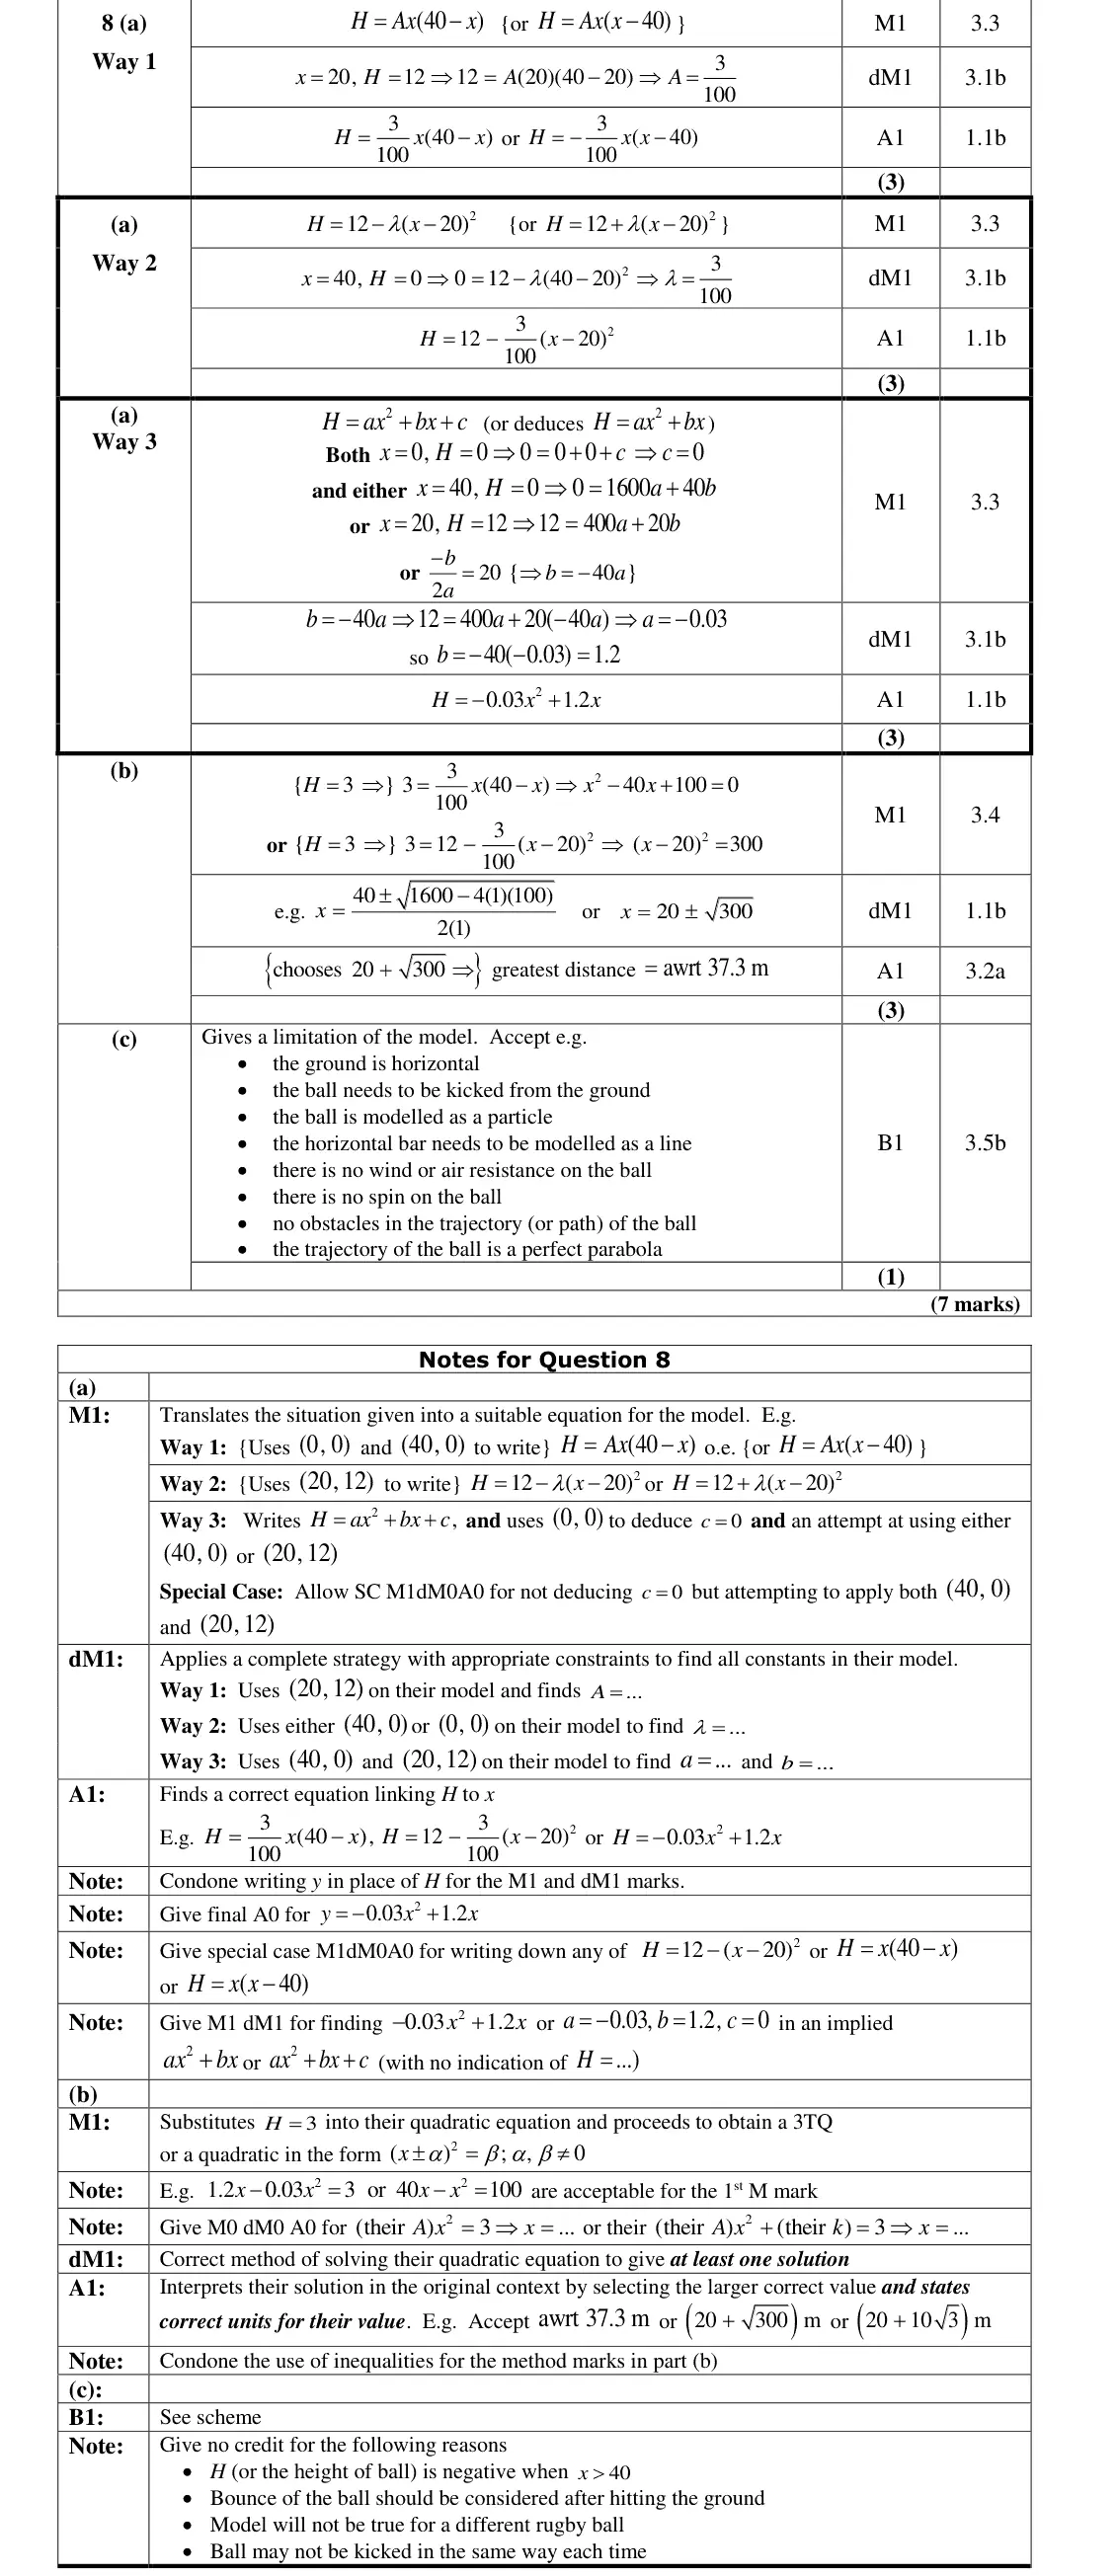
This question discriminated well between the average and more able students. There was a significant minority of students, however, that made no creditable progress. In part (a), a minority of students struggled to write down a suitable form of the quadratic model. Some students, who tried to model the height of the rugby ball as a negative quadratic cutting the x-axis at 0 x and 40, x wrote down either ( 40) H x x or (40 ), H x x but struggled, due to the lack of a constant, to fit the condition (20, 12) to their model. Those who wrote (40 ) H Ax x usually applied (20, 12) to their model to give the correct 3 (40 ). 100 H x x Other students who adopted a model of the form 2 H ax bx c were usually successful in using the conditions (0, 0), (40, 0) and (20, 12) to give the correct 2 0.03 1.2 . H x x Only a few students used the model 2 12 ( 20) H x with condition (40, 0) to find a correct 2 3 12 ( 20) . 100 H x A few other elaborate methods were seen, including one where (40, 0) and , 12 2 b a were applied to 2 , H ax bx which usually resulted in a correct 2 0.03 1.2 . H x x
Common mistakes
H = Ax(40 − x) needs a constant A (fit (20, 12) to get A = 3/100)
or H = 12 − λ(x − 20)², or H = −0.03x² + 1.2x
June 2018 · Paper 2 · Q8(b)3 marks
Mark scheme (whole question; this part is marked with the orange bar)
Examiner's comment
This question discriminated well between the average and more able students. There was a significant minority of students, however, that made no creditable progress. In part (b), many students substituted 3 H into their quadratic model and most applied a correct method for solving their resulting 3-term quadratic equation or their quadratic equation of the form 2 ( 20) , 0. x k k Many students found the largest solution in the range (0, 40) and gave their answer, usually to 3 significant figures, in metres.
Common mistakes
set H = 3: x² − 40x + 100 = 0 or (x − 20)² = 300
choose the larger root 20 + √300 = 37.3 m
June 2018 · Paper 2 · Q8(c)1 mark
Mark scheme (whole question; this part is marked with the orange bar)
Examiner's comment
This question discriminated well between the average and more able students. There was a significant minority of students, however, that made no creditable progress. Students gave a variety of acceptable limitations for the model in part (c) with many stating that ‘the model assumes that there is no wind or air resistance acting on the ball’. No credit was given for answers that discussed what might have happened to the rugby ball after it had hit the ground.
Common mistakes
e.g. no wind or air resistance, ball modelled as a particle, ground horizontal
comments on what happens after the ball lands score nothing
Find an Edexcel maths tutor
Stuck on this? Book a trial session with an Edexcel specialist.