June 2025: Paper 3 Section A: Statistics

50 marks · 21 question parts · Question paper, mark scheme and examiner's report on Pearson's site

Question by question

QTopicMarksDifficulty
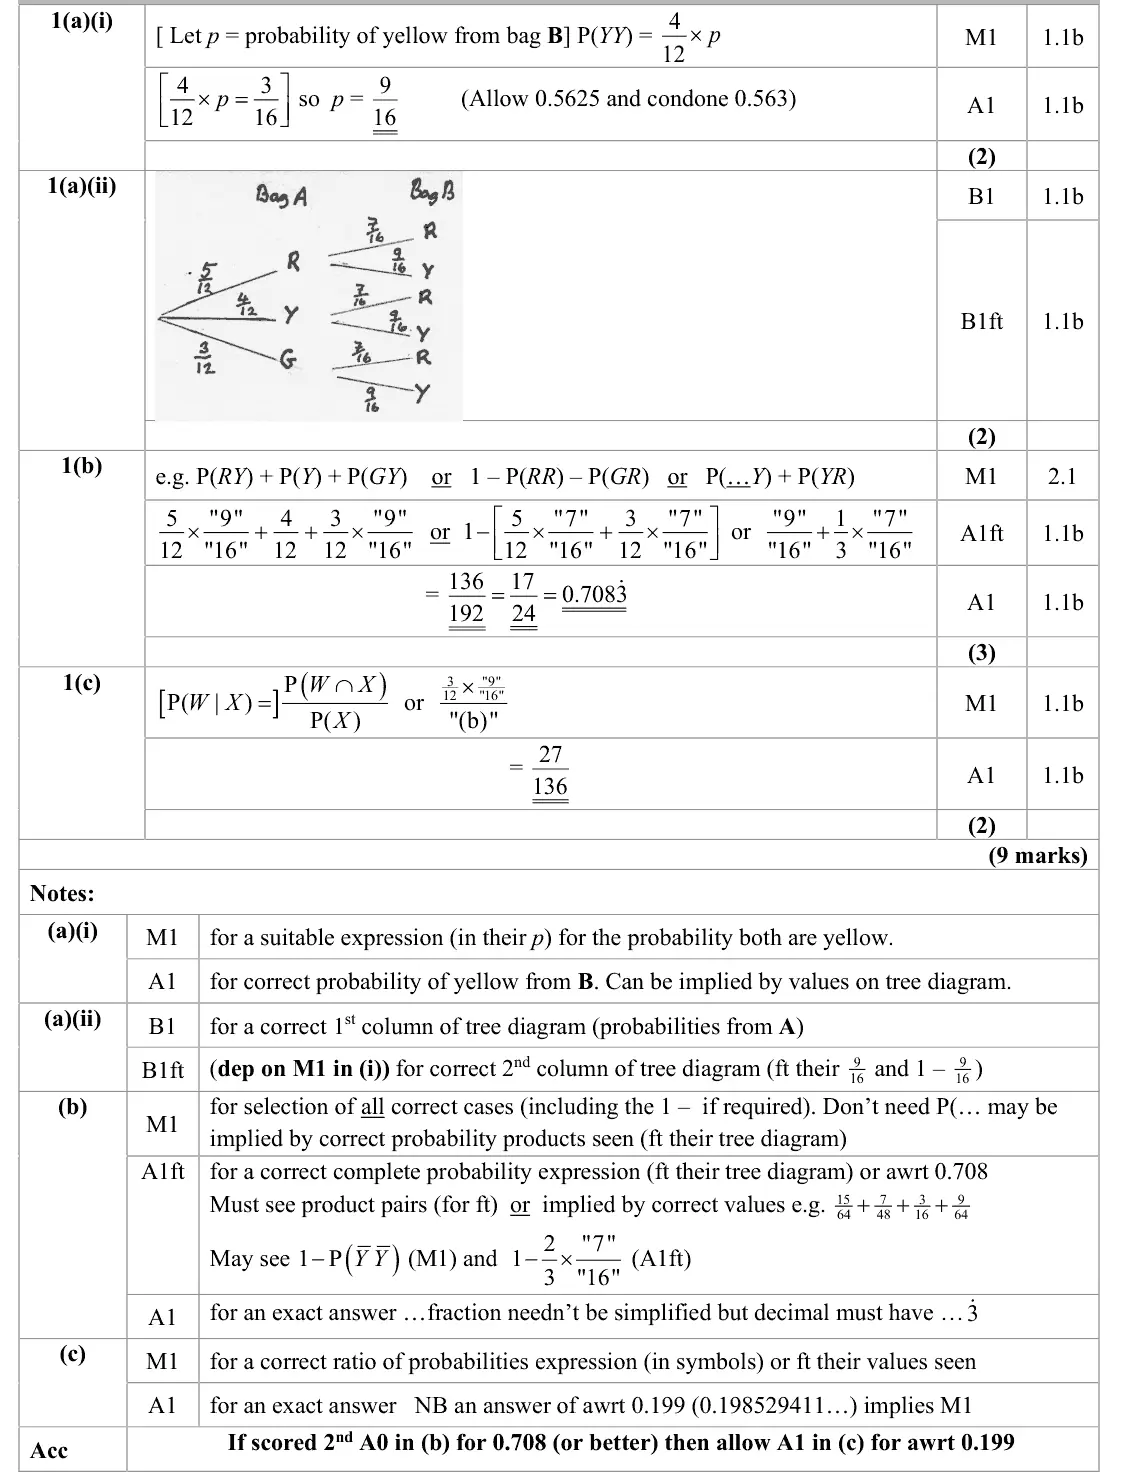
1(a)(i) Probability, including conditional probability 2 —
1(a)(ii) Probability, including conditional probability 2 —
1(b) Probability, including conditional probability 3 —
1(c) Probability, including conditional probability 2 —
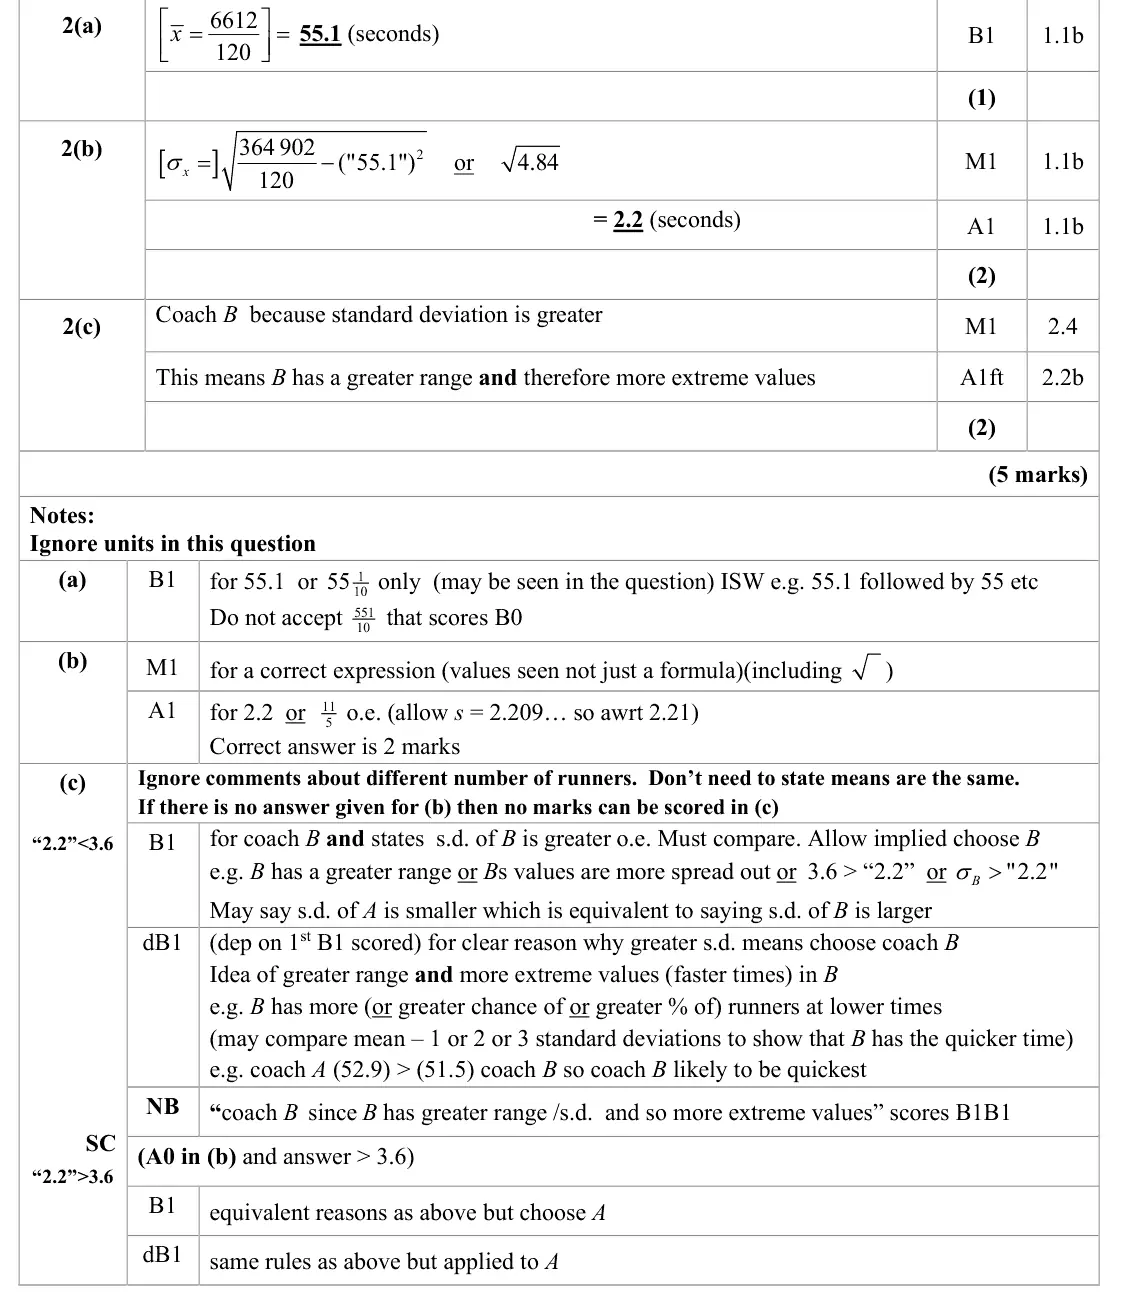
2(a) Data presentation: histograms, box plots, measures and outliers 1 —
2(b) Data presentation: histograms, box plots, measures and outliers 2 —
2(c) Data presentation: histograms, box plots, measures and outliers 2 —
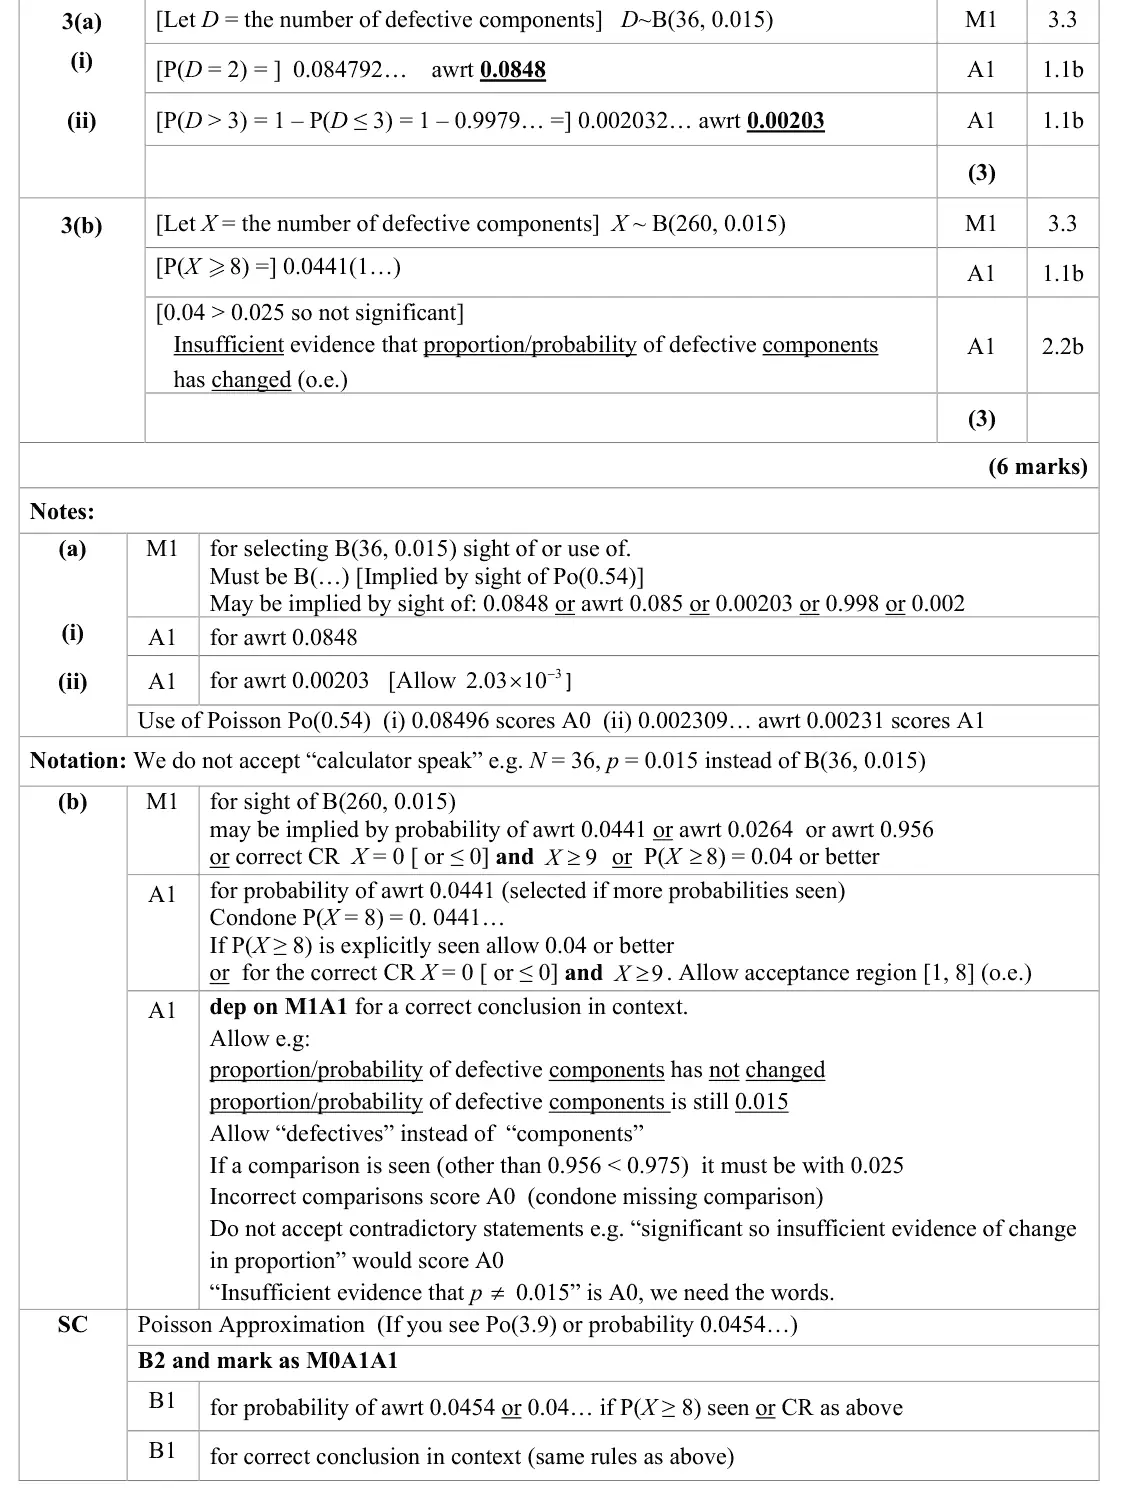
3(a) Discrete distributions and the binomial distribution 3 —
3(b) Hypothesis testing, Discrete distributions and the binomial distribution 3 —
4(a) Sampling 1 —
4(b) Data presentation: histograms, box plots, measures and outliers, The large data set 1 —
4(c) Correlation and regression, The large data set 2 —
4(d) Correlation and regression 1 —
4(e) Hypothesis testing, Correlation and regression 2 —
4(f) Sampling, The large data set 2 —
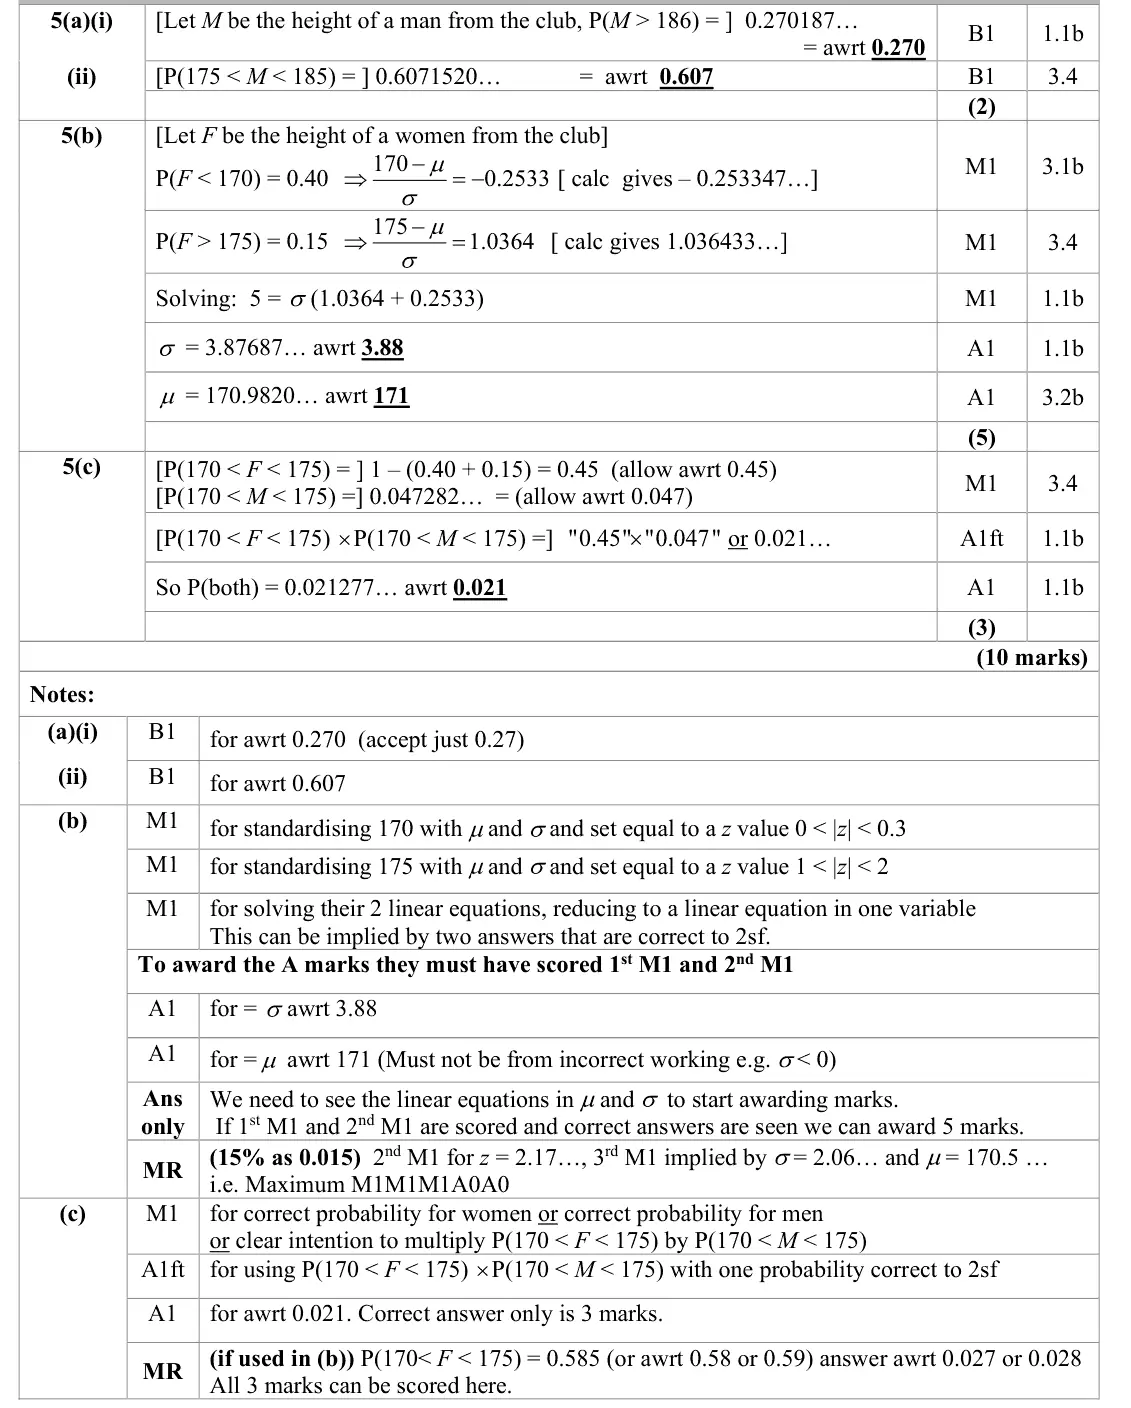
5(a) Normal distribution 2 —
5(b) Normal distribution, Simultaneous equations 5 —
5(c) Normal distribution, Probability, including conditional probability 3 —
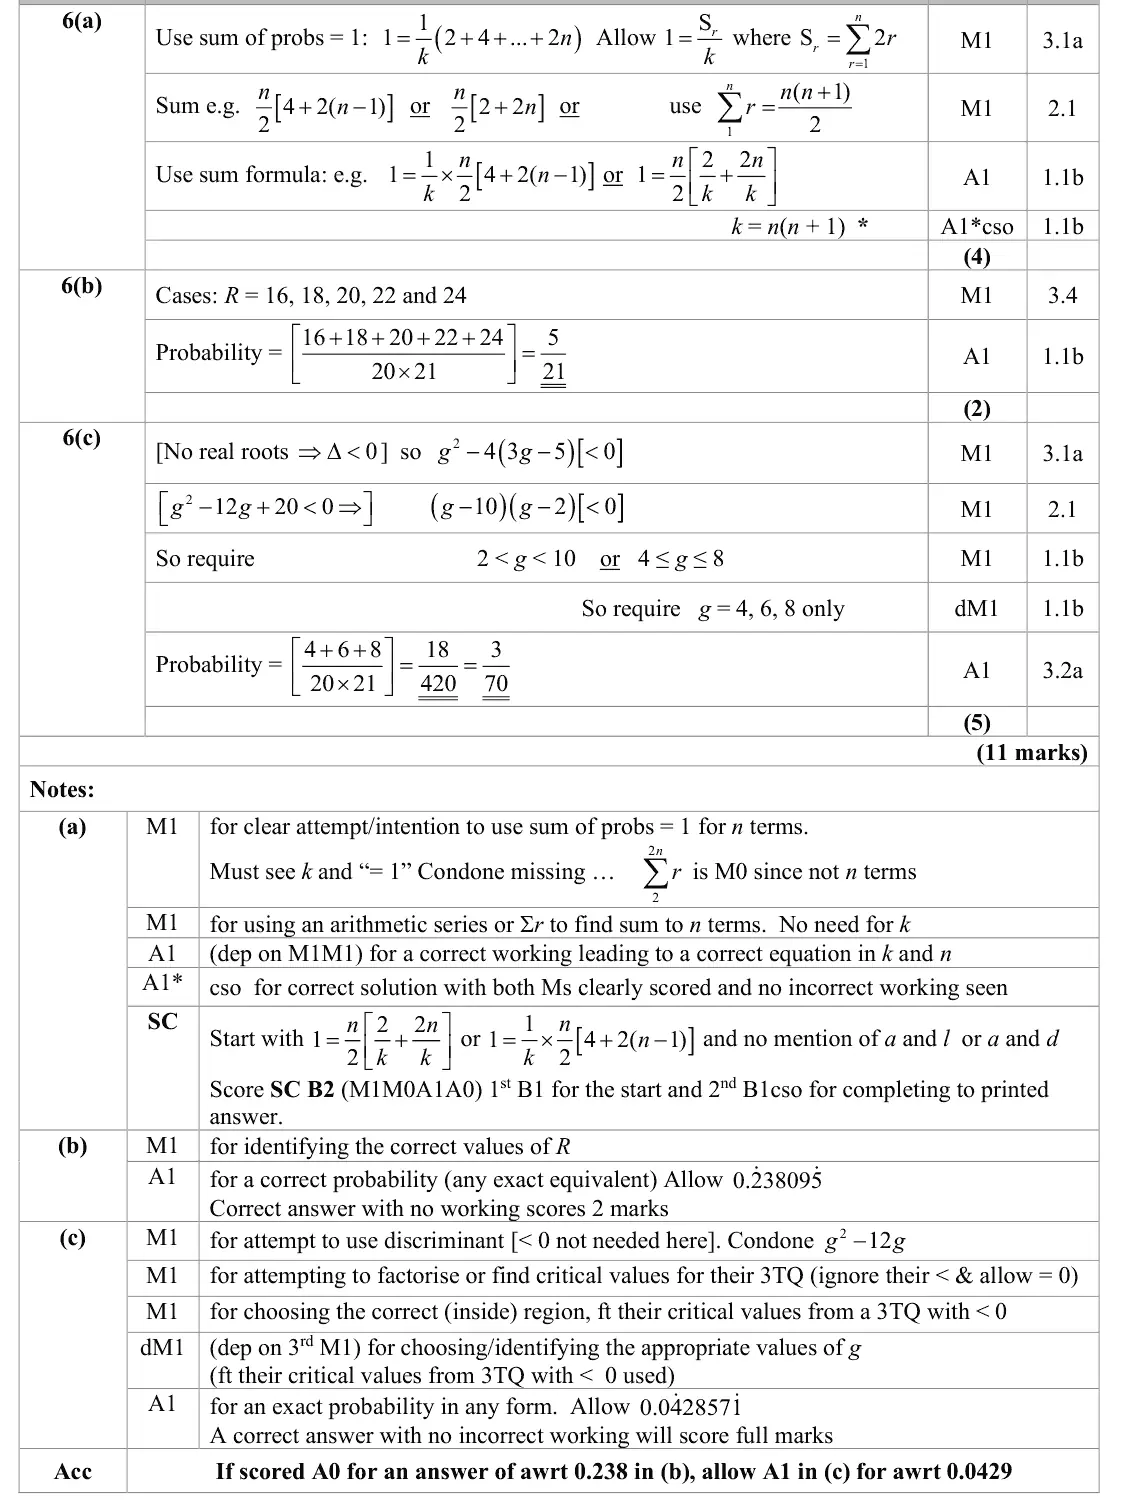
6(a) Discrete distributions and the binomial distribution, Sequences and series 4 —
6(b) Discrete distributions and the binomial distribution 2 —
6(c) Discrete distributions and the binomial distribution, Quadratics and the discriminant, Inequalities 5 —

The questions

1(a)(i)1(a)(ii)1(b)1(c)2(a)2(b)2(c)3(a)3(b)4(a)4(b)4(c)4(d)4(e)4(f)5(a)5(b)5(c)6(a)6(b)6(c)
June 2025 · Paper 3 (Statistics) · Q1(a)(i) 2 marks probability
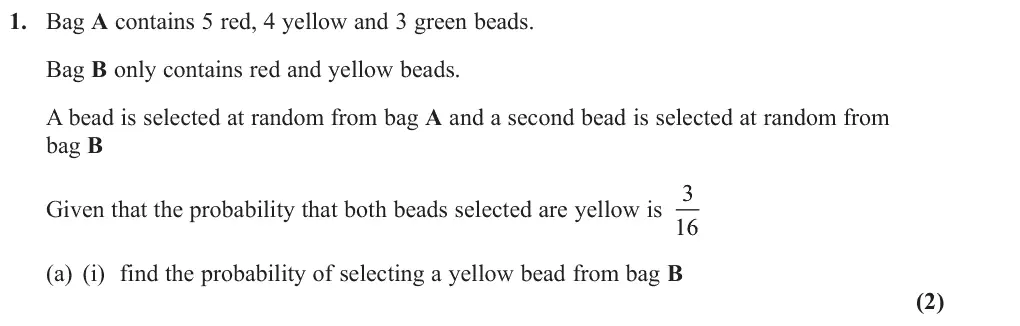
1. Bag A contains 5 red, 4 yellow and 3 green beads. Bag B only contains red and yellow beads. A bead is selected at random from bag A and a second bead is selected at random from bag B Given that the probability that both beads selected are yellow is 3 (a) (i) find the probability of selecting a yellow bead from bag B (2)
June 2025 · Paper 3 (Statistics) · Q1(a)(ii) 2 marks probability
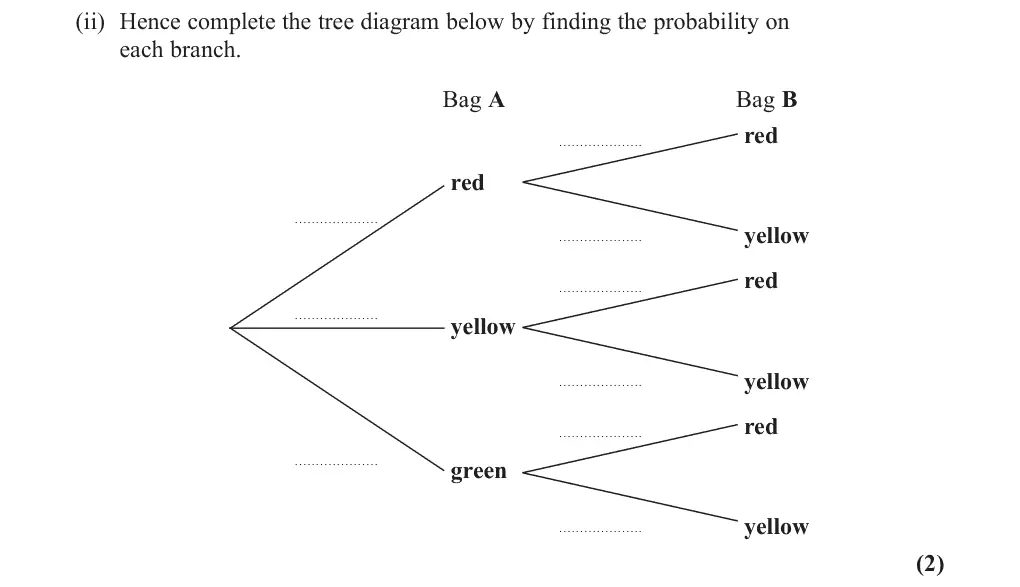
(ii) Hence complete the tree diagram below by finding the probability on each branch. Bag A Bag B red red yellow red yellow yellow red green yellow (2)
June 2025 · Paper 3 (Statistics) · Q1(b) 3 marks probability
(b) Find the exact probability that at least one of the two beads selected is yellow. (3)
June 2025 · Paper 3 (Statistics) · Q1(c) 2 marks probability
The event X is that at least one of the beads selected is yellow. The event W is that a green bead is selected. (c) Find the exact value of P(W | X ) (2)
June 2025 · Paper 3 (Statistics) · Q2(a) 1 mark data presentation
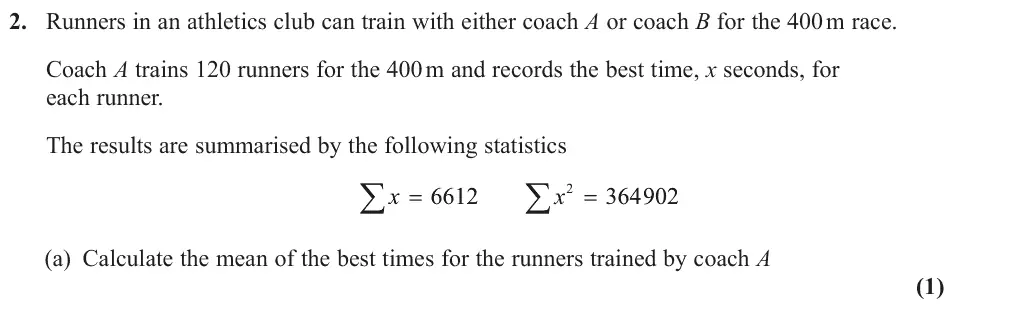
2. Runners in an athletics club can train with either coach A or coach B for the 400 m race. Coach A trains 120 runners for the 400 m and records the best time, x seconds, for each runner. The results are summarised by the following statistics ; ; x x 6612 364902 (a) Calculate the mean of the best times for the runners trained by coach A (1)
June 2025 · Paper 3 (Statistics) · Q2(b) 2 marks data presentation
(b) Calculate the standard deviation of the best times for the runners trained by coach A (2)
June 2025 · Paper 3 (Statistics) · Q2(c) 2 marks data presentation
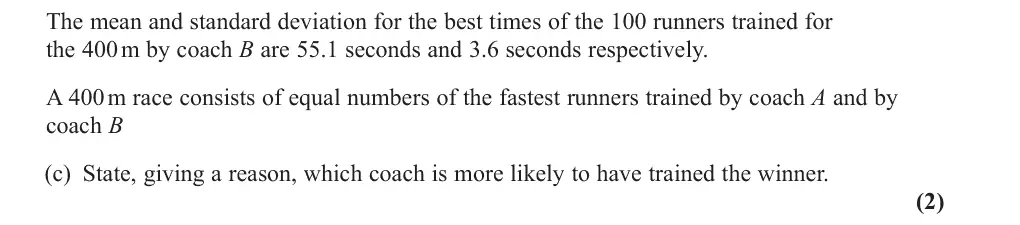
The mean and standard deviation for the best times of the 100 runners trained for the 400 m by coach B are 55.1 seconds and 3.6 seconds respectively. A 400 m race consists of equal numbers of the fastest runners trained by coach A and by coach B (c) State, giving a reason, which coach is more likely to have trained the winner. (2)
June 2025 · Paper 3 (Statistics) · Q3(a) 3 marks binomial distribution
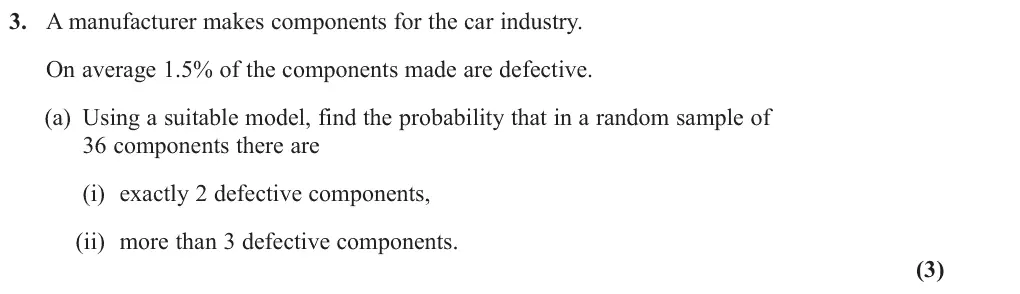
3. A manufacturer makes components for the car industry. On average 1.5% of the components made are defective. (a) Using a suitable model, find the probability that in a random sample of 36 components there are (i) exactly 2 defective components, (ii) more than 3 defective components. (3)
June 2025 · Paper 3 (Statistics) · Q3(b) 3 marks hypothesis testingbinomial distribution
Once every six months, the manufacturer tests whether the proportion of defective components has changed using hypotheses H0 : p = 0.015 and H1 : p ≠ 0.015 A random sample of 260 components is taken and 8 are found to be defective. (b) Using a 5% level of significance, complete the test. (3)
June 2025 · Paper 3 (Statistics) · Q4(a) 1 mark sampling
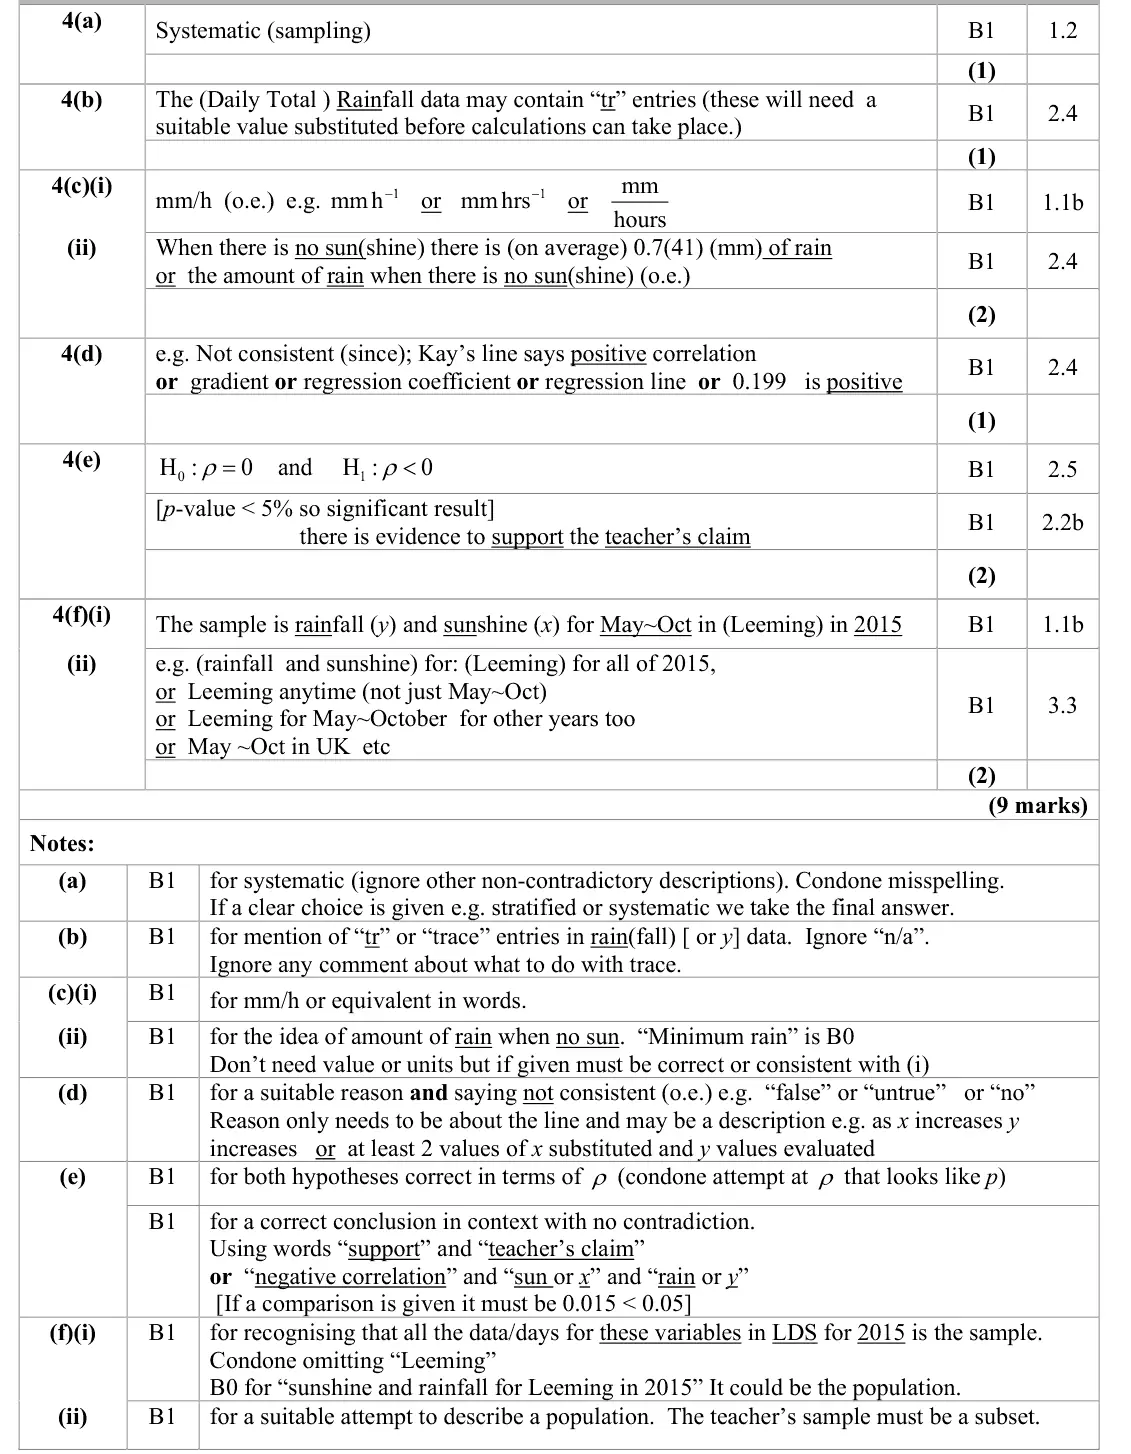
4. Kay is studying the variables Daily Total Sunshine (x) and Daily Total Rainfall (y) from the large data set for Leeming in 2015 Kay starts with 5th May and then selects every 10th day thereafter. (a) State the name of the sampling technique Kay uses. (1)
June 2025 · Paper 3 (Statistics) · Q4(b) 1 mark data presentationlarge data set
Kay wants to find the regression line of y on x for these data. (b) Using your knowledge of the large data set, explain how Kay might need to clean these data before finding the equation of the regression line. (1)
June 2025 · Paper 3 (Statistics) · Q4(c) 2 marks correlation and regressionlarge data set
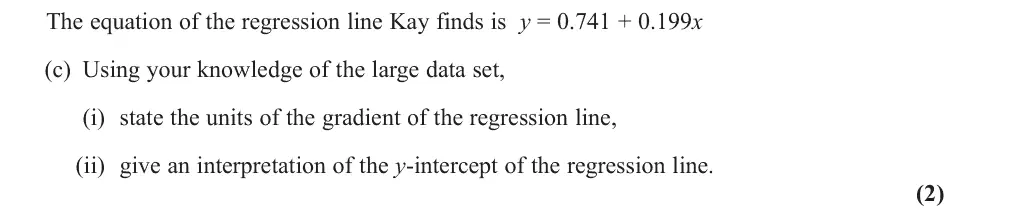
The equation of the regression line Kay finds is y = 0.741 + 0.199x (c) Using your knowledge of the large data set, (i) state the units of the gradient of the regression line, (ii) give an interpretation of the y-intercept of the regression line. (2)
June 2025 · Paper 3 (Statistics) · Q4(d) 1 mark correlation and regression
Kay’s teacher claimed that the greater the amount of sunshine in a day the lower the amount of rain there should be. (d) State, giving a reason, whether the teacher’s claim is true for Kay’s data. (1)
June 2025 · Paper 3 (Statistics) · Q4(e) 2 marks hypothesis testingcorrelation and regression
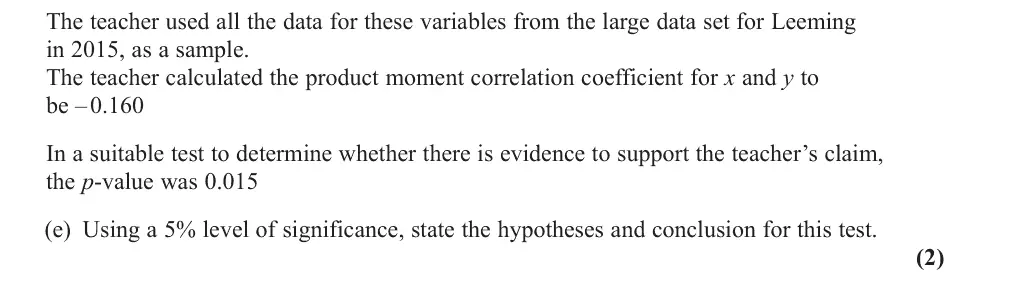
The teacher used all the data for these variables from the large data set for Leeming in 2015, as a sample. The teacher calculated the product moment correlation coefficient for x and y to be – 0.160 In a suitable test to determine whether there is evidence to support the teacher’s claim, the p-value was 0.015 (e) Using a 5% level of significance, state the hypotheses and conclusion for this test. (2)
June 2025 · Paper 3 (Statistics) · Q4(f) 2 marks samplinglarge data set
(f) For the test in part (e) describe (i) the sample, (ii) a possible population. (2)
June 2025 · Paper 3 (Statistics) · Q5(a) 2 marks normal distribution
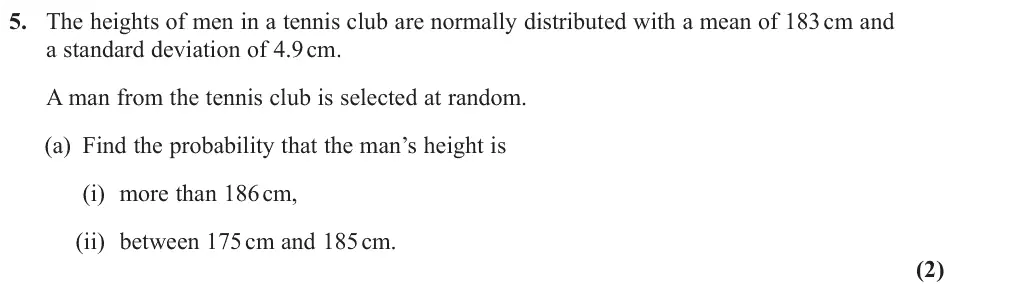
5. The heights of men in a tennis club are normally distributed with a mean of 183 cm and a standard deviation of 4.9 cm. A man from the tennis club is selected at random. (a) Find the probability that the man’s height is (i) more than 186 cm, (ii) between 175 cm and 185 cm. (2)
June 2025 · Paper 3 (Statistics) · Q5(b) 5 marks normal distributionsimultaneous equations
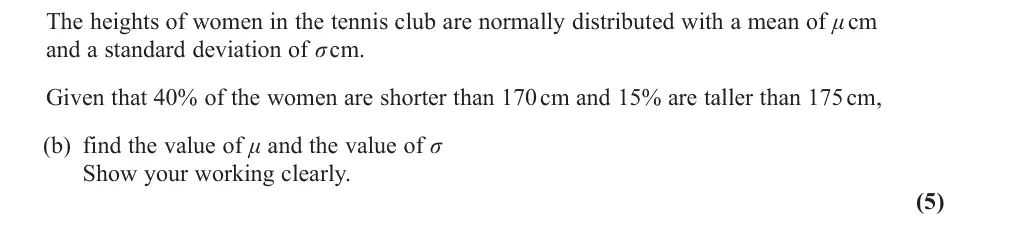
The heights of women in the tennis club are normally distributed with a mean of μ cm and a standard deviation of sigma cm. Given that 40% of the women are shorter than 170 cm and 15% are taller than 175 cm, (b) find the value of μ and the value of sigma Show your working clearly. (5)
June 2025 · Paper 3 (Statistics) · Q5(c) 3 marks normal distributionprobability
A man from the tennis club and a woman from the tennis club are selected at random. (c) Find the probability that both players have heights between 170 cm and 175 cm. (3)
June 2025 · Paper 3 (Statistics) · Q6(a) 4 marks binomial distributionsequences and series
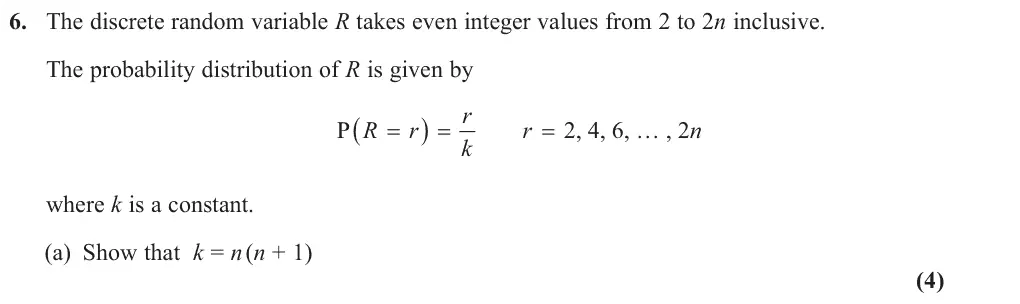
6. The discrete random variable R takes even integer values from 2 to 2n inclusive. The probability distribution of R is given by r / R r r n P 2, 4, 6, … , 2 k where k is a constant. (a) Show that k = n (n + 1) (4)
June 2025 · Paper 3 (Statistics) · Q6(b) 2 marks binomial distribution
When n = 20 (b) find the exact value of P (16 R < 26) (2)
June 2025 · Paper 3 (Statistics) · Q6(c) 5 marks binomial distributionquadraticsinequalities
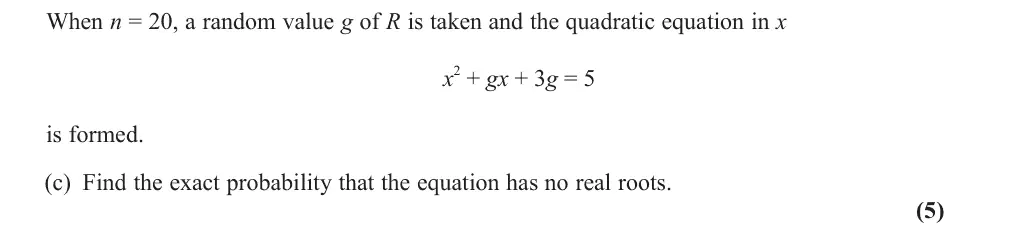
When n = 20, a random value g of R is taken and the quadratic equation in x x 2 + gx + 3g = 5 is formed. (c) Find the exact probability that the equation has no real roots. (5)

Find an Edexcel maths tutor

Want this paper marked and gone through with you? Message us.

Prefer email? Send an enquiry

If you are under 18, please include a parent's contact details. Enquiries go to enquiries@mathsaleveltutor.com and are deleted once handled.