Paper 2 (Statistics), Paper 3, Paper 3 (Statistics)
Level
AS and A level
Spec
S1.1
Since 2018
14 question parts, 21 marks
Notes, worked examples and practice for this topic are being written by our tutors. The past-paper questions below are ready now: work each one on paper, then open the mark scheme and the examiner's comment.
Tap a question to zoom it. Mark scheme and examiner's comment open under each question.
June 2025 · AS Paper 2 (Statistics) · Q2(a)1 mark
Mark scheme (whole question; this part is marked with the orange bar)
Examiner's comment
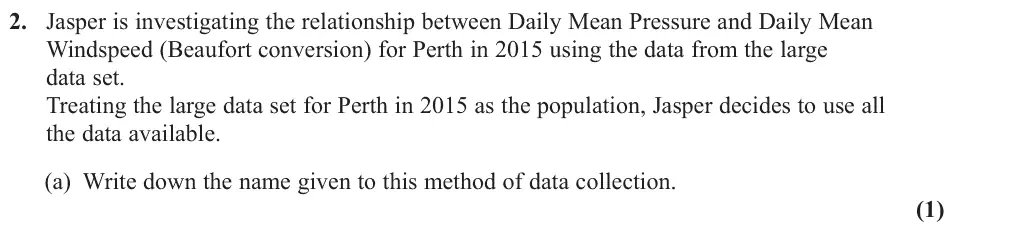
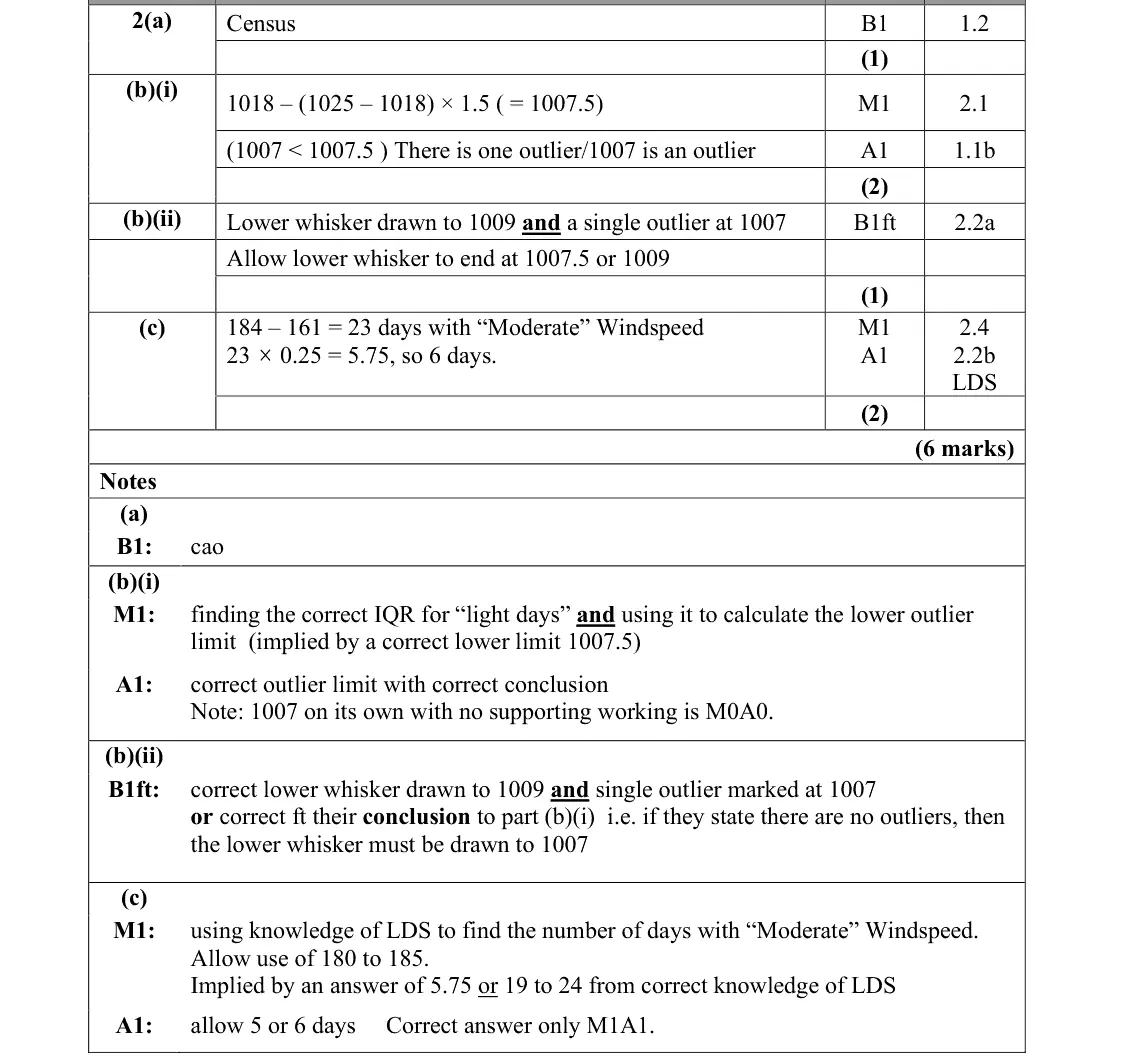
In part (a), many students were unaware that the use of all data was called a census and a common answer was "systematic sampling" and "opportunistic sampling". Most students were able to complete part (b)(i), calculating the lower outlier limit correctly
Common mistakes
using all the data is a census
common wrong answers systematic or opportunity sampling
June 2025 · Paper 3 (Statistics) · Q4(a)1 mark
Mark scheme (whole question; this part is marked with the orange bar)
Examiner's comment
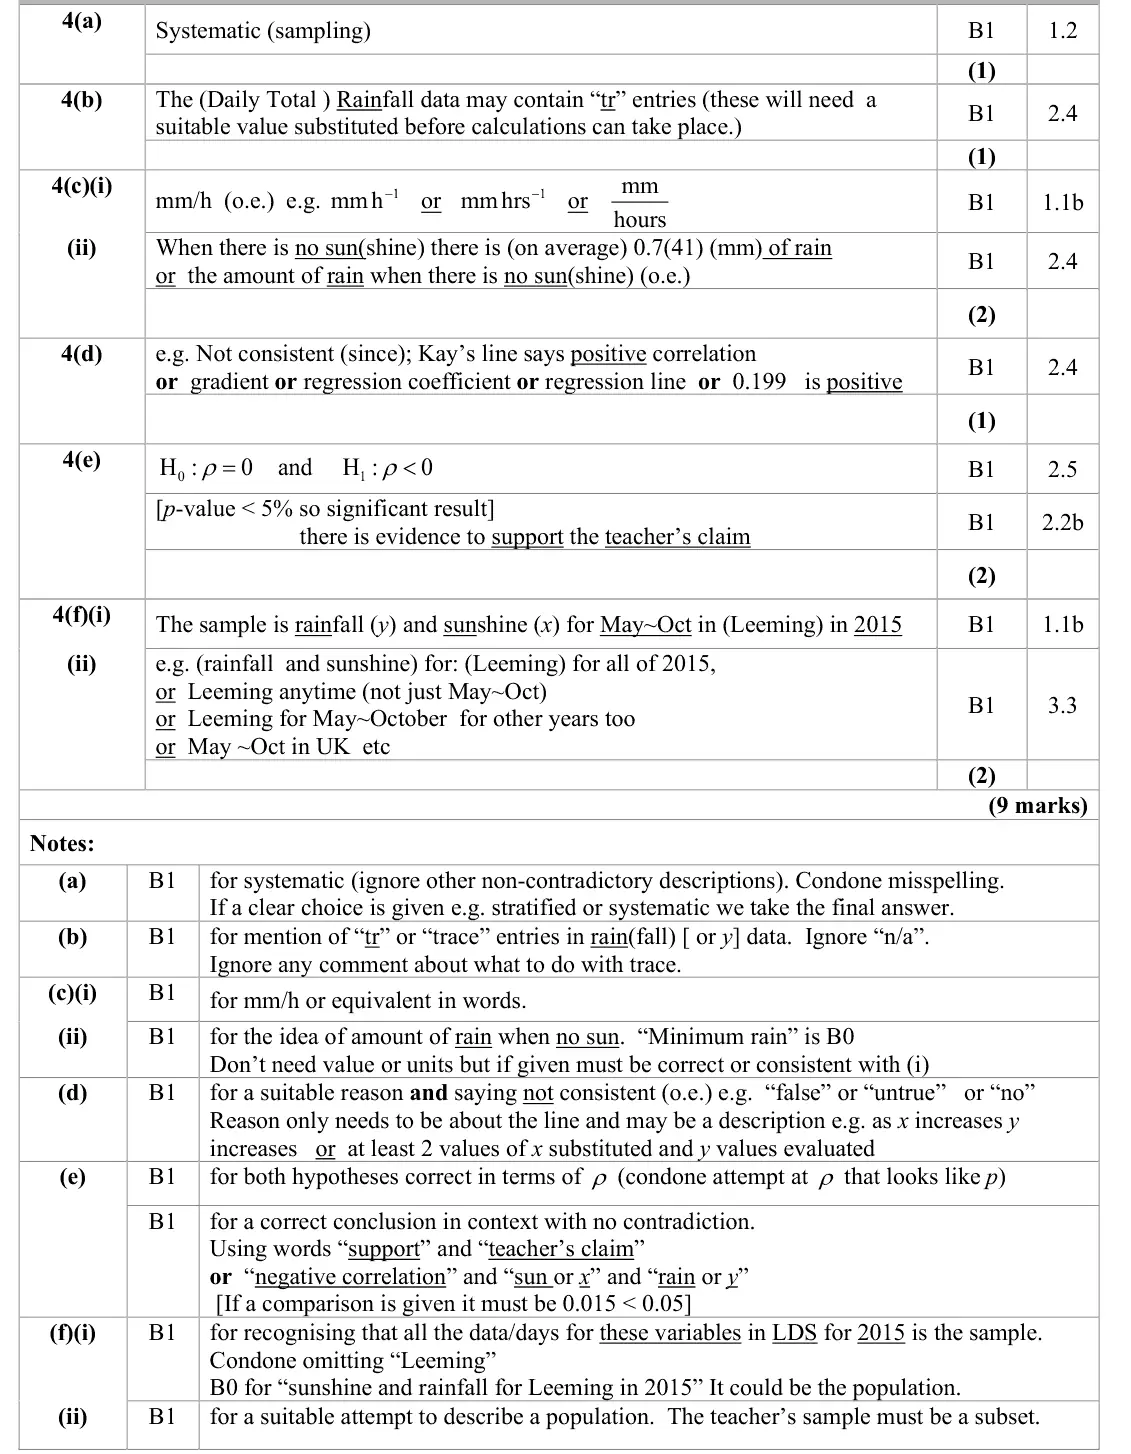
Part (a) was answered well though some incorrect responses of “stratified” or “quota sampling” were seen. There were very few responses not using the correct terminology here.
Common mistakes
systematic sampling (not stratified or quota)
June 2025 · Paper 3 (Statistics) · Q4(f)2 marks
Mark scheme (whole question; this part is marked with the orange bar)
Examiner's comment
learners and very few blank responses were seen and parts (e) and (f) provided an opportunity for differentiation. gave a correct conclusion in context. Good attempts to part (f) were rare and blank responses not uncommon. Many answers did not give full and precise definitions and others lacked clarity so that they could have been interpreted as either the sample or a population. For part (i) the information was given in the question but few were able to extract the relevant information: the variables (sun and rain) for May to October (or from the large data set) from 2015. Part (ii) produced a slightly better response with successful comments such as “sun and rain from all of 2015” or “all the variables in the large data set” or “from all across the UK” being seen. Common mistakes often involved describing a population for which the sample was not a subset such as using months from April to November or the year 2016.
Common mistakes
sample = rainfall and sunshine for Leeming May to October 2015 (all the LDS days)
population must contain the sample, e.g. all of 2015 or other years, not April to November or 2016 only
June 2023 · Paper 3 (Statistics) · Q3(c)2 marks
Mark scheme (whole question; this part is marked with the orange bar)
Examiner's comment
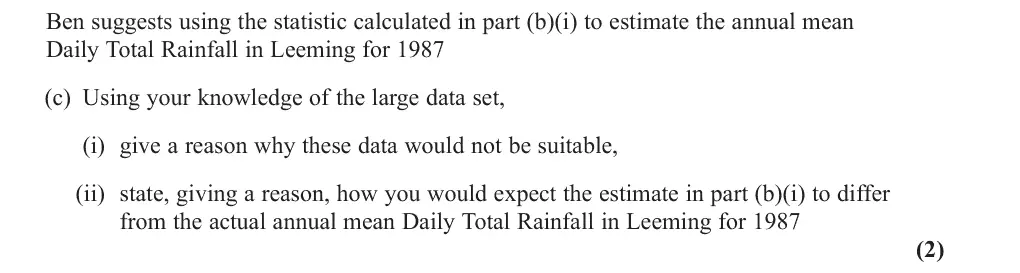
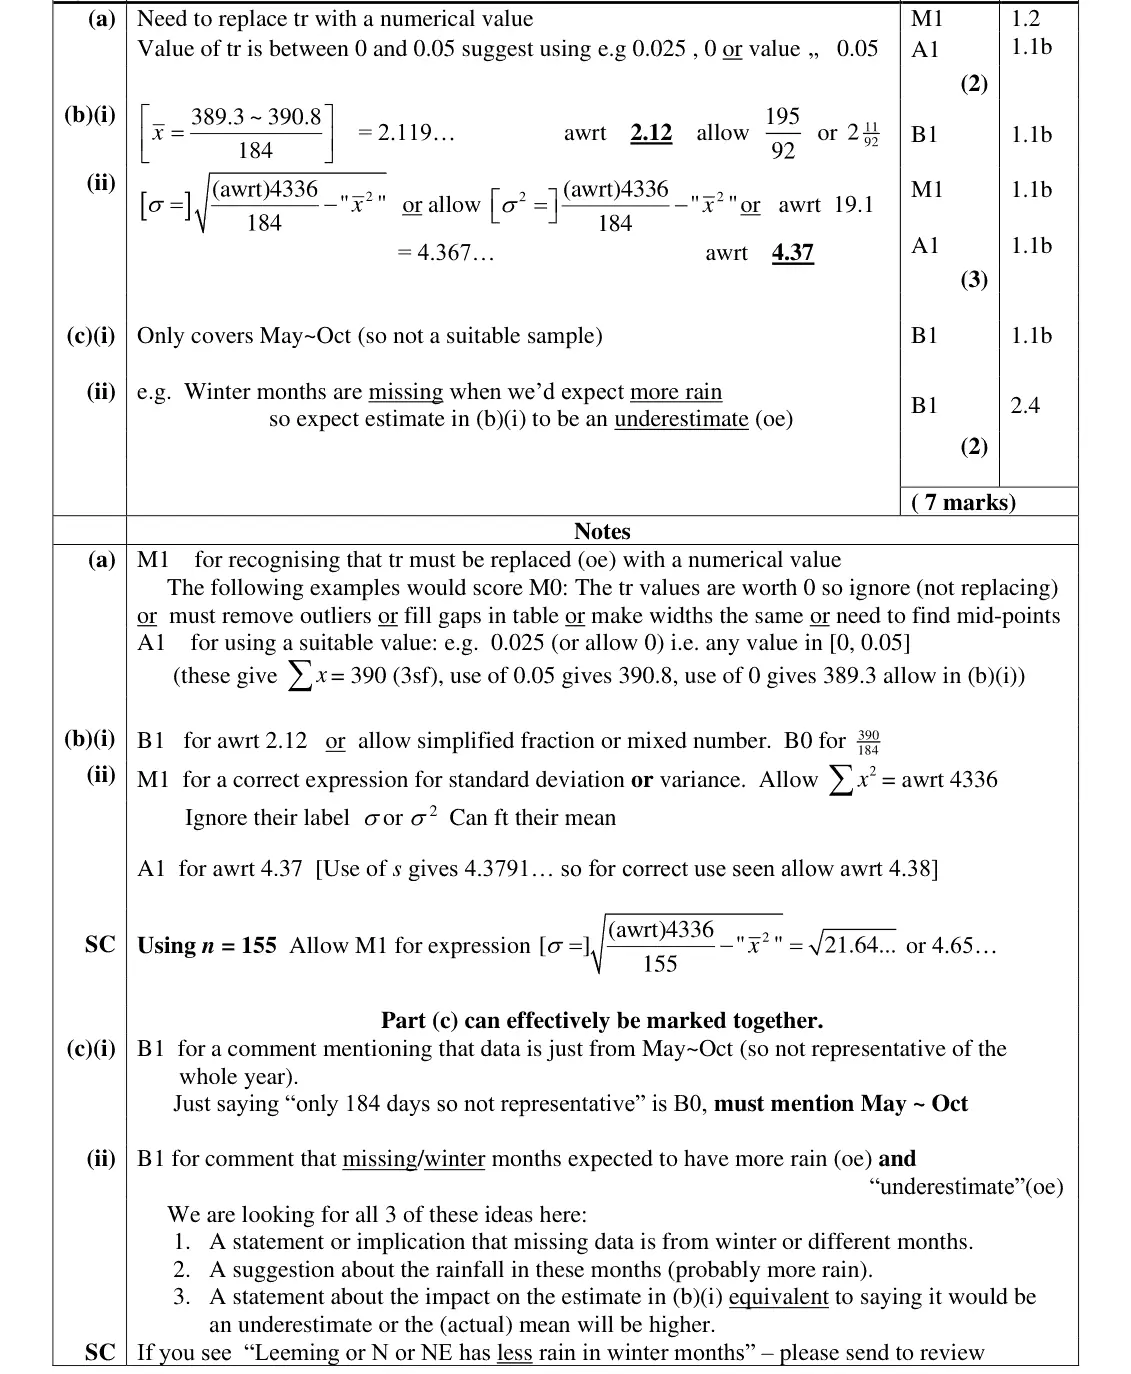
Once again the large data set aspects of this question caused problems for some students but most scored some marks here. the large data set and scoring some marks in part (c). In (i) we were simply looking for an awareness that because the large data set only had data for May to October this would not be representative of the whole population. Some demonstrated a lack of understanding of the principle of using a sample to make inferences by stating that 184 days was not a sufficiently large sample to represent the weather for the whole year. In this case the problem was not the sample size but the fact that the sample was not representative. In (ii) even some of those who had failed to mention May to October in (i) were able to score here by stating that because the missing months were in winter and they expected more rainfall then, the actual mean would be higher. The great storm of October 1987 featured in many incorrect answers to part (c).
Common mistakes
the large data set only covers May to October, so not representative
"184 days is too small a sample" scores B0
winter months are wetter so (b)(i) is an underestimate
the October 1987 storm is not the point
Oct 2021 · AS Paper 2 (Statistics) · Q3(a)1 mark
Mark scheme (whole question; this part is marked with the orange bar)
Examiner's comment
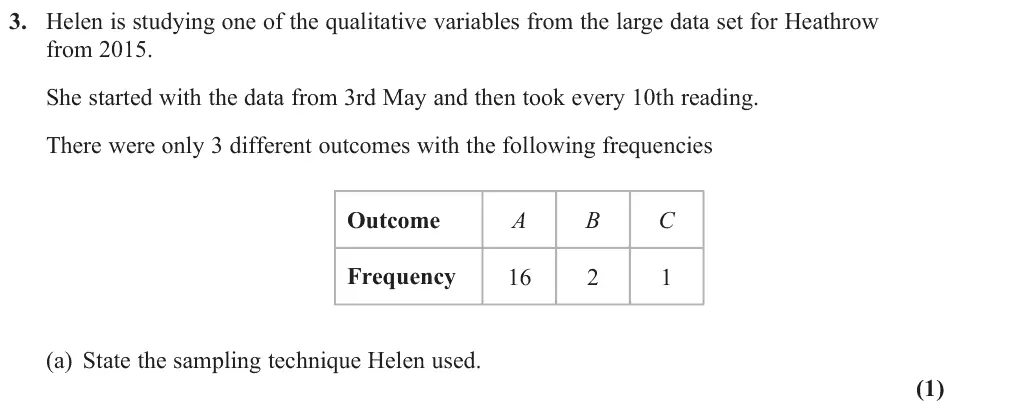
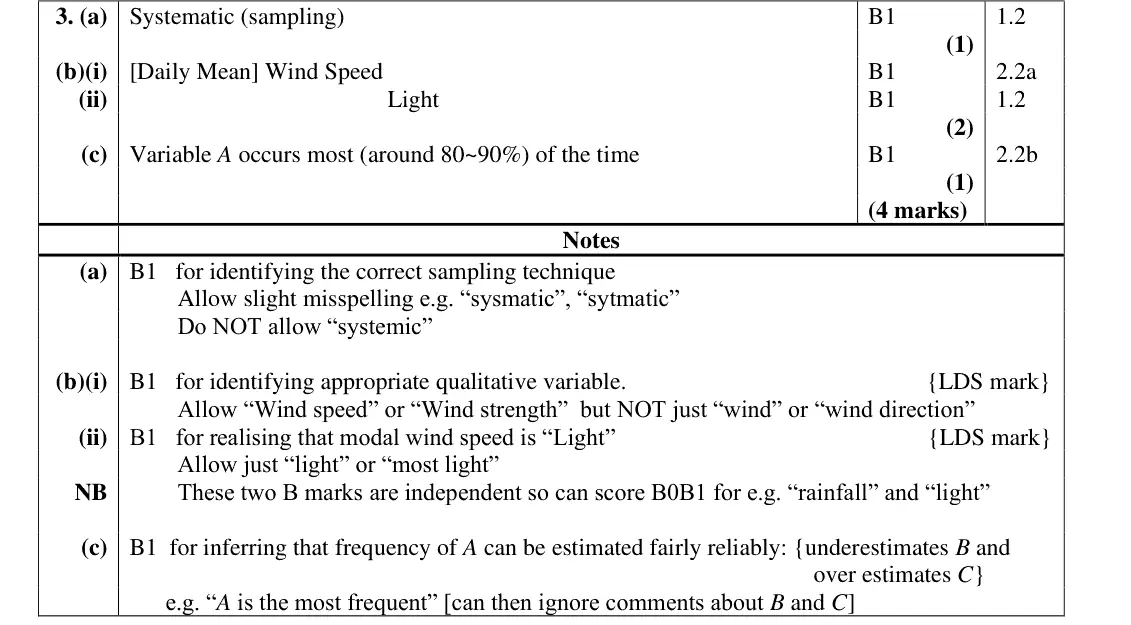
Although some showed a genuine familiarity with the large data set many seemed totally unfamiliar large data set, most correctly identified the sampling technique in part (a) and some drew a sensible inference in part (c) by simply stating that variable A was the most frequent.
Common mistakes
systematic sampling (every 10th reading)
"systemic" not accepted
Oct 2021 · AS Paper 2 (Statistics) · Q3(b)2 marks
Mark scheme (whole question; this part is marked with the orange bar)
Examiner's comment
Although some showed a genuine familiarity with the large data set many seemed totally unfamiliar with it and subsequently could not make progress in part (b). For part (b) the students needed to be familiar with the qualitative variables in the large data set (wind speed and cardinal direction were the only choices) and then select an appropriate variable in the knowledge that there were only 3 outcomes. Those who were familiar with the data set would then know that the majority of wind speeds are “light”. Aside from the large data set, most correctly identified the sampling technique in part (a) and some drew a sensible
Common mistakes
qualitative variables in the LDS are wind speed (Beaufort descriptions) and cardinal wind direction
only 3 outcomes means daily mean wind speed
modal outcome A is "light"
"wind" or "wind direction" not accepted
Oct 2021 · AS Paper 2 (Statistics) · Q3(c)1 mark
Mark scheme (whole question; this part is marked with the orange bar)
Examiner's comment
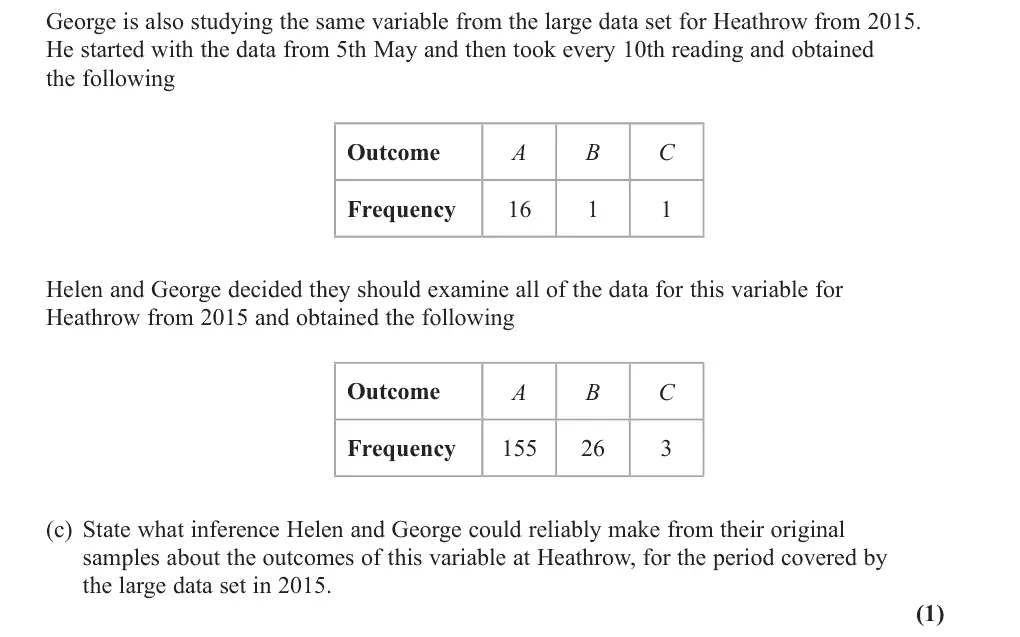
Although some showed a genuine familiarity with the large data set many seemed totally unfamiliar inference in part (c) by simply stating that variable A was the most frequent.
Common mistakes
the samples estimate the frequency of A reliably (A occurs most, about 80–90% of the time)
do not try to infer B and C from such small counts
Oct 2021 · Paper 3 (Statistics) · Q1(a)1 mark
Mark scheme (whole question; this part is marked with the orange bar)
Examiner's comment
In part (a) many scored the mark by referring to the possibility of bias being introduced by the interviewer or the lack of randomness when using quota sampling. The most common answers that did not score the mark referred to cost or time failing to appreciate that quota sampling is generally quicker and therefore cheaper to implement than simple random sampling. Some thought that quota sampling required a sampling frame which suggested they were confused about the different types of sampling. Part (b) was generally answered
Common mistakes
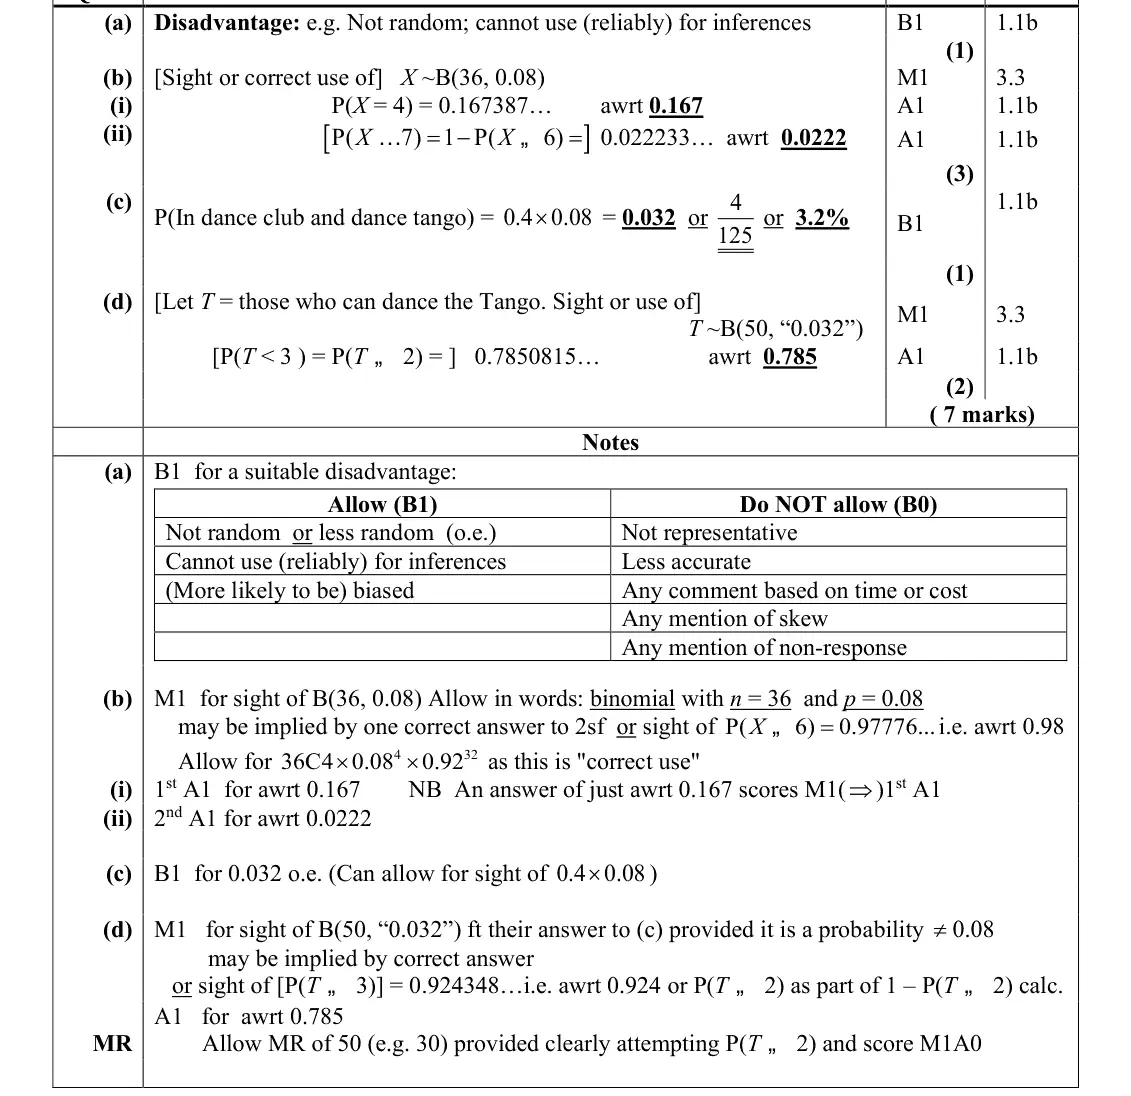
e.g. not random, (more likely to be) biased, cannot be used reliably for inferences
time or cost (quota is quicker and cheaper), "not representative", "less accurate" or non-response score B0
quota sampling needs no sampling frame
Oct 2020 · AS Paper 2 (Statistics) · Q4(a)1 mark
Mark scheme (whole question; this part is marked with the orange bar)
Examiner's comment
In part (a) Q4 (a) very few candidates understood about sampling frames and that in order to take a stratified sample one needed to be able to produce a list of the fish.
Common mistakes
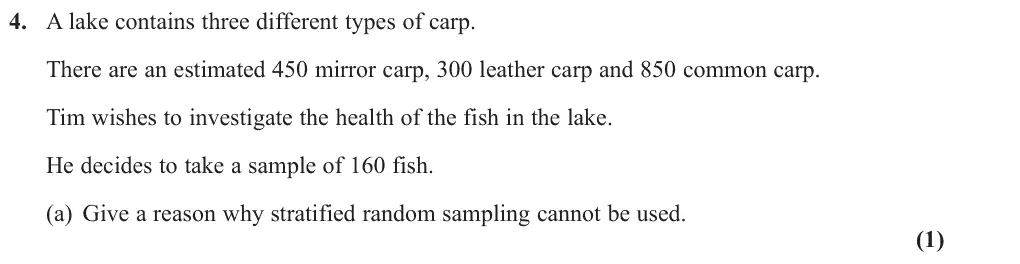
stratified sampling needs a sampling frame (a list of every fish), impossible for fish in a lake
Oct 2020 · AS Paper 2 (Statistics) · Q4(b)2 marks
Mark scheme (whole question; this part is marked with the orange bar)
Examiner's comment
In part (b) having been told that a stratified sample was not appropriate, it was slightly surprising that many chose such a sample here. There were very few fully correct answers, with most candidates who selected Quota sampling not mentioning the idea that fish are ignored once the quota for that fish is full.
Common mistakes
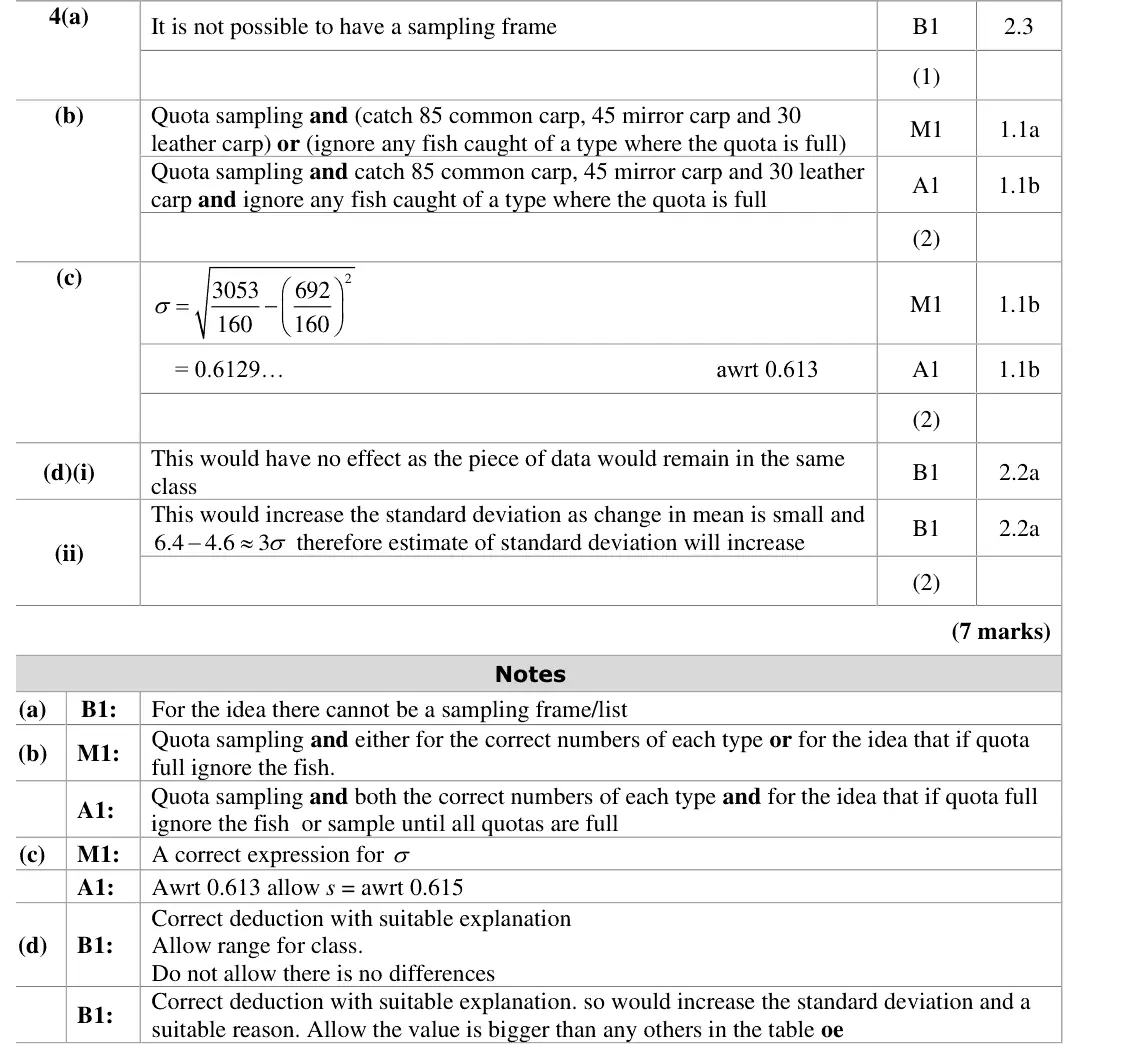
quota sampling, 45 mirror, 30 leather, 85 common (proportional to 450 : 300 : 850)
must say fish of a type whose quota is full are ignored/returned
many wrongly chose stratified again
June 2019 · AS Paper 2 (Statistics) · Q1(a)3 marks
Mark scheme (whole question; this part is marked with the orange bar)
Examiner's comment
This proved to be an accessible start to the paper with most scoring at least 1 mark in part (a) for a partial description of a stratified sample. Very few gained the first mark for clearly describing the method of splitting the population into two groups and labelling these groups. Most realised that a random sample must be taken within each strata and the correct calculation for the number of candidates for each year group was commonly seen.
Common mistakes
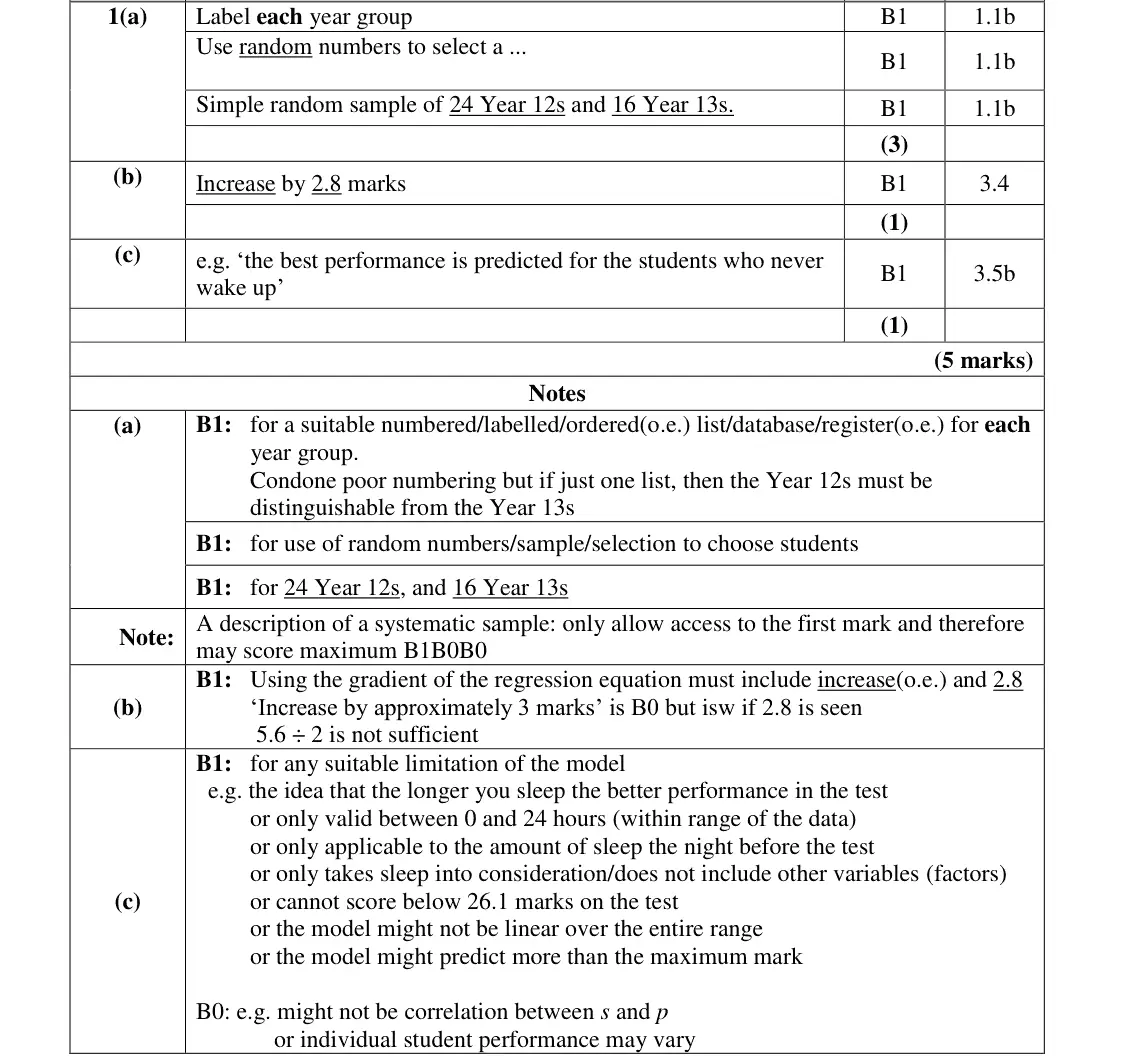
label/number each year group separately
use random numbers to take a simple random sample within each stratum
84/140 × 40 = 24 Year 12s and 16 Year 13s
the labelling mark was rarely earned
June 2018 · Paper 3 · Q4(a)1 mark
Mark scheme (whole question; this part is marked with the orange bar)
Examiner's comment
This question was answered fairly well. Most students gave a correct response in part (a) and many mentioned quota sampling in part (b). The question required a brief description of the method and
Common mistakes
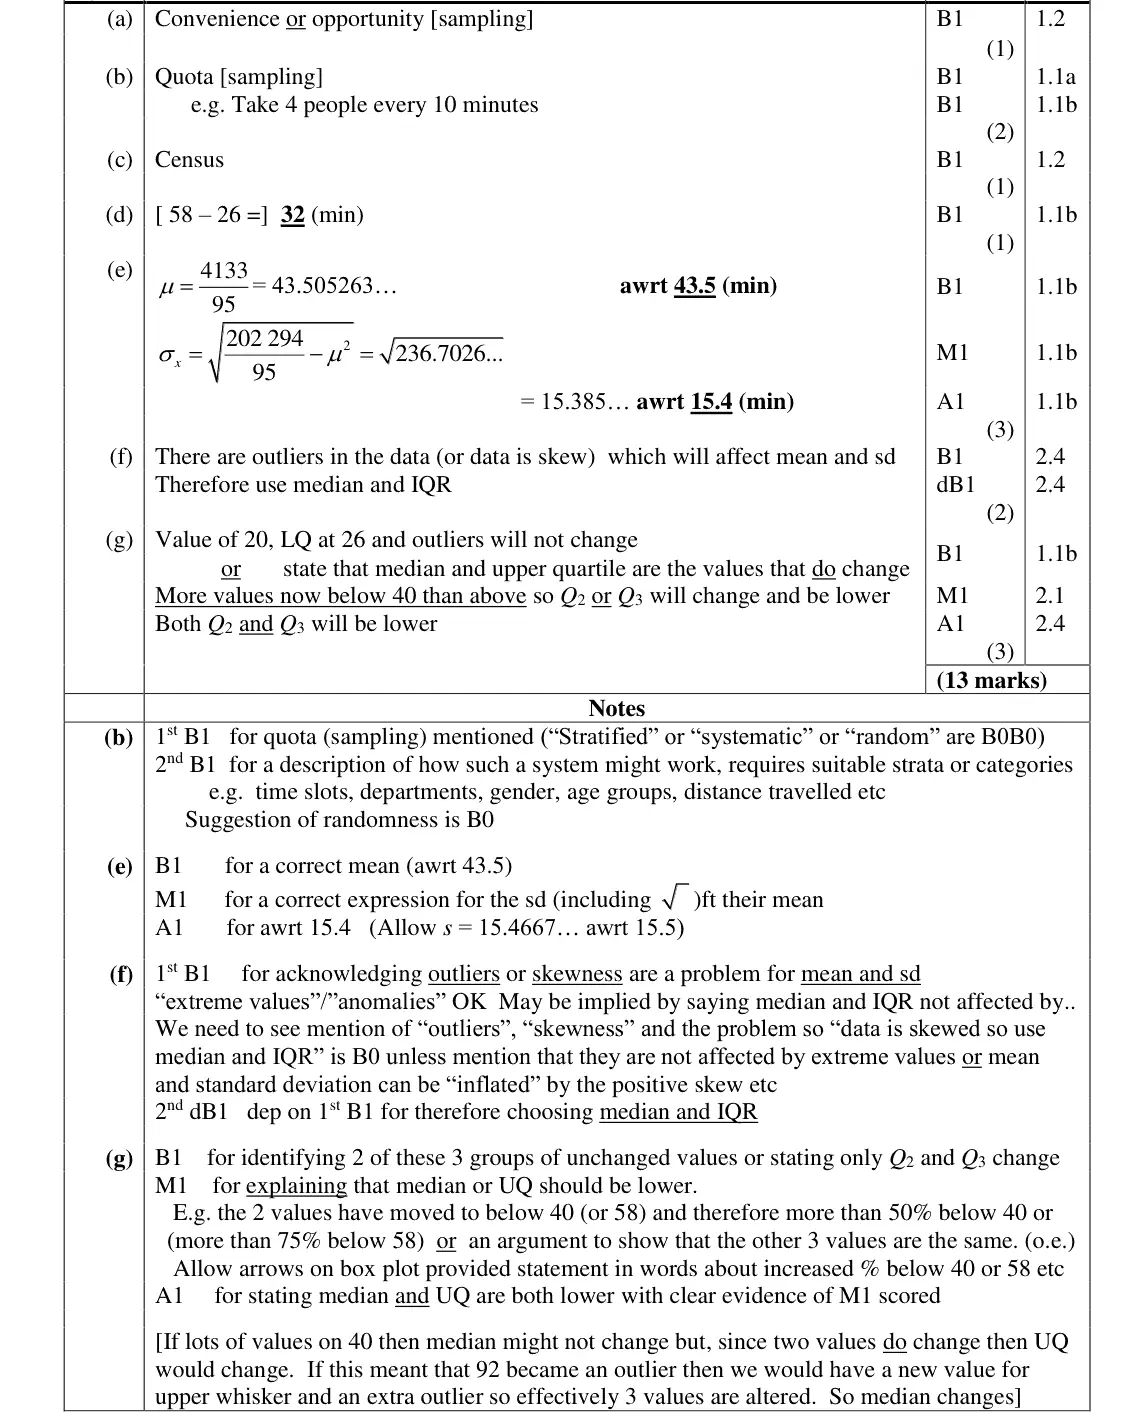
opportunity (convenience) sampling
June 2018 · Paper 3 · Q4(b)2 marks
Mark scheme (whole question; this part is marked with the orange bar)
Examiner's comment
mentioned quota sampling in part (b). The question required a brief description of the method and although some mentioned “strata” few gave a suggestion as to what these strata might be and a question like this does require the answer to be related to the context of the question. Some mentioned stratified sampling in (b) and gained no credit as this is not a “non-random” method of sampling. Most answered part (c) correctly and parts (d) and (e) were probably the best answered parts on the
Common mistakes
quota sampling with context-based categories (e.g. 4 people every 10 minutes, departments)
stratified, systematic or random is B0B0 as not non-random
June 2018 · Paper 3 · Q4(c)1 mark
Mark scheme (whole question; this part is marked with the orange bar)
Examiner's comment
Most answered part (c) correctly and parts (d) and (e) were probably the best answered parts on the whole of section A. Part (f) was a familiar type of question from the legacy S1 specification but,
Common mistakes
census (every member asked)
Find an Edexcel maths tutor
Stuck on this? Book a trial session with an Edexcel specialist.