38 question parts, 98 marks, 8 with a difficulty rating from the examiner's report
Notes, worked examples and practice for this topic are being written by our tutors. The past-paper questions below are ready now: work each one on paper, then open the mark scheme and the examiner's comment.
Tap a question to zoom it. Mark scheme and examiner's comment open under each question.
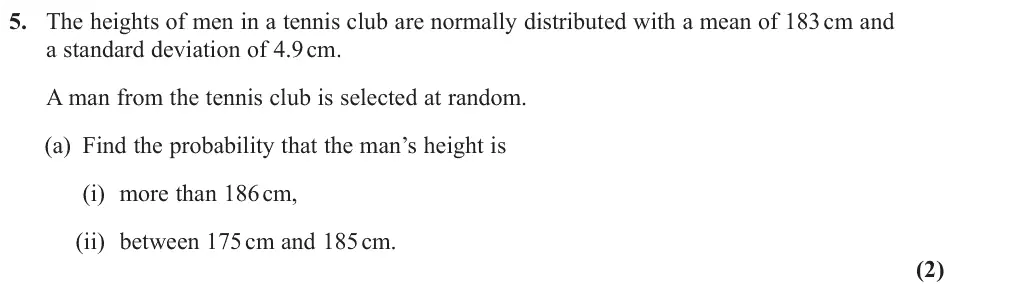
June 2025 · Paper 3 (Statistics) · Q5(a)2 marks
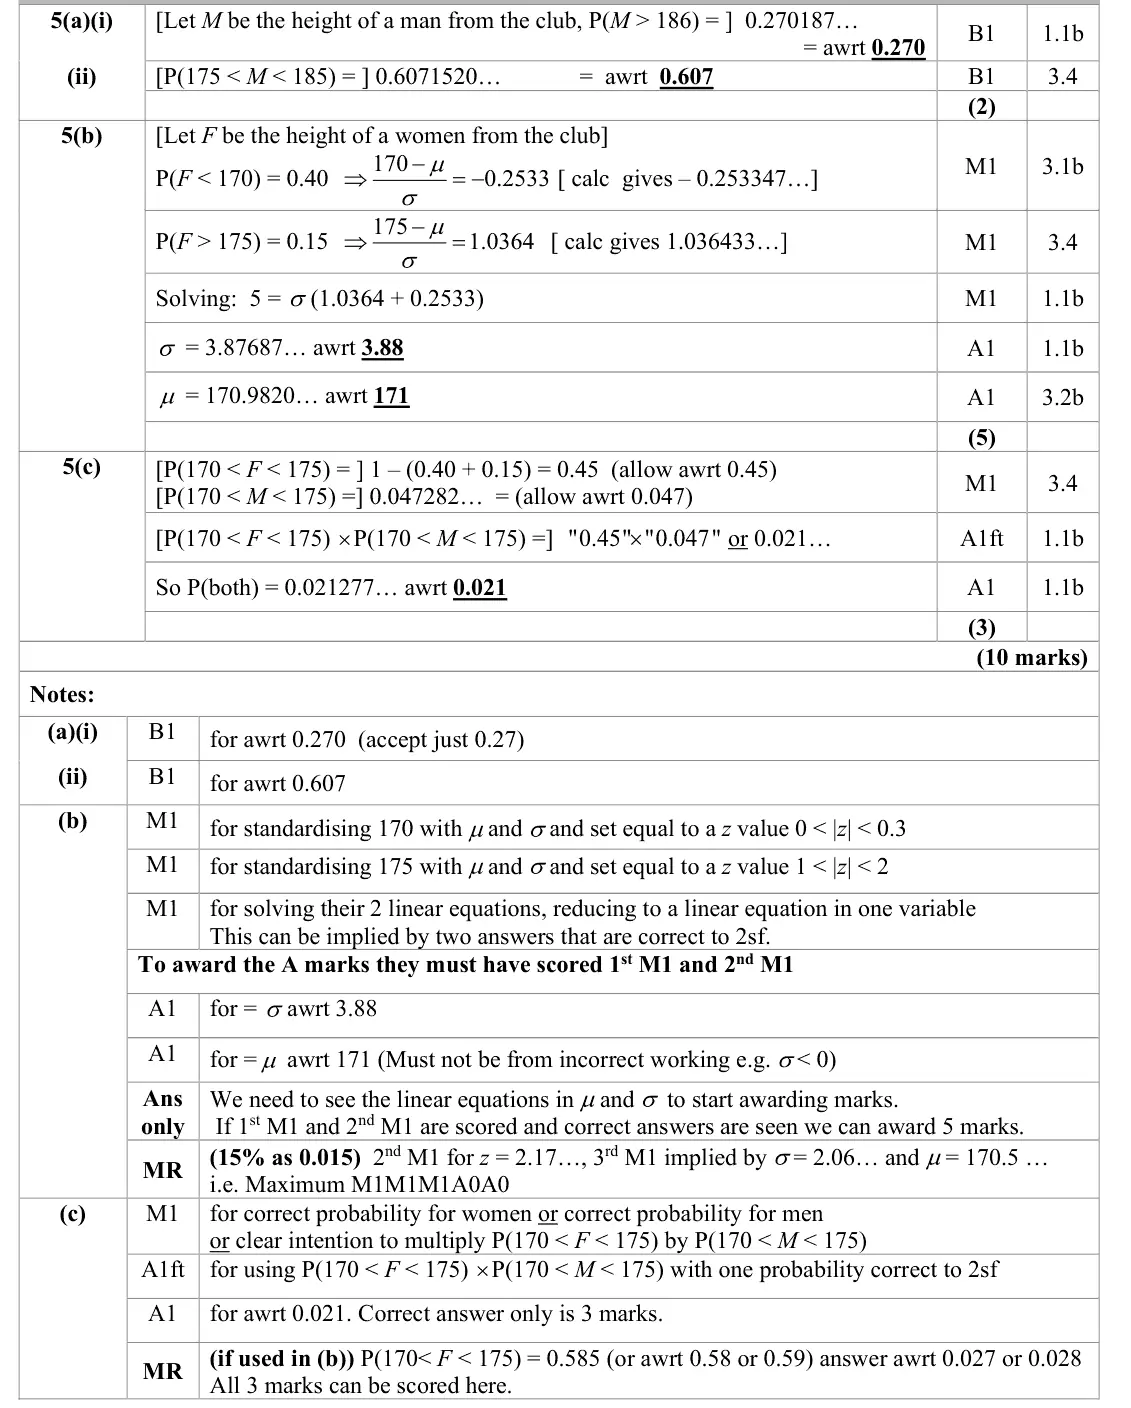
Mark scheme (whole question; this part is marked with the orange bar)
Examiner's comment
This question was answered very well. Most knew how to use their calculators to answer part variables and in part (i) calculated P(𝑀𝑀⩾187) whilst others incorrectly applied a continuity (a) though some didn’t appreciate the difference between discrete and continuous random correction.
Common mistakes
continuous: P(M > 186), no continuity correction
0.270 and 0.607
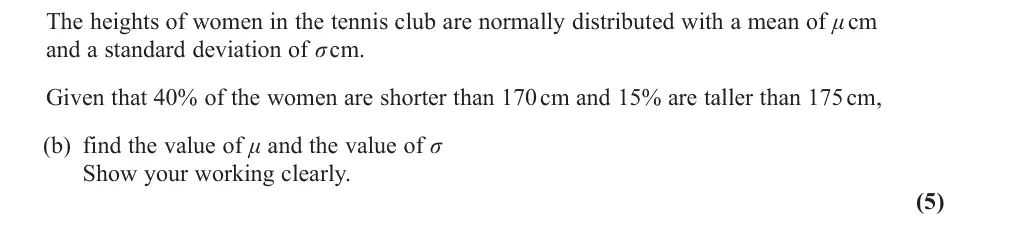
June 2025 · Paper 3 (Statistics) · Q5(b)5 marks
Mark scheme (whole question; this part is marked with the orange bar)
Examiner's comment
This question was answered very well. Most knew how to use their calculators to answer part variables and in part (i) calculated P(𝑀𝑀⩾187) whilst others incorrectly applied a continuity (a) though some didn’t appreciate the difference between discrete and continuous random correction. In part (b) many correctly formed and solved their simultaneous equations, but some made sign errors in their z-values and a few did not standardise correctly for example using 0.4 and 0.15 as z-values. Those who sketched a diagram of the distribution usually avoided sign errors. Some did not use accurate enough z-values (the tables give values to 4 decimal places) and this often meant they lost an accuracy mark for their value of sigma. Many relied on their calculator for solving the simultaneous equations which was fine if the equations were correct but without some written attempt to eliminate one variable, we were unable to give further credit if the equations were incorrect. Some responses accepted a negative standard deviation without checking to identify the error. mean and standard deviation from part (b) to calculate P(170 < F < 175) rather than using the information in the question in the calculation 1 – (0.4 + 0.15). A few responses added the two probabilities rather than multiplying here.
Common mistakes
(170 − μ)/σ = −0.2533 and (175 − μ)/σ = 1.0364
z-value signs from a sketch
do not use 0.4 or 0.15 as z
σ = 3.88, μ = 171
show the elimination, not only calculator answers
June 2025 · Paper 3 (Statistics) · Q5(c)3 marks
Mark scheme (whole question; this part is marked with the orange bar)
Examiner's comment
This question was answered very well. Most knew how to use their calculators to answer part variables and in part (i) calculated P(𝑀𝑀⩾187) whilst others incorrectly applied a continuity (a) though some didn’t appreciate the difference between discrete and continuous random correction. Part (c) was completed successfully by many learners though many used their calculated mean and standard deviation from part (b) to calculate P(170 < F < 175) rather than using the
Common mistakes
P(170 < F < 175) = 1 − (0.40 + 0.15) = 0.45 directly from the given percentages
multiply (independent), do not add
0.45 × 0.0473 = 0.021
June 2024 · Paper 3 (Statistics) · Q1(d)4 marks
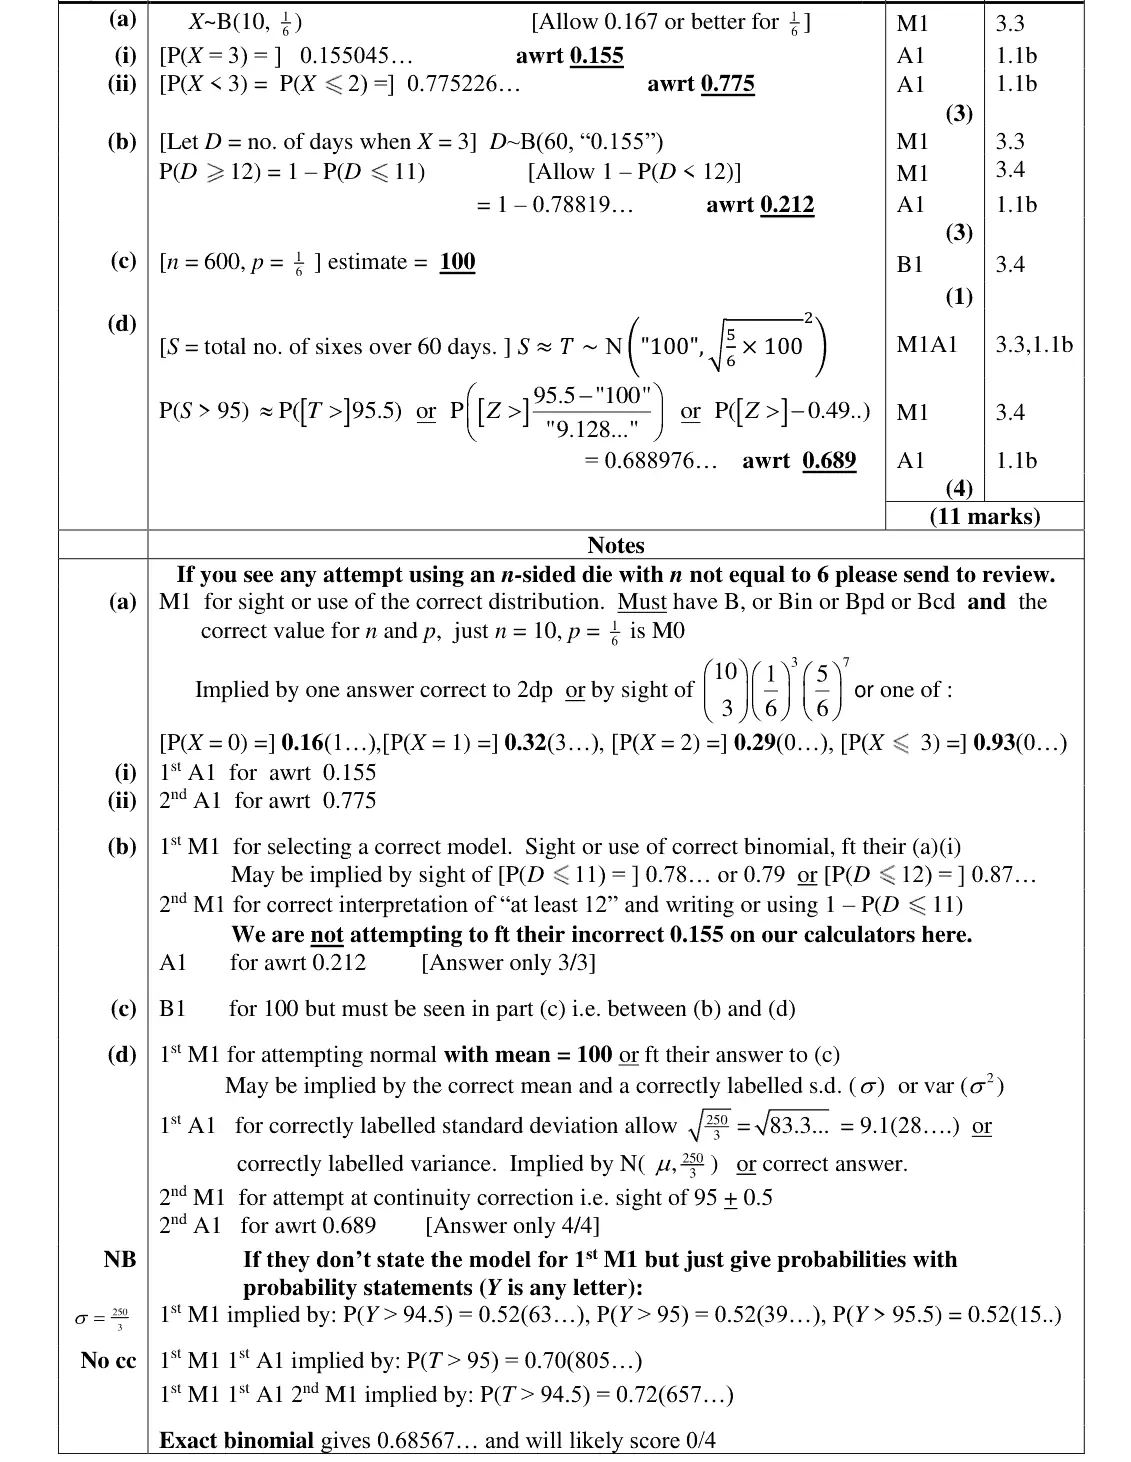
Mark scheme (whole question; this part is marked with the orange bar)
Examiner's comment
started in part (d). Many students seemed unsure about finding the standard deviation (the formulae are available in the formula booklet) and there was a great deal of mislabelling or use of the variance instead of the standard deviation. A good number realised that a continuity correction was required, though of course not always in the right direction, but the correct final answer was not uncommon.
Common mistakes
N(100, 250/3): sd = 9.13, do not use the variance as sd
Mark scheme (whole question; this part is marked with the orange bar)
Examiner's comment
Part (a) was answered very well by most students and in part (b) a good proportion also recognised the need for the events to be independent. Some students failed to score the mark in
Common mistakes
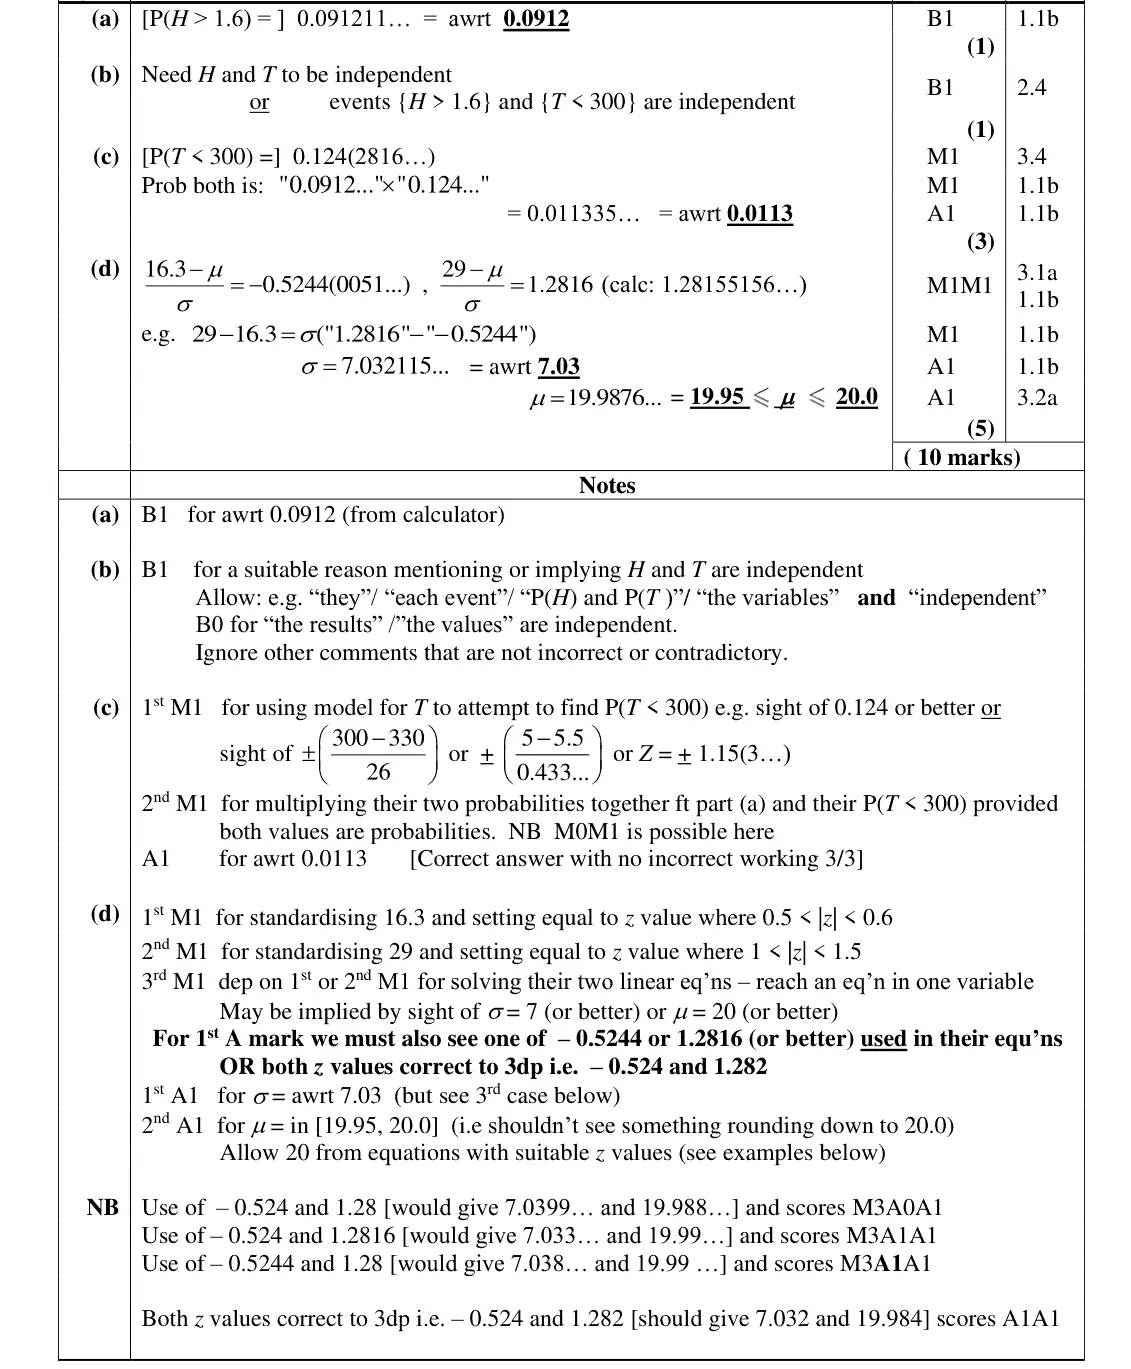
P(H > 1.6) = 0.0912 from the calculator
June 2024 · Paper 3 (Statistics) · Q5(c)3 marks
Mark scheme (whole question; this part is marked with the orange bar)
Examiner's comment
answered part (c) successfully, but some made errors when trying to find P(T < 300) either by using a continuity correction and finding P(T < 299.5) or failing to convert minutes to seconds and trying to find P(T < 5). There were many good attempts at part (d). Most students could start the problem and write
Common mistakes
5 minutes = 300 s
P(T < 300) = 0.124 (no continuity correction)
multiply by 0.0912 to get 0.0113
June 2024 · Paper 3 (Statistics) · Q5(d)5 marks
Mark scheme (whole question; this part is marked with the orange bar)
Examiner's comment
There were many good attempts at part (d). Most students could start the problem and write down a pair of linear equations in and with suitable values of z. Many students showed some working when solving their equations whilst others simply wrote down solutions using their calculators. This is fine if the equations are correct but if there are errors in the equations then the method mark cannot be awarded if no method for solving the equations is seen. The front of the paper indicates that if students use their calculators instead of the tables, then they should use an equivalent degree of accuracy which in this case, for finding the z values, was 4 decimal places. Some failed to do this and lost one of the accuracy marks but there were a good number of students scoring full marks for this part. A common error here was missing the minus sign on the z value for the lower tail and a few students assigned the z values the wrong way around.
Common mistakes
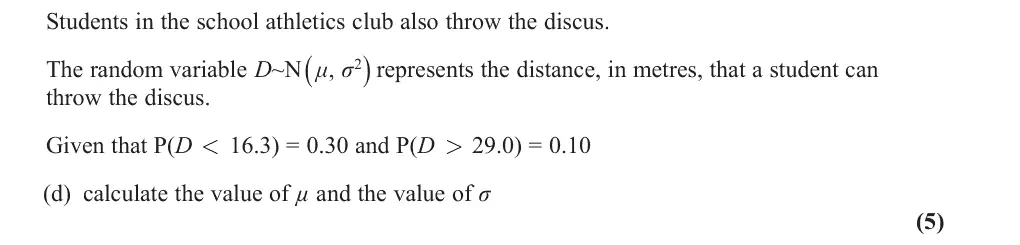
(16.3 − μ)/σ = −0.5244 (negative for the lower tail) and (29 − μ)/σ = 1.2816
z to 4 d.p.
σ = 7.03, μ = 20.0
show a method if equations are wrong
z values the wrong way round
June 2023 · Paper 3 (Statistics) · Q4(a)1 mark
Mark scheme (whole question; this part is marked with the orange bar)
Examiner's comment
Whilst it was rare to see an incorrect answer to part (a) a minority of students were unable to use their calculator to evaluate this simple probability using a normal distribution.
Common mistakes
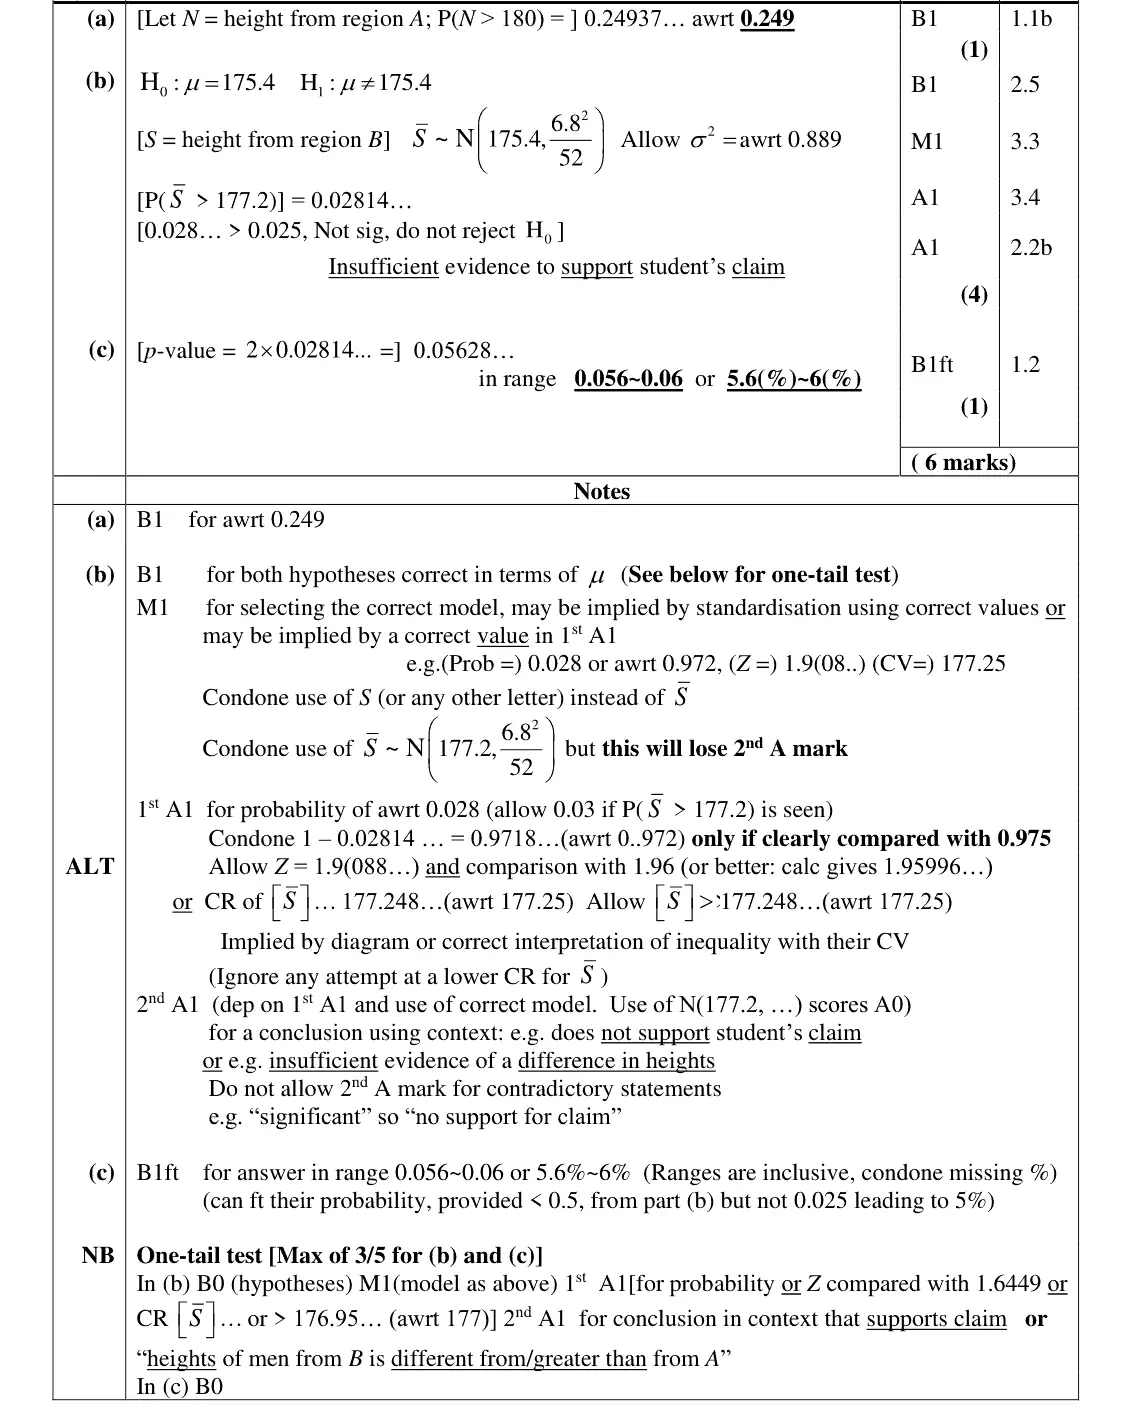
calculator normal cdf: P(N > 180) = 0.249
June 2023 · Paper 3 (Statistics) · Q4(b)4 marks
Mark scheme (whole question; this part is marked with the orange bar)
Examiner's comment
In part (b) most students stated their hypotheses correctly in terms of with very few using a one-tailed test. To score the method mark in this type of question the students simply need to select and write down the correct model (distribution). A number seemed to be listing numbers they needed for their calculator, but we expect to see the appropriate mathematical notation used. Fortunately, many obtained a correct probability and would therefore receive the method mark by implication. Some chose to standardise and find a z value (1.9088… which should be compared with 1.96) or a critical region
Common mistakes
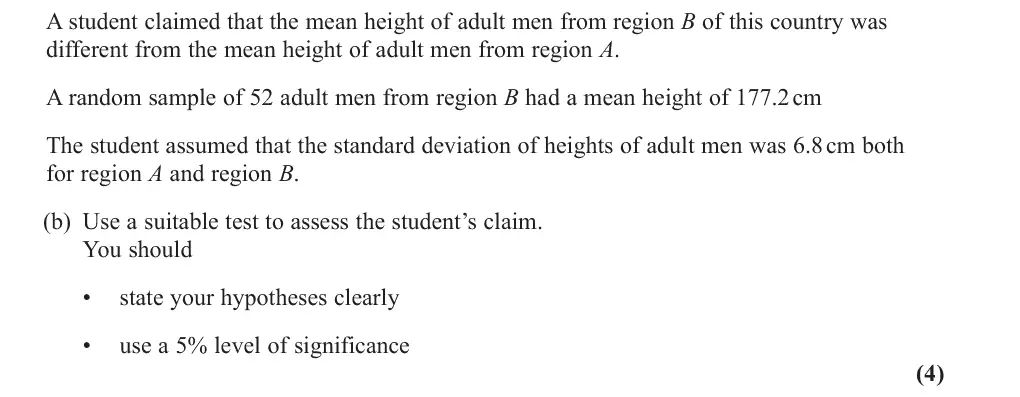
two-tailed: H1: μ ≠ 175.4, compare 0.028 with 0.025 (or z = 1.909 with 1.96)
sample mean ~ N(175.4, 6.8²/52) under H0, not mean 177.2
conclusion in context: insufficient evidence of a difference
June 2023 · Paper 3 (Statistics) · Q6(b)1 mark
Mark scheme (whole question; this part is marked with the orange bar)
Examiner's comment
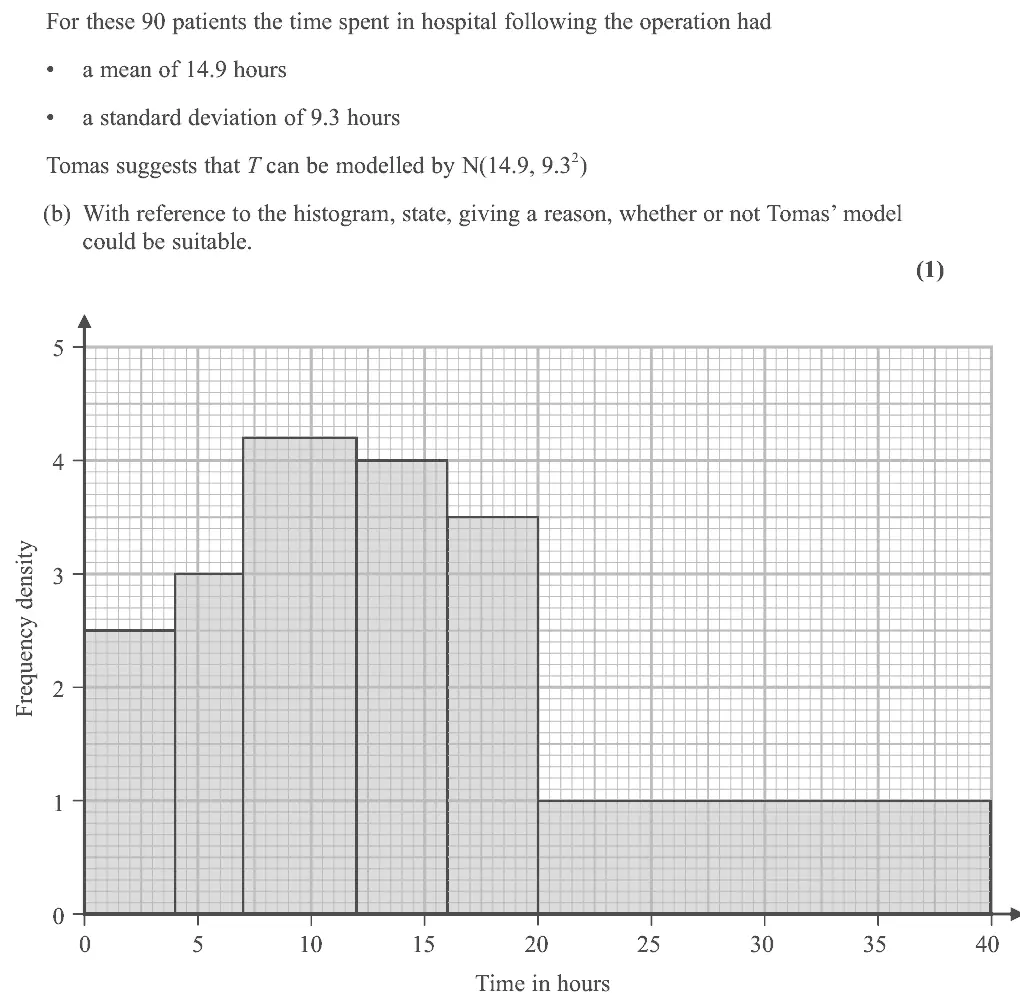
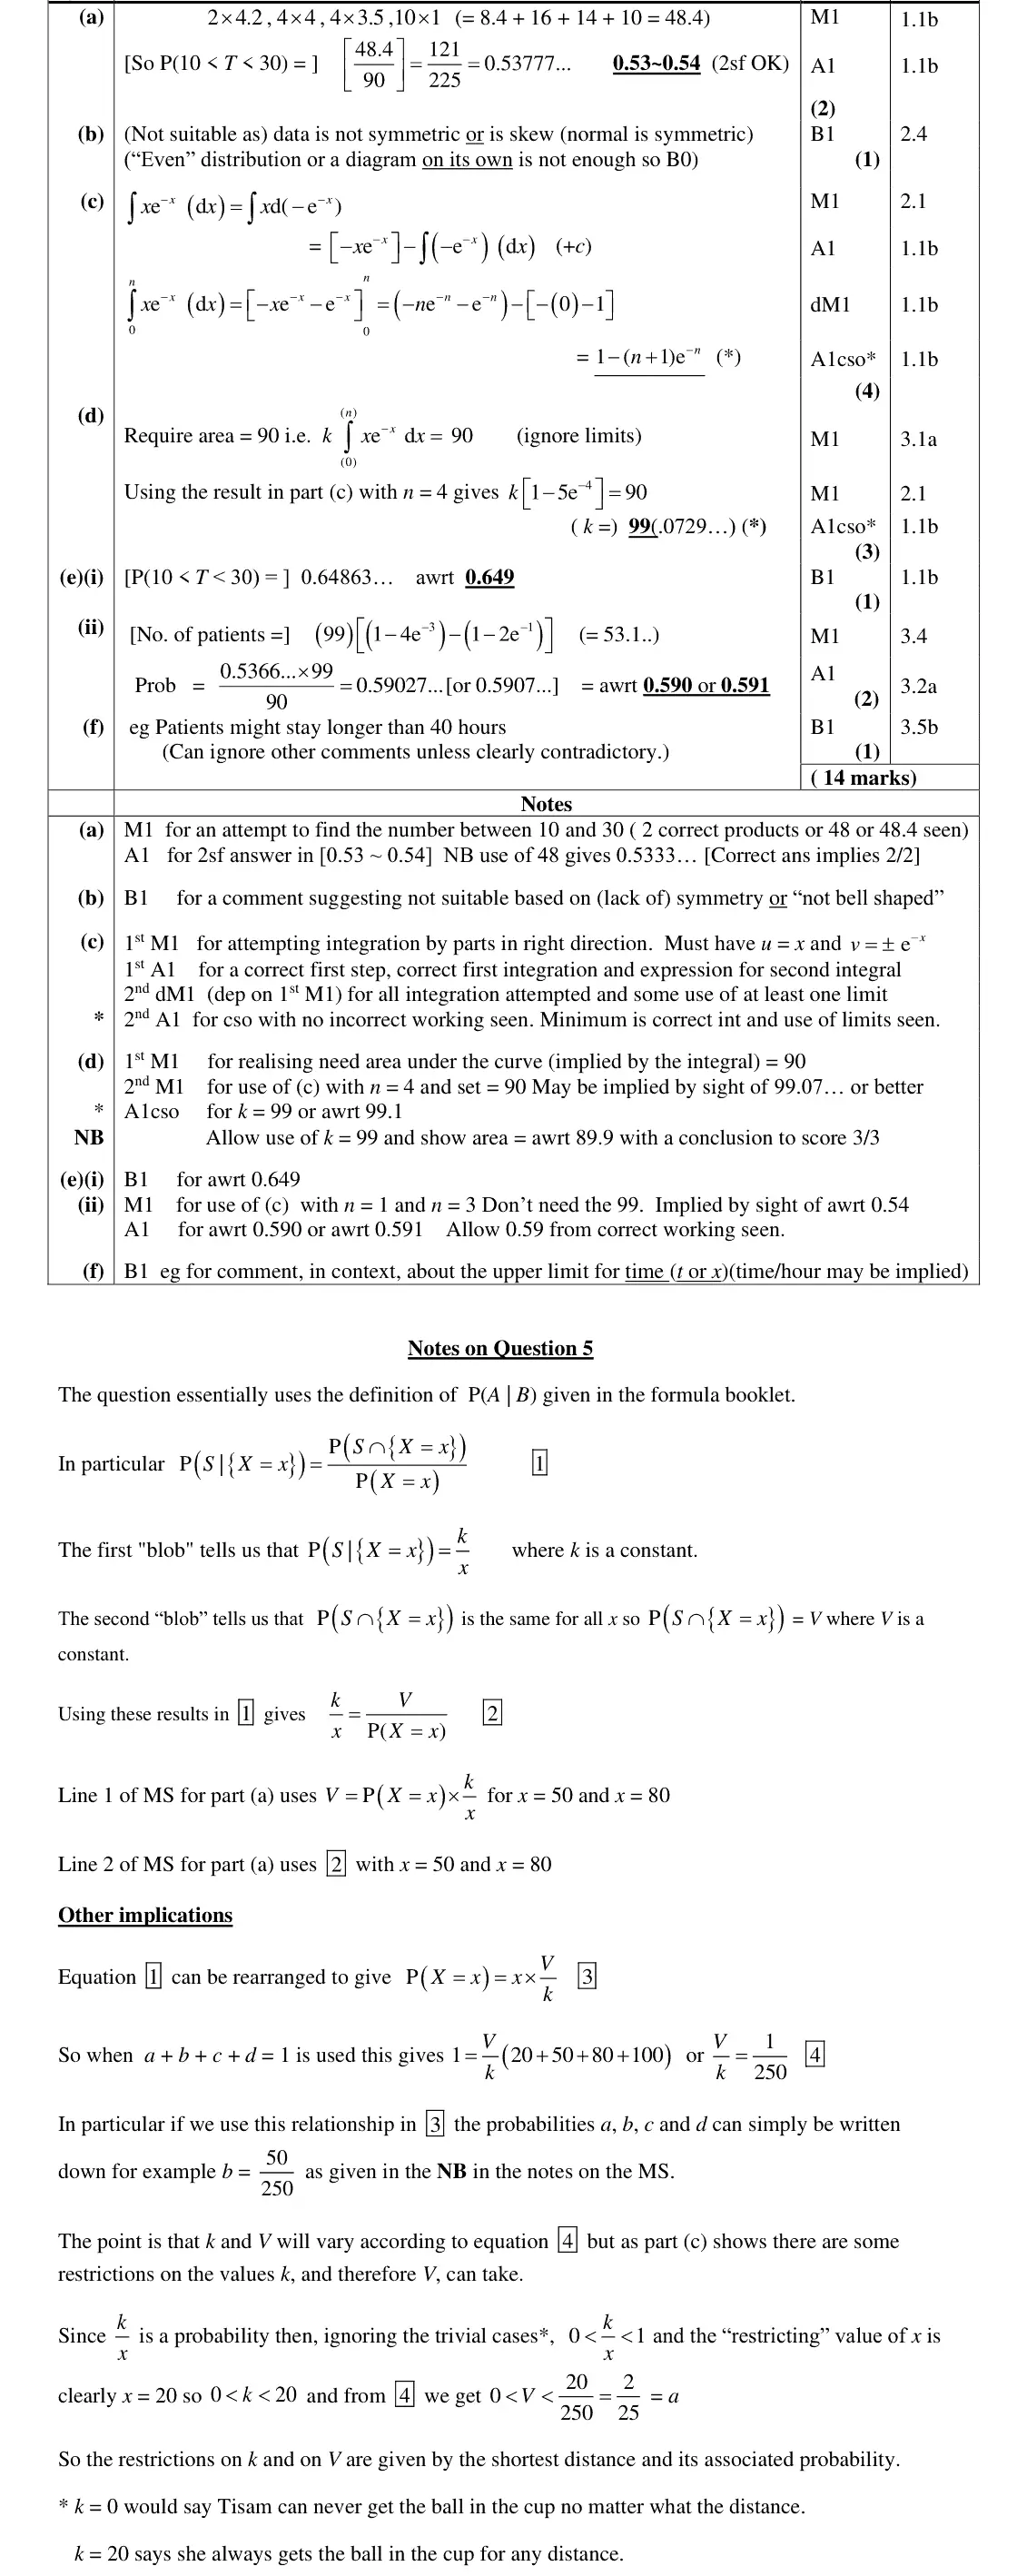
This question also proved to be quite challenging. often made and a divisor of 1600 not 1800 was often seen. Part (b) though was not answered so well. Some did explain that the histogram was not symmetric or was skewed and so a normal distribution wouldn’t be suitable. Some focussed on the continuous nature of the variable and thought it was therefore suitable whilst others thought that T was discrete and therefore a normal wasn’t suitable. The question wanted reference to the histogram and there was no expectation or requirement to find probabilities from the normal distribution nor compare the mean of the data with 14.9 If further calculations were expected these would be asked for and reflected in the mark allocation. Many students were able to use integration by parts correctly to establish the result in part
Common mistakes
histogram is skewed/not symmetric but the normal is symmetric
arguments about T being continuous or discrete score B0
no calculation expected
June 2023 · Paper 3 (Statistics) · Q6(e)(i)1 mark
Mark scheme (whole question; this part is marked with the orange bar)
Examiner's comment
This question also proved to be quite challenging.
Common mistakes
calculator: P(10 < T < 30) = 0.649
June 2022 · Paper 3 (Statistics) · Q1(b)3 marks
Mark scheme (whole question; this part is marked with the orange bar)
Examiner's comment
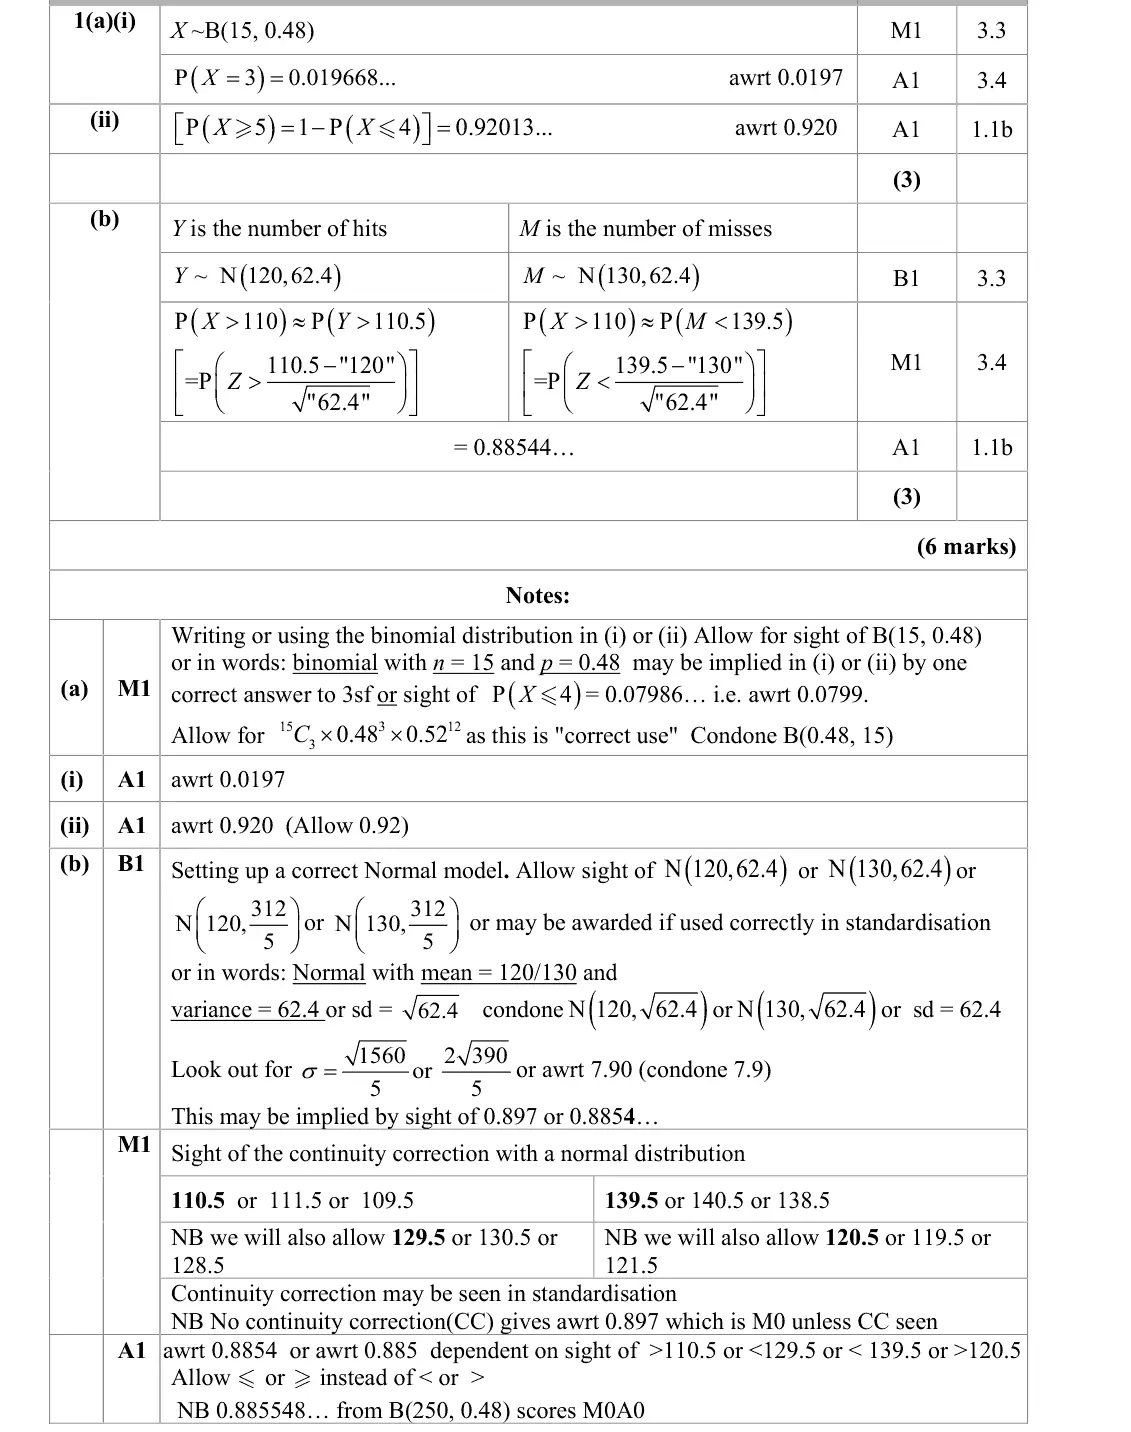
This was generally a good start to the paper for many students with almost all being able to score some of the marks on this question. Part (b) caused more problems for students. The question clearly asked the students to use a normal approximation and most found the correct mean and variance for the Normal distribution and went on to find a probability. There is some confusion about whether it is the variance or the standard deviation which is a parameter of the normal distribution and too many failed to summarise their working with a simple statement N(120, 64.2). Almost all students correctly interpreted “more than 110” as requiring P(X > 110) but a minority of students remembered to use a continuity correction, required when approximating a discrete distribution with the normal distribution, and those that did attempt to use a continuity correction often used an incorrect one, most commonly 109.5. Despite being directed to use a normal approximation by the question some students used the binomial distribution. This gave an answer very close to the one obtained from the correct distribution, so it was very important to write down the distribution used, the probability statement with its continuity correction and give the answer to a sufficient degree of accuracy before rounding.
Common mistakes
N(120, 62.4): 62.4 is the variance, sd = √62.4
continuity correction P(Y > 110.5) = 0.885 (109.5 is a common wrong one
no correction gives 0.897)
an exact binomial answer scores 0
June 2022 · Paper 3 (Statistics) · Q2(a)2 marks
Mark scheme (whole question; this part is marked with the orange bar)
Examiner's comment
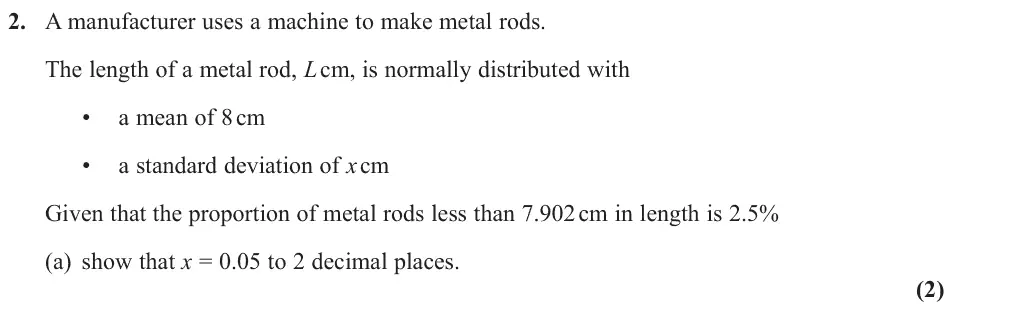
Students had mixed success with part (a) of this question. Most students who recognised that they needed to use standardisation and found a z-value of ± 1.96 completed the proof without error scoring both marks. A few students who used + 1.96 then “fudged” the signs part way through their solution losing the A mark.
Common mistakes
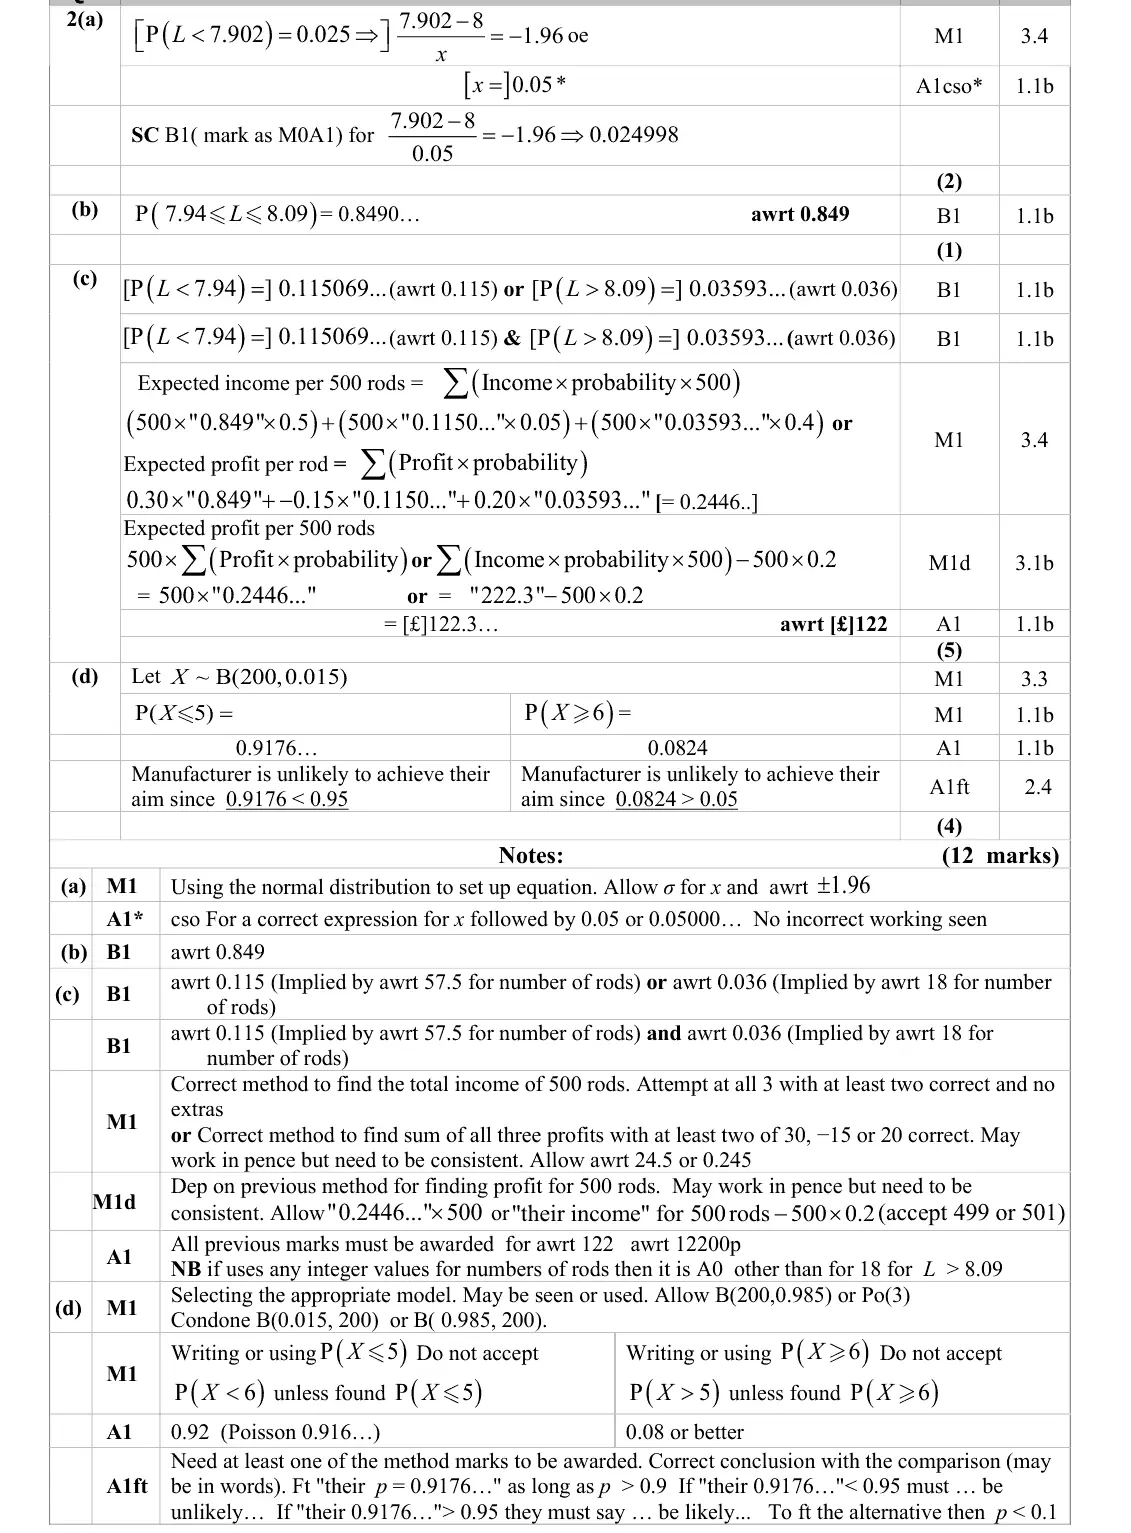
(7.902 − 8)/x = −1.96 gives x = 0.05
sign of z must be negative from the start (no fudging)
verifying with x = 0.05 is only a special case
June 2022 · Paper 3 (Statistics) · Q2(b)1 mark
Mark scheme (whole question; this part is marked with the orange bar)
Examiner's comment
Part (b) was a good introduction to part (c) with the majority of students scoring the mark although there were some who didn’t read the question carefully enough and used the 7.902 from (a) as the lower limit rather than 7.94 The majority of marks lost were due to rounding to 2 s.f Most students were able to make a credible attempt at answering part (c). However, there was a lot of information for students to process and it was common to see errors or omissions at some point in their solution. There were several correct ways of approaching this question. All approaches required the calculation of the probability of a rod lying in each of the categories, some students mistakenly used P(L < 7.94) = 0.025 presumably assuming that 7.94 was the value given in the question (7.902). Another common error was assuming that 7.94 and 8.09 were evenly spaced about the mean so the probability from (b) was subtracted from 1 and then the result halved. Once the students had found the probabilities a common approach was to start with calculating the number of rods in each category, and then calculating the income/profit. Many students calculated the total income and went no further. Whether this was because of a misunderstanding of the term “profit” or whether having got that far they simply forgot to subtract the costs was unclear. The ability for students to apply their skills in “real life” situations needs further development including training in setting out working methodically Common errors included rounding the probabilities inappropriately, rounding the number of rods to integer values and some occasionally being uncertain whether they were working in pounds or pence. The most successful answers were those where the calculation was combined into a single expression.
Common mistakes
P(7.94 ≤ L ≤ 8.09) = 0.849
use 7.94, not 7.902 from (a)
3 s.f. not 2
June 2022 · Paper 3 (Statistics) · Q2(c)5 marks
Mark scheme (whole question; this part is marked with the orange bar)
Examiner's comment
Part (b) was a good introduction to part (c) with the majority of students scoring the mark although there were some who didn’t read the question carefully enough and used the 7.902 from (a) as the lower limit rather than 7.94 The majority of marks lost were due to rounding to 2 s.f Most students were able to make a credible attempt at answering part (c). However, there was a lot of information for students to process and it was common to see errors or omissions at some point in their solution. There were several correct ways of approaching this question. All approaches required the calculation of the probability of a rod lying in each of the categories, some students mistakenly used P(L < 7.94) = 0.025 presumably assuming that 7.94 was the value given in the question (7.902). Another common error was assuming that 7.94 and 8.09 were evenly spaced about the mean so the probability from (b) was subtracted from 1 and then the result halved. Once the students had found the probabilities a common approach was to start with calculating the number of rods in each category, and then calculating the income/profit. Many students calculated the total income and went no further. Whether this was because of a misunderstanding of the term “profit” or whether having got that far they simply forgot to subtract the costs was unclear. The ability for students to apply their skills in “real life” situations needs further development including training in setting out working methodically Common errors included rounding the probabilities inappropriately, rounding the number of rods to integer values and some occasionally being uncertain whether they were working in pounds or pence. The most successful answers were those where the calculation was combined into a single expression.
Common mistakes
P(L < 7.94) = 0.115 and P(L > 8.09) = 0.036 (not 0.025, and the limits are not symmetric about 8)
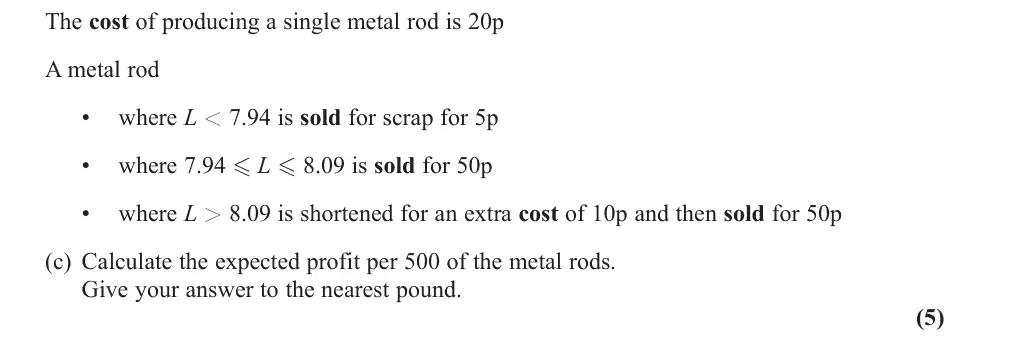
profits 30p, −15p, 20p per rod
subtract the 500 × 20p cost (many stopped at income)
£122
June 2022 · Paper 3 (Statistics) · Q3(d)1 mark
Mark scheme (whole question; this part is marked with the orange bar)
Examiner's comment
There was a wide variety of responses to part (d). Successful students often stated one or more of the conditions of the Binomial Distribution, with reasons why this distribution was not suitable in this case. e.g. • the probability needs to be independent but the probability of rainfall is not independent as it often depends on the weather from the day before. • the probability of rain needs to be constant but the probability was taken from May to October and summer is June to September and therefore the probability is likely to be higher than in the summer when there is less rain Errors included • referring to independence without context • commenting on the great storm of 1987 or global warming • stating that the data is out of date • the sample size is too small • some values are trace values and/or rainfall is influenced by other factors.
Common mistakes
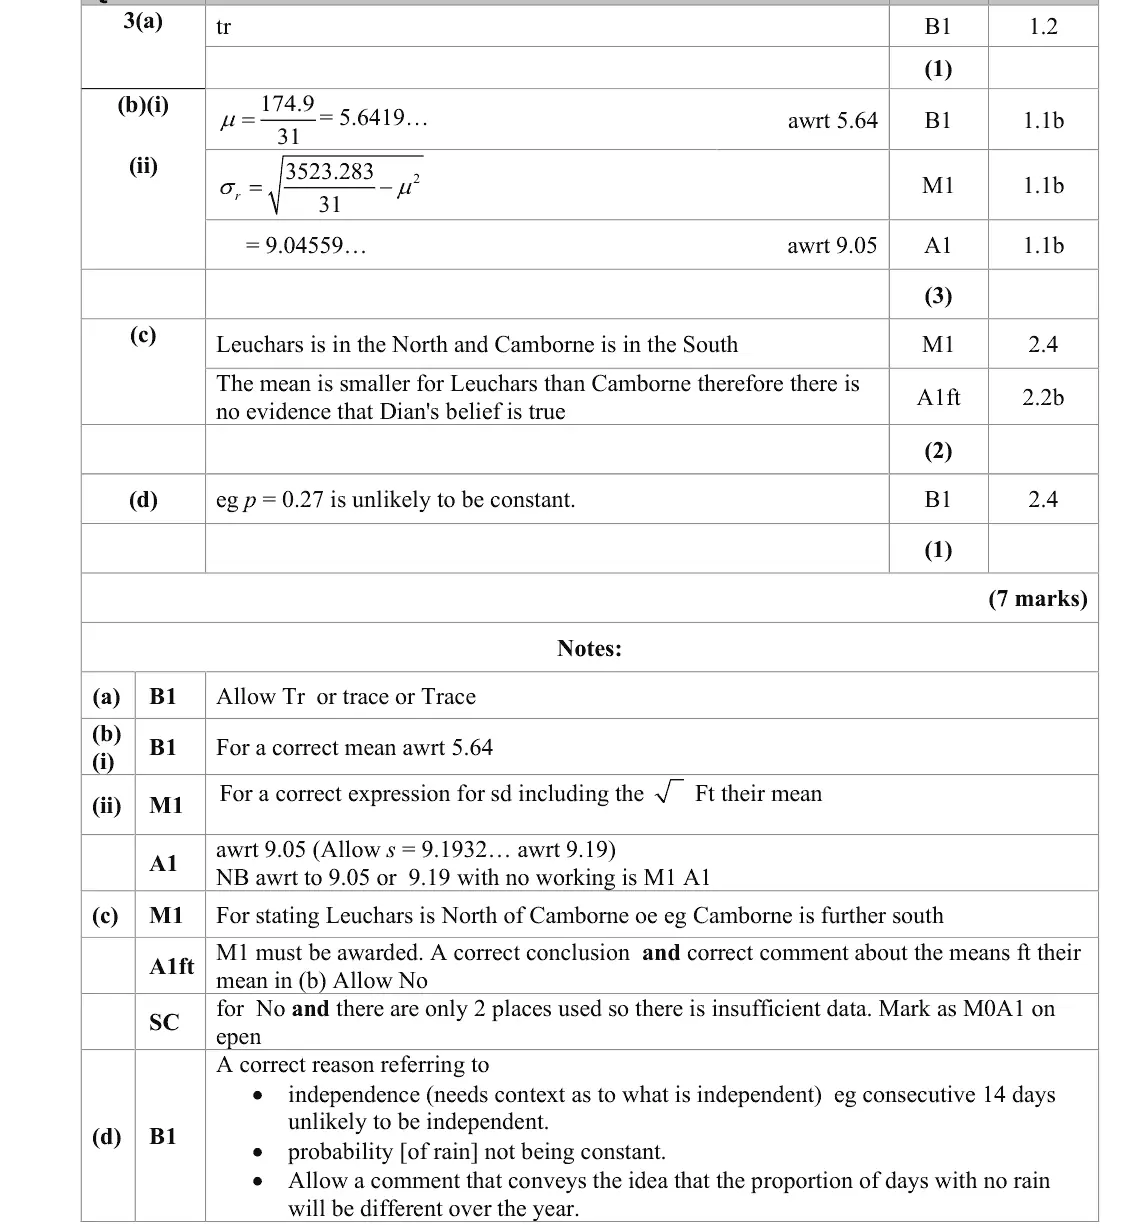
probability of a dry day unlikely to be constant over the year (estimate is not from summer) or days not independent (in context)
comments on 1987 storm, sample size or trace values score 0
Oct 2021 · Paper 3 (Statistics) · Q5(a)2 marks
Mark scheme (whole question; this part is marked with the orange bar)
Examiner's comment
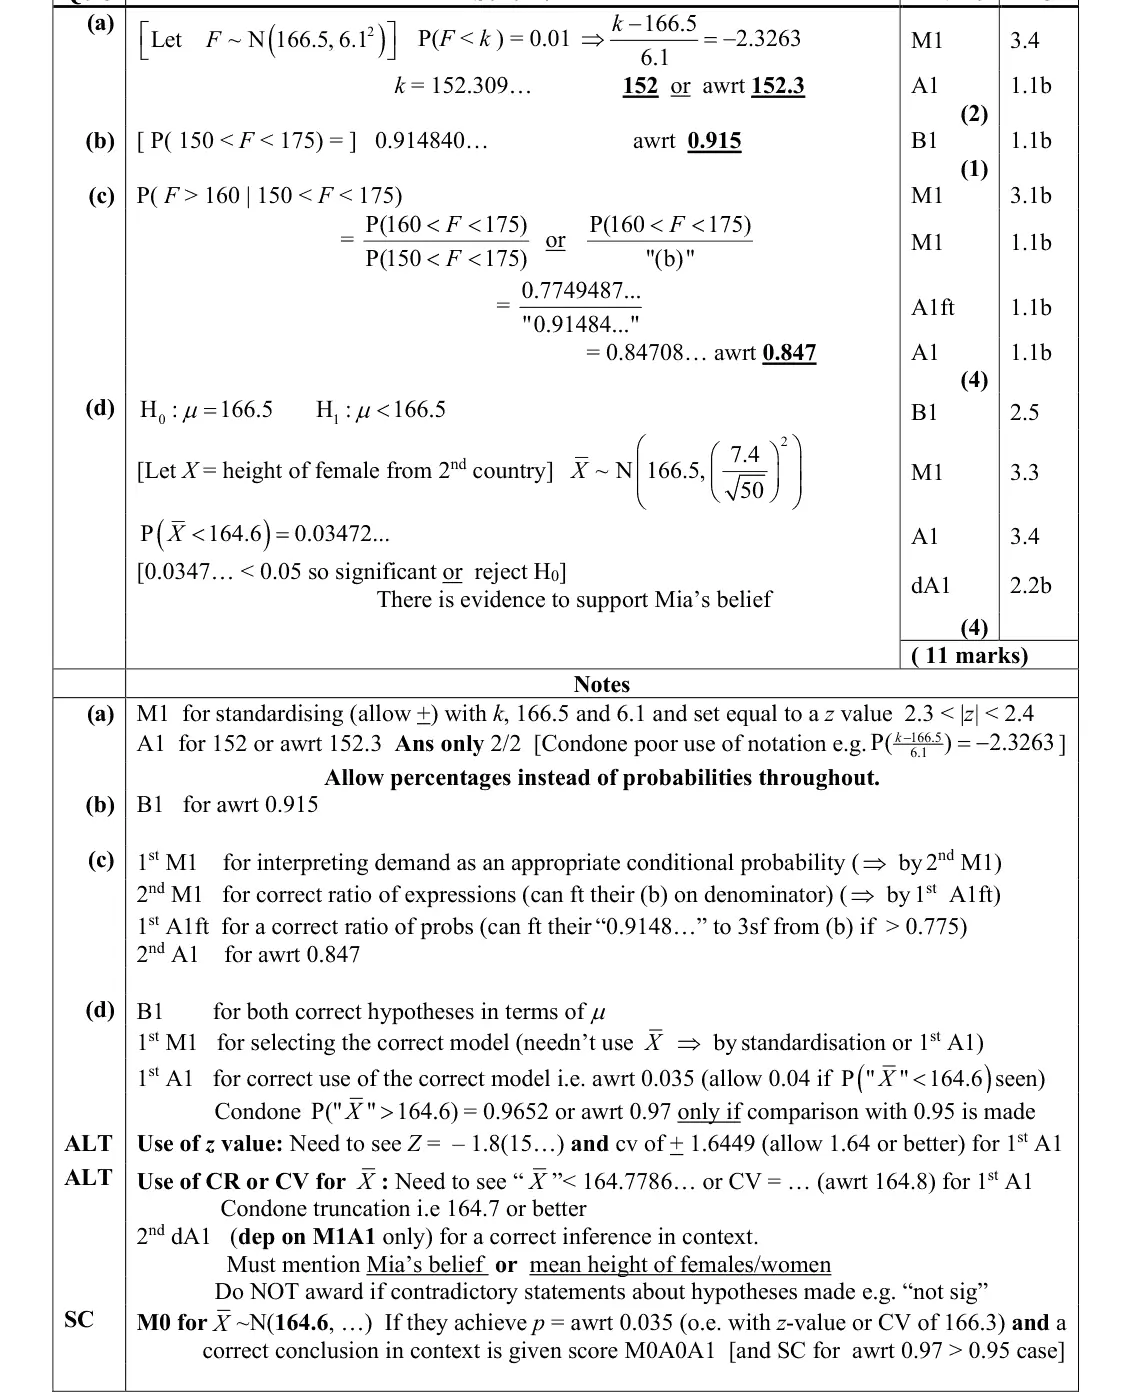
Most students used their calculators in part (a) with reasonable success but a frequent error was to use 0.1 instead of 0.01 and without any working being shown there was no opportunity to award the method mark.
Common mistakes
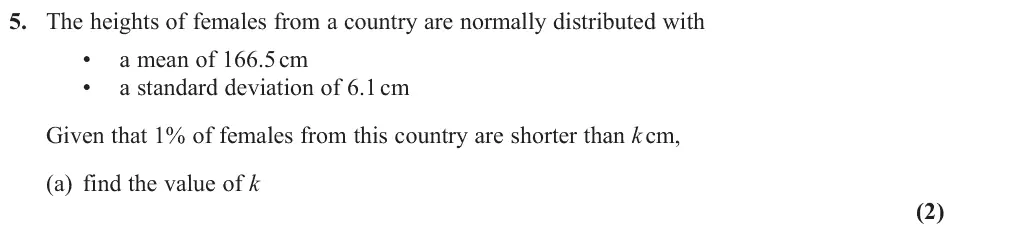
standardise and use z = −2.3263 for 1% (not 0.1)
k = 152.3
show working (calculator-only wrong answers get no method mark)
Oct 2021 · Paper 3 (Statistics) · Q5(b)1 markEasy
Mark scheme (whole question; this part is marked with the orange bar)
Examiner's comment
Part (b) was a straightforward probability calculation designed to be completed on a calculator as the specification requires and so it was disappointing that nearly 25% of the candidates scored no marks at all on this question. Identifying the conditional probability in part (c) defeated many students and some of those
Common mistakes
calculator normal probability P(150 < F < 175) = 0.915
Oct 2021 · Paper 3 (Statistics) · Q5(c)4 marks
Mark scheme (whole question; this part is marked with the orange bar)
Examiner's comment
this question. Identifying the conditional probability in part (c) defeated many students and some of those who seemed to be attempting to use a conditional probability were unable to use the correct notation to write their expression. Those who did start with a correct conditional probability and moved onto a ratio of probabilities often had a correct denominator but a common error was to have P(F > 160) as the numerator rather than P(160 < F < 175). Part (d) was a familiar hypothesis test and many students scored something
Common mistakes
conditional: P(F > 160 given 150 < F < 175) = P(160 < F < 175)/P(150 < F < 175)
numerator is not P(F > 160)
0.847
Oct 2020 · Paper 3 (Statistics) · Q5(a)1 markEasy
Mark scheme (whole question; this part is marked with the orange bar)
Examiner's comment
It was disappointing that over 20% of candidates scored no marks here as there were some straightforward marks available to those who had studied this part of the specification. Part (a) was a very straightforward opening part and the vast majority of students could use their calculator efficiently to score this mark. Part (b) was a fairly rather than the critical value of 1.6669 from the tables. The first part of (c) was another fairly straightforward calculation which many scoring this mark, sometimes including those who failed to score the mark in part (a). Students need to be aware of which “tail” their calculator gives them. Beyond (c) (i) the question was more challenging but it is encouraging that over 50% of students scored some of these first 6 marks.
Common mistakes
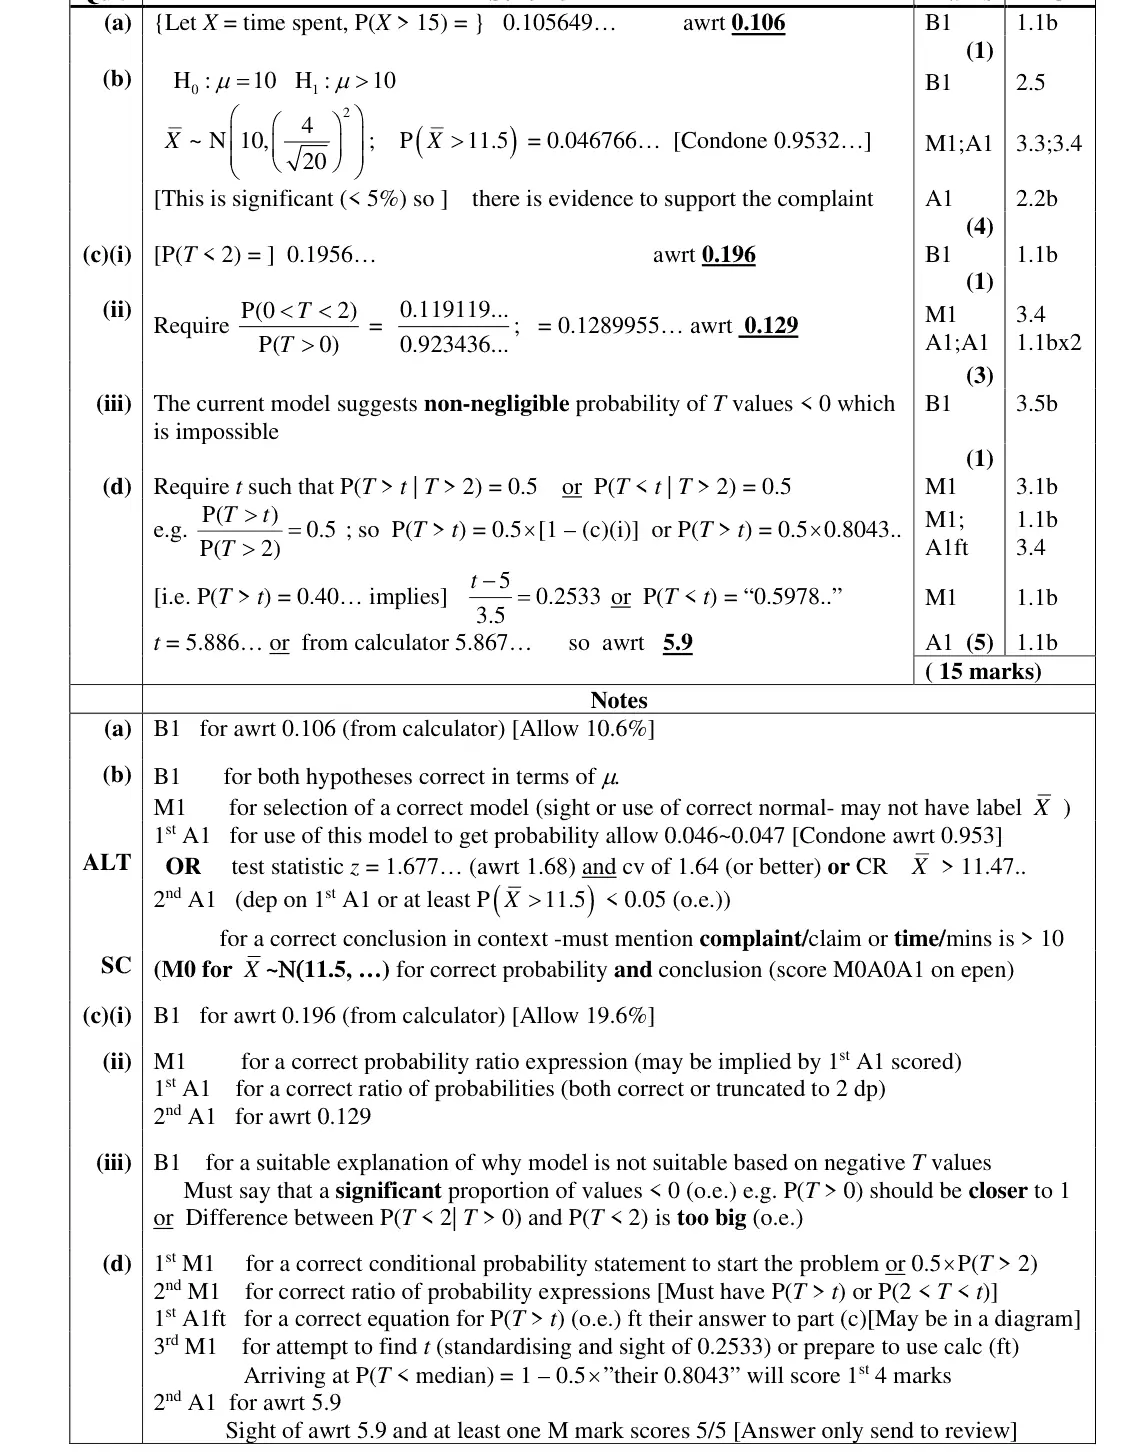
P(X > 15) = 0.106 from calculator
Oct 2020 · Paper 3 (Statistics) · Q5(b)4 marksMedium
Mark scheme (whole question; this part is marked with the orange bar)
Examiner's comment
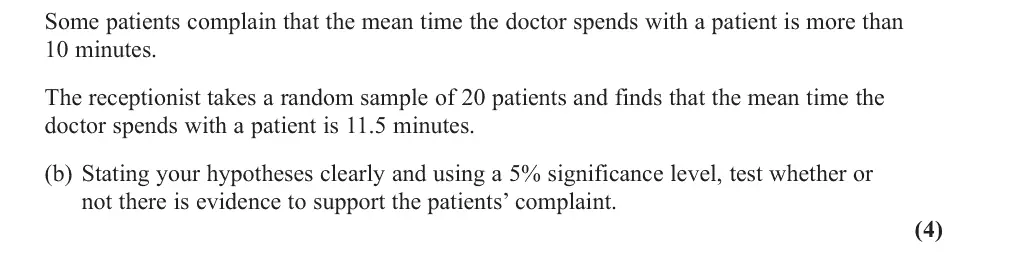
It was disappointing that over 20% of candidates scored no marks here as there were some straightforward marks available to those who had studied this part of the students could use their calculator efficiently to score this mark. Part (b) was a fairly standard hypothesis test and a good number made progress here. Some still did not use 10 T = mu for the hypotheses and a null hypothesis of was all too common. Most attempts used a normal distribution with a correct variance but a significant number of students used a mean of 11.5 rather than 10. This is not a correct method for a hypothesis test (the probabilities should be calculated on the assumption that H0 is true) but, on this occasion, for those who still managed to reach a correct conclusion a special case enabled them to secure one mark. A variety of different approaches were used in part (b), some finding the critical value for X and others calculating the test statistic of 1.677… but some of these candidates compared this value to the significance level rather than the critical value of 1.6669 from the tables. The first part of (c) was another
Common mistakes
hypotheses in terms of μ: H₀: μ = 10, H₁: μ > 10
sample mean ~ N(10, 4²/20) – use μ = 10, not 11.5
P = 0.0468 < 5% (or z = 1.677 > 1.6449)
conclusion in context about the complaint
Oct 2020 · Paper 3 (Statistics) · Q5(c)(i)1 markEasy
Mark scheme (whole question; this part is marked with the orange bar)
Examiner's comment
It was disappointing that over 20% of candidates scored no marks here as there were some straightforward marks available to those who had studied this part of the
Common mistakes
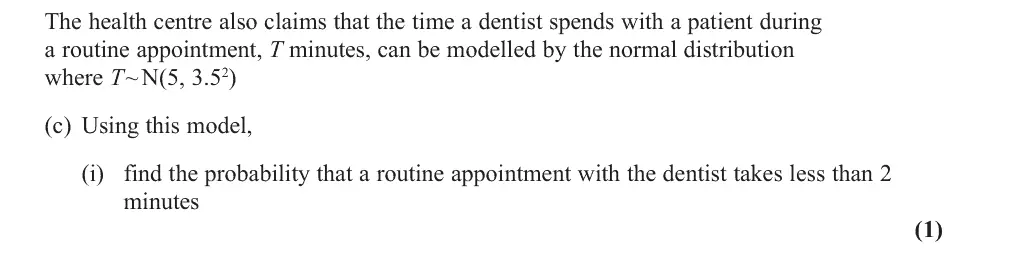
P(T < 2) = 0.196
check which tail the calculator gives
Oct 2020 · Paper 3 (Statistics) · Q5(c)(ii)3 marksMedium
Mark scheme (whole question; this part is marked with the orange bar)
Examiner's comment
It was disappointing that over 20% of candidates scored no marks here as there were some straightforward marks available to those who had studied this part of the In (c)(ii) although a good number of students recognised that a conditional probability was required, few could find a correct expression for the numerator and a common error (c)(i) was to see used rather than a correct numerator of P(0 < T < 2). In part (iii) P( 0) T > many realised that the model would assign some probability to negative values of T but this will always be true when a normal distribution is used as a model. The point here was that a significant proportion of the values for T were negative and so this means that the normal model is not very good. Most responses seemed to believe that a model must match reality exactly but a few did comment that P(T > 0) should be closer to 1 or that the difference between (i) and (ii) was too big and therefore the model was not a good one to use. Fully correct answers to part (d) were rare and this part gave the A* students an
Common mistakes
numerator is P(0 < T < 2), not P(T < 2)
divide by P(T > 0) = 0.923
0.129
Oct 2020 · Paper 3 (Statistics) · Q5(c)(iii)1 markEasy
Mark scheme (whole question; this part is marked with the orange bar)
Examiner's comment
It was disappointing that over 20% of candidates scored no marks here as there were some straightforward marks available to those who had studied this part of the
Common mistakes
a significant (non-negligible) probability of T < 0, which is impossible
just "can be negative" is not enough as this is true of any normal model
Oct 2020 · Paper 3 (Statistics) · Q5(d)5 marksMedium
Mark scheme (whole question; this part is marked with the orange bar)
Examiner's comment
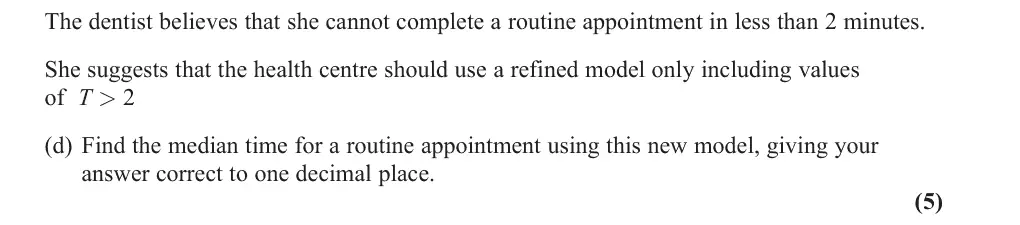
It was disappointing that over 20% of candidates scored no marks here as there were some straightforward marks available to those who had studied this part of the Fully correct answers to part (d) were rare and this part gave the A* students an opportunity to shine. Successful students realised that they needed to look at P(T > 2) and often found this by taking 1 – (c)(i) but they rarely realised that the median splits this probability into 2 so they were seeking the value of t such that P(T > t) = 0.40…Some who reached this stage tried, incorrectly to use their calculator, failing to realise that their calculator gave t for probabilities of the form P(T < t), a few used the tables provided to find z = 0.2533 and some did prepare correctly to use their calculator and found P(T < t ) = 0.5978… (the 0.402… + (c)(i)) from whence the correct value of t = 5.9 could be found. It was encouraging to see some good use of diagrams in this question being used to help students identify which probabilities they needed.
Common mistakes
need P(T > t given T > 2) = 0.5, so P(T > t) = 0.5 × 0.8043 = 0.402
the calculator gives P(T < t), so use P(T < t) = 0.598 or z = 0.2533
median 5.9
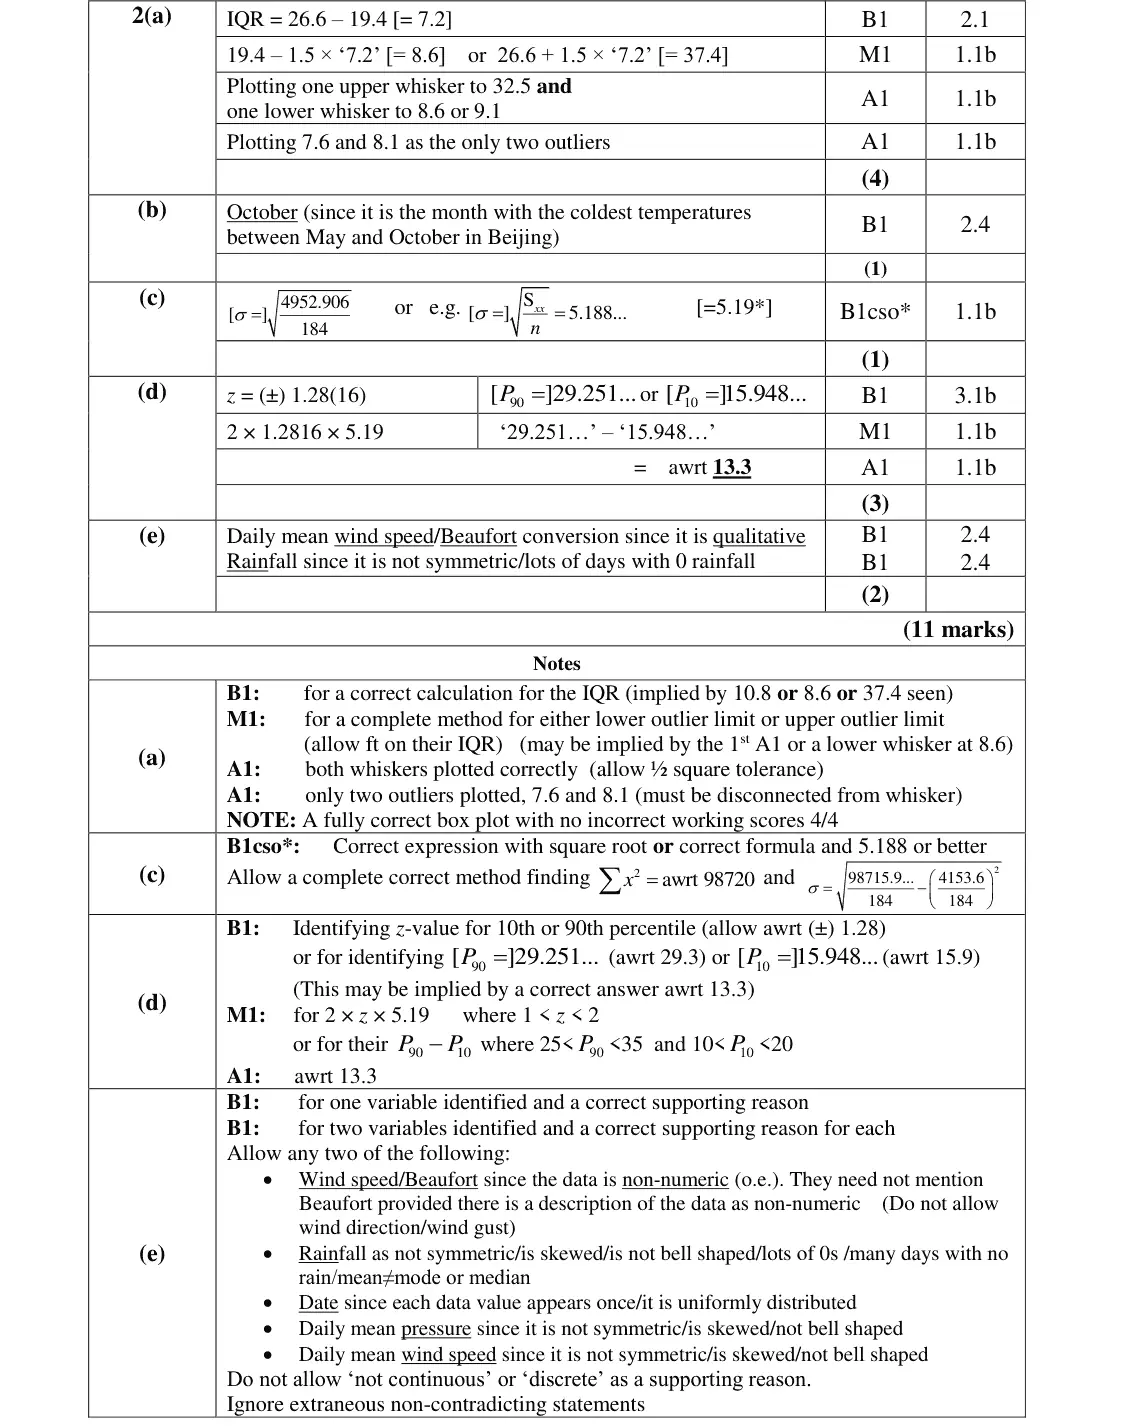
June 2019 · Paper 3 (Statistics) · Q2(d)3 marks
Mark scheme (whole question; this part is marked with the orange bar)
Examiner's comment
Parts (a), (c) were well attempted by most candidates with part (d) being tackled by more able candidates. Parts (b) and (e) were a problem for those less familiar with the large data set. The most popular approach in part (d) here seemed to be use of the inverse Normal function on a calculator to find the 10th and 90th percentiles. This was usually successful although many candidates then went no further, hence gaining only the first mark. It was evident that some were not aware of what was meant by interpercentile range; it was not understood that the difference needed to be found (as when finding IQR), some stating a range for x as an inequality (e.g. 15.9 ) with others instead reaching a probability answer of 0.8. Of those 29.3 x continuing to find the IPR some had prematurely rounded both percentile values to 3 significant figures before subtraction, leading to 13.4 as an inaccurate final answer. Candidates need to be encouraged to work with accurate figures, only rounding their final answer. Fewer candidates used the more ‘traditional’ (and longer) approach of standardisation to obtain the percentiles needed, although this was often done successfully.
the range is a difference, not an inequality or 0.8
rounding percentiles early gives 13.4
June 2019 · Paper 3 (Statistics) · Q2(e)2 marks
Mark scheme (whole question; this part is marked with the orange bar)
Examiner's comment
candidates. Parts (b) and (e) were a problem for those less familiar with the large data set. Part (e) was very poorly done with only a handful of candidates scoring marks here. Depth of familiarity was lacking by many candidates. Some misunderstood the question entirely and cited the conditions for a Normal being a suitable approximation to a Binomial. Others thought this part was related to the variable under study and suggested the Normal was not suitable for modelling air temperature for a variety of reasons including the skew on the box plot. Those who did suggest two other variables from the LDS rarely gave acceptable reasons for their choice; some gave no reasons at all even when their choice was a suitable one. The use of the Beaufort scale for wind speed was mentioned but it was wrongly said to be discrete with only a few saying that it was non-numeric. Wind direction which was non-numeric was quite often seen but was not an acceptable answer. Some other wrong reasons were: the data is non- uniform, the values are too variable; it is not possible to have values below 0. The most commonly suggested variable was cloud cover, presumably because it was used as the basis for Q4 and possibly because it appeared in last summer’s 8MA02
Common mistakes
rainfall (skewed, many days of 0), wind speed Beaufort (non-numeric), pressure, date (uniform)
"discrete" or "not continuous" not accepted
wind direction not accepted
normal-approximation-to-binomial conditions are irrelevant
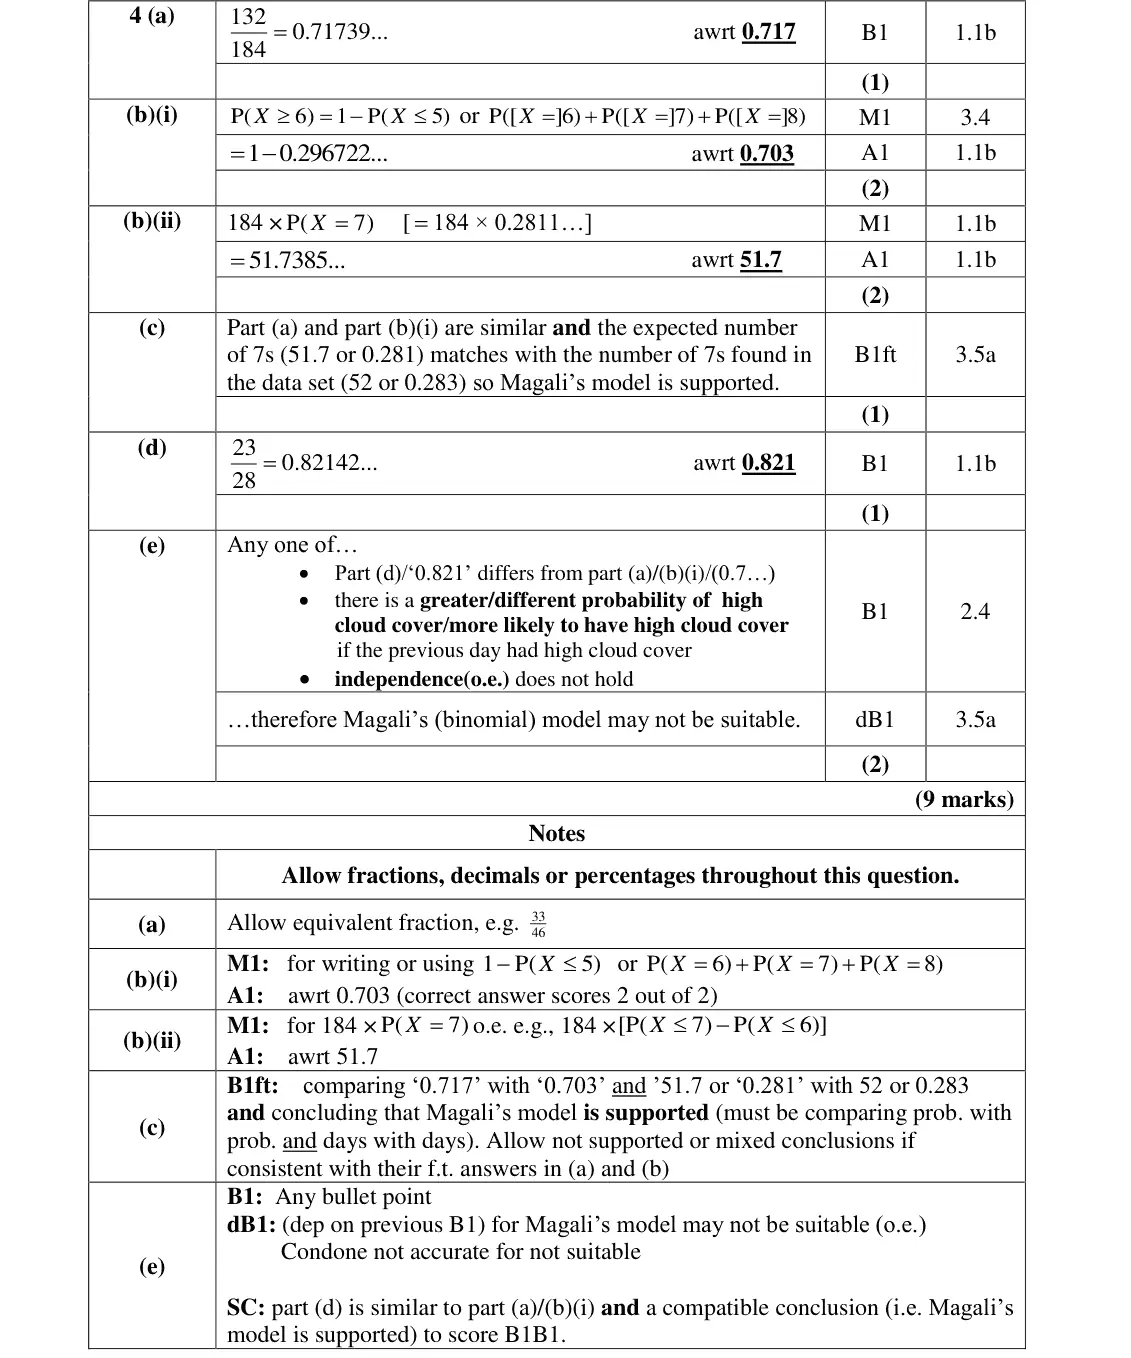
June 2019 · Paper 3 (Statistics) · Q4(c)1 mark
Mark scheme (whole question; this part is marked with the orange bar)
Examiner's comment
This question demonstrated that most candidates are confident in carrying out statistical calculations, particularly probabilities, but only the most able are confident in interpreting in Part (c) was not particularly well attempted by candidates with many leaving it out completely. Where there was a clear attempt those failing to score the mark usually only compared one set of the values, generally the 51.7 and the 52. Most who attempted part (d) scored the mark.
Common mistakes
compare 0.717 with 0.703 and 51.7 with 52 (probability with probability, days with days) and conclude the model is supported
comparing only one pair
June 2019 · Paper 3 (Statistics) · Q4(e)2 marks
Mark scheme (whole question; this part is marked with the orange bar)
Examiner's comment
This question demonstrated that most candidates are confident in carrying out statistical calculations, particularly probabilities, but only the most able are confident in interpreting in Part (e) was the least successfully answered part of the question with lots of blanks seen. Where candidates scored the 2 marks it was usually through stating that if there had been cloud cover the day before there was a higher chance of cloud cover the next day. Those going completely down the wrong route failed to realise that the data was from the same source and were mostly commenting on the size of the sample rather than what the statistics already demonstrated. In general there was far too much tendency to describe vague contextual knowledge rather than use the figures found previously. Of those who did try and compare figures an error often seen was to compare the result in (d) to 0.76. The failure to focus on the fact that the model was
Common mistakes
0.821 is higher than 0.717 – high cloud cover is more likely after a day of high cover, so independence fails and the binomial model may not be suitable
comparing with 0.76 or commenting on sample size is wrong
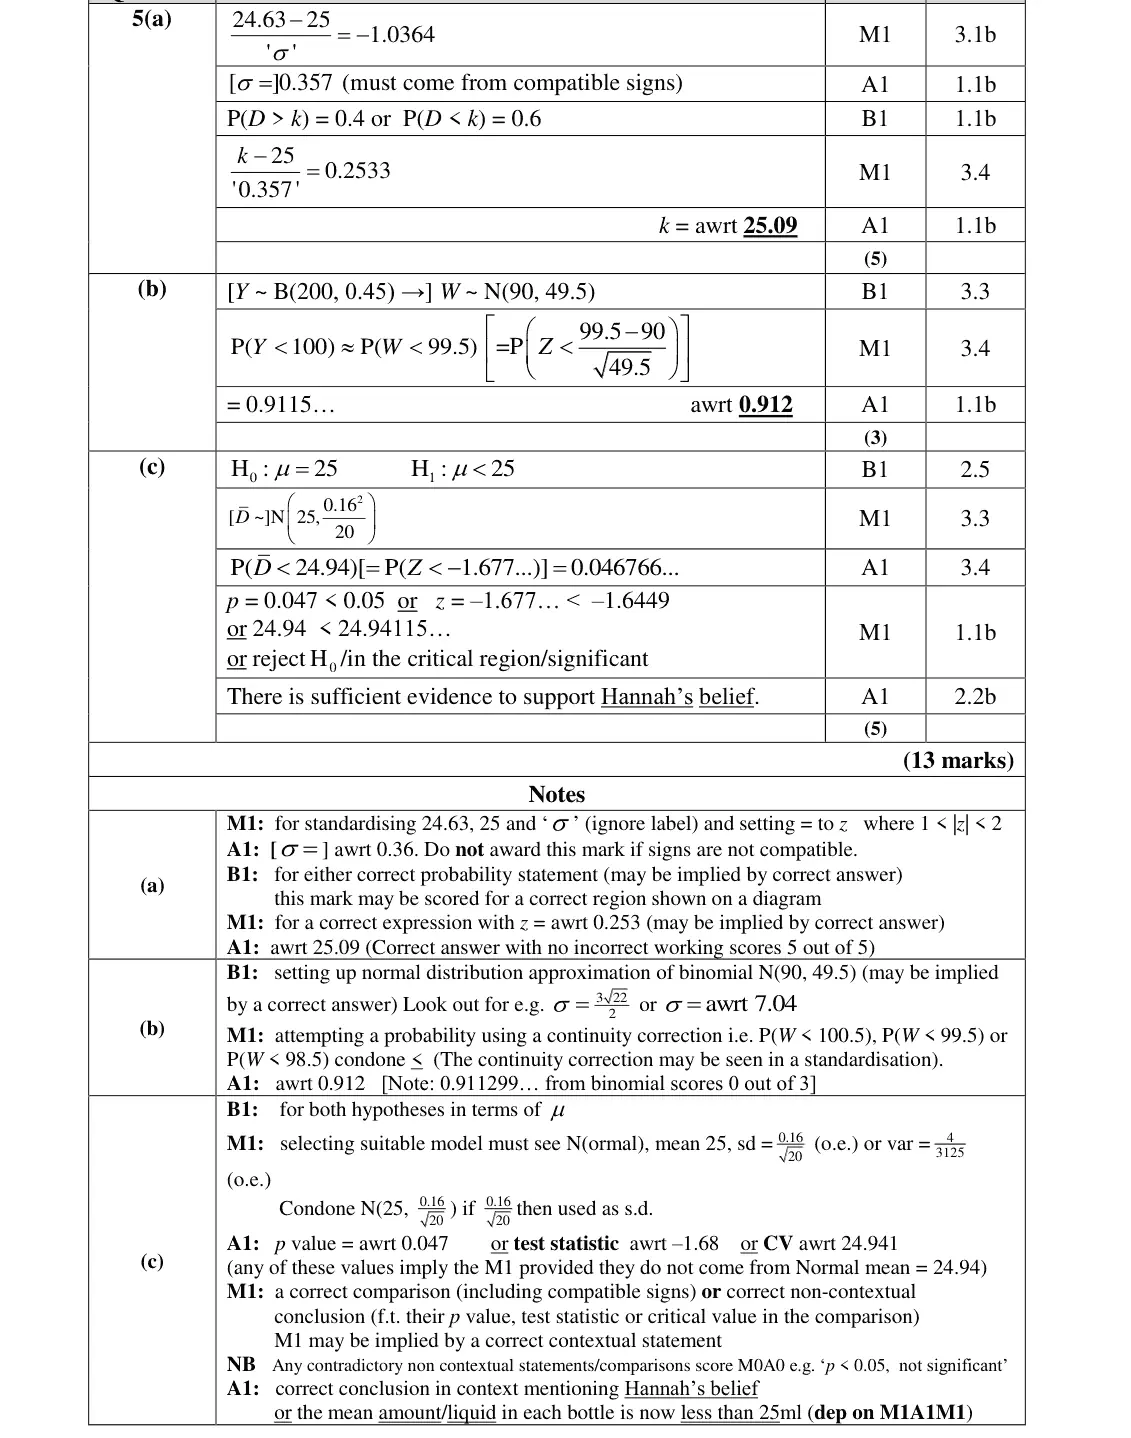
June 2019 · Paper 3 (Statistics) · Q5(a)5 marks
Mark scheme (whole question; this part is marked with the orange bar)
Examiner's comment
This question as whole proved to be one of the more challenging questions on the paper with many candidates unable to make any meaningful attempt at any part of the question. In part (a) candidates struggled to come up with a complete strategy to answer this multi-step question. Some candidates were unable to use the given information to find the missing standard deviation. Although many realised that they needed to standardise, they incorrectly used the given probability rather than the associated z-value. Many of the candidates who found the correct standard deviation went on to give a correct answer although a significant number then made mistakes manipulating the probability statements and therefore failed to score after this. Candidates should be reminded of the benefits of drawing a diagram that would have helped in this part. It is worth noting that many candidates showed very little method once they had calculated the standard deviation, this meant that candidates who had an incorrect answer often lost 3 marks. With increased reliance on the calculator the use of diagrams and probability statements are essential to demonstrate what methods are being used. Candidates also need to get into the habit of checking their answers for example by substituting their answers into the original question. Although most candidates gave their answer to 2 decimal places, as requested, some gave answers to a smaller degree of accuracy.
Common mistakes
standardise with the z-value: (24.63 − 25)/σ = −1.0364, σ = 0.357
P(D < k) = 0.6 so z = 0.2533, k = 25.09
using the probability instead of z
draw a diagram
June 2019 · Paper 3 (Statistics) · Q5(b)3 marks
Mark scheme (whole question; this part is marked with the orange bar)
Examiner's comment
This question as whole proved to be one of the more challenging questions on the paper with many candidates unable to make any meaningful attempt at any part of the question. Part (b) was one of the most discriminating parts of the entire paper. There were a range of errors seen. Many failed to set up the correct Normal approximation and many tried to use the model found in part (a). Some appeared to struggle with the phrase ‘fewer than half’. It was also quite common to see candidates ignore the request for an approximation and complete the question using the binomial distribution given in the question. Candidates need to be aware that they will not be awarded marks for using the binomial distribution to calculate a probability if they have been asked to use an approximation. Candidates who did manage to set up the correct Normal distribution often made errors with the continuity correction, either they made no attempt to use one or they used one in the wrong direction.
Common mistakes
Y ~ B(200, 0.45) approximated by N(90, 49.5)
fewer than half: P(W < 99.5) = 0.912 with continuity correction
an exact binomial answer scores 0
do not reuse the model from (a)
June 2018 · Paper 3 · Q1(c)1 mark
Mark scheme (whole question; this part is marked with the orange bar)
Examiner's comment
part (c) but responses to part (d) were poor. This question required students to suggest a refinement to Helen’s model and most answers lacked the detail required for the mark.
Common mistakes
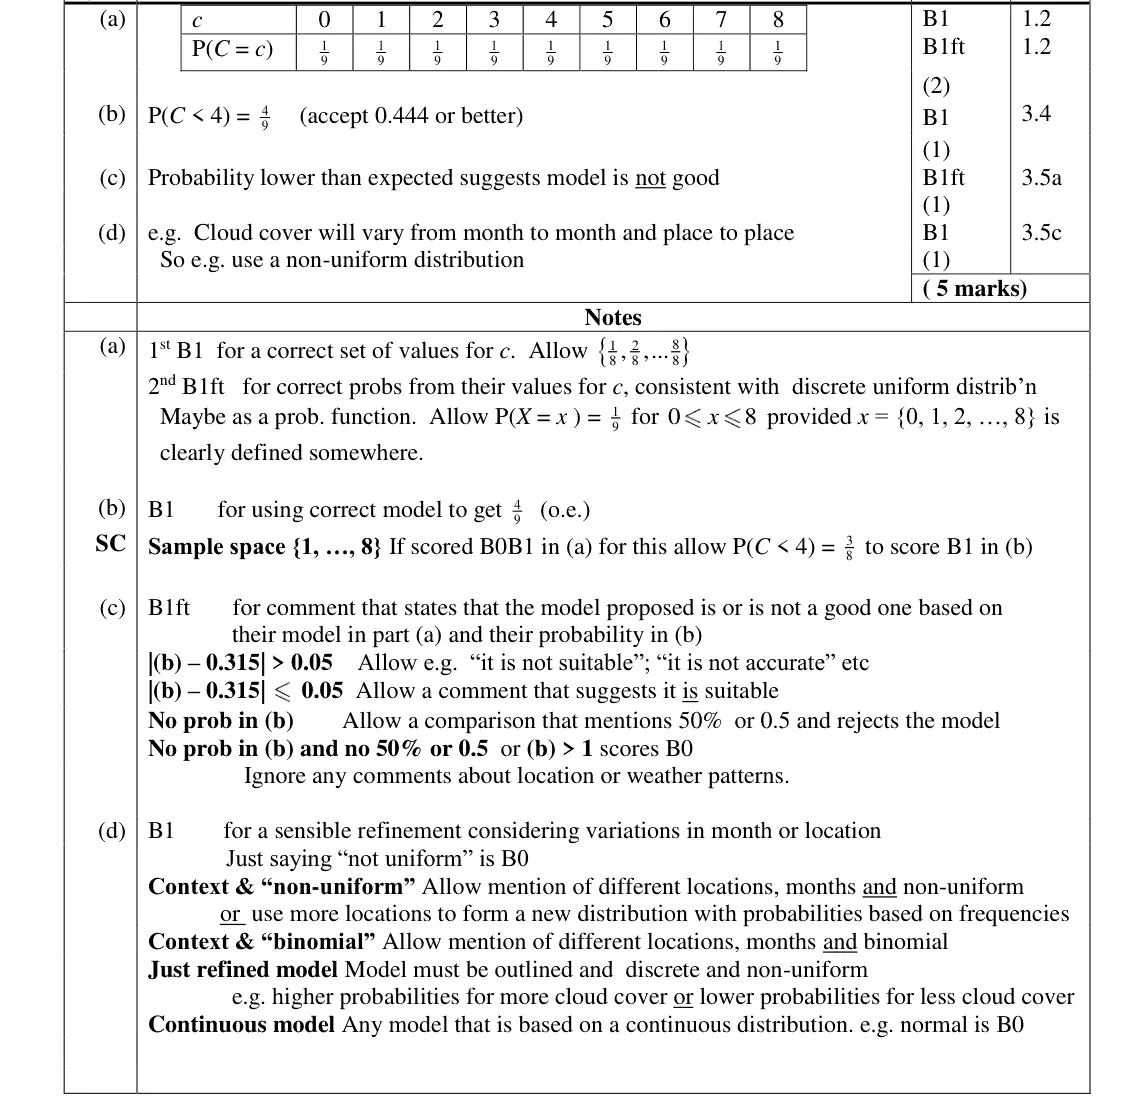
compare 0.315 with 4/9: observed proportion is lower, so the uniform model is not good
comment must be based on their (b)
June 2018 · Paper 3 · Q1(d)1 mark
Mark scheme (whole question; this part is marked with the orange bar)
Examiner's comment
part (c) but responses to part (d) were poor. This question required students to suggest a refinement to Helen’s model and most answers lacked the detail required for the mark.
Common mistakes
just saying "not uniform" is B0
refinement must use variation by month or location (e.g. a non-uniform distribution with probabilities from frequencies)
a continuous model such as normal is B0
most answers lacked detail
June 2018 · Paper 3 · Q3(a)2 marks
Mark scheme (whole question; this part is marked with the orange bar)
Examiner's comment
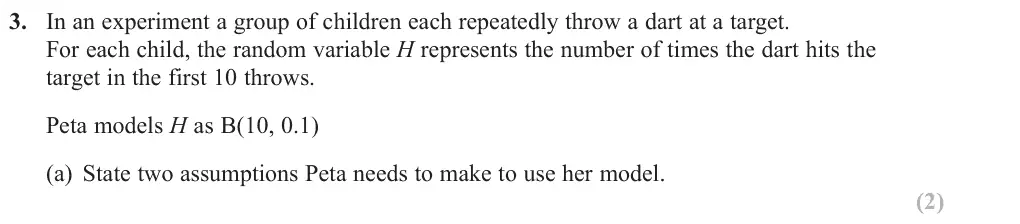
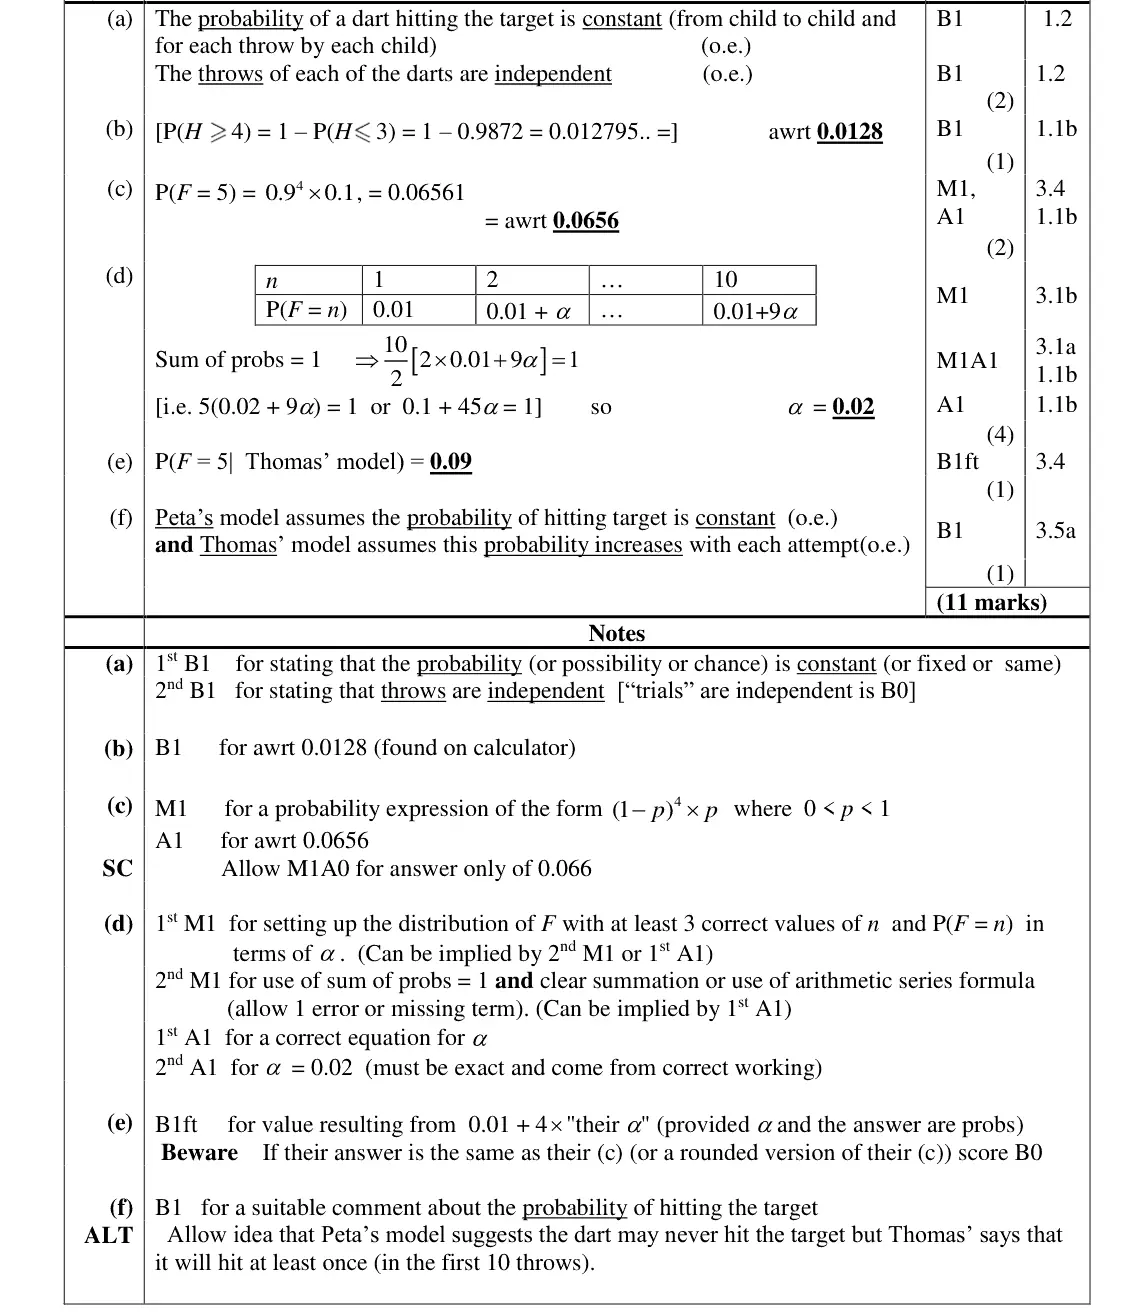
In part (a), we would expect answers to use the context and although many stated that Peta assumes that the probability of hitting the target is constant most did not mention that the throws of the dart had to be independent too, many simply referring to just “trials”.
Common mistakes
probability of hitting is constant and throws are independent, in context
"trials are independent" is B0
many omitted independence
June 2018 · Paper 3 · Q5(a)1 mark
Mark scheme (whole question; this part is marked with the orange bar)
Examiner's comment
Whilst parts (a) and (d) were often answered well, parts (b) and (c) proved much more challenging and only the strongest 10% made significant progress here. Part (a) was answered well and most students knew they needed to use their calculators to answer it and did so correctly. Those who identified that a conditional probability was required in part (b) were often able to make progress,
Common mistakes
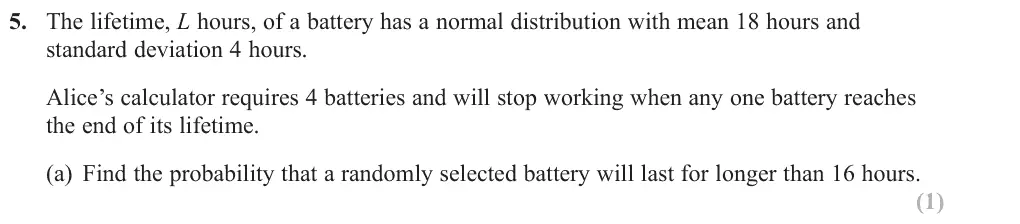
P(L > 16) = 0.691 by calculator
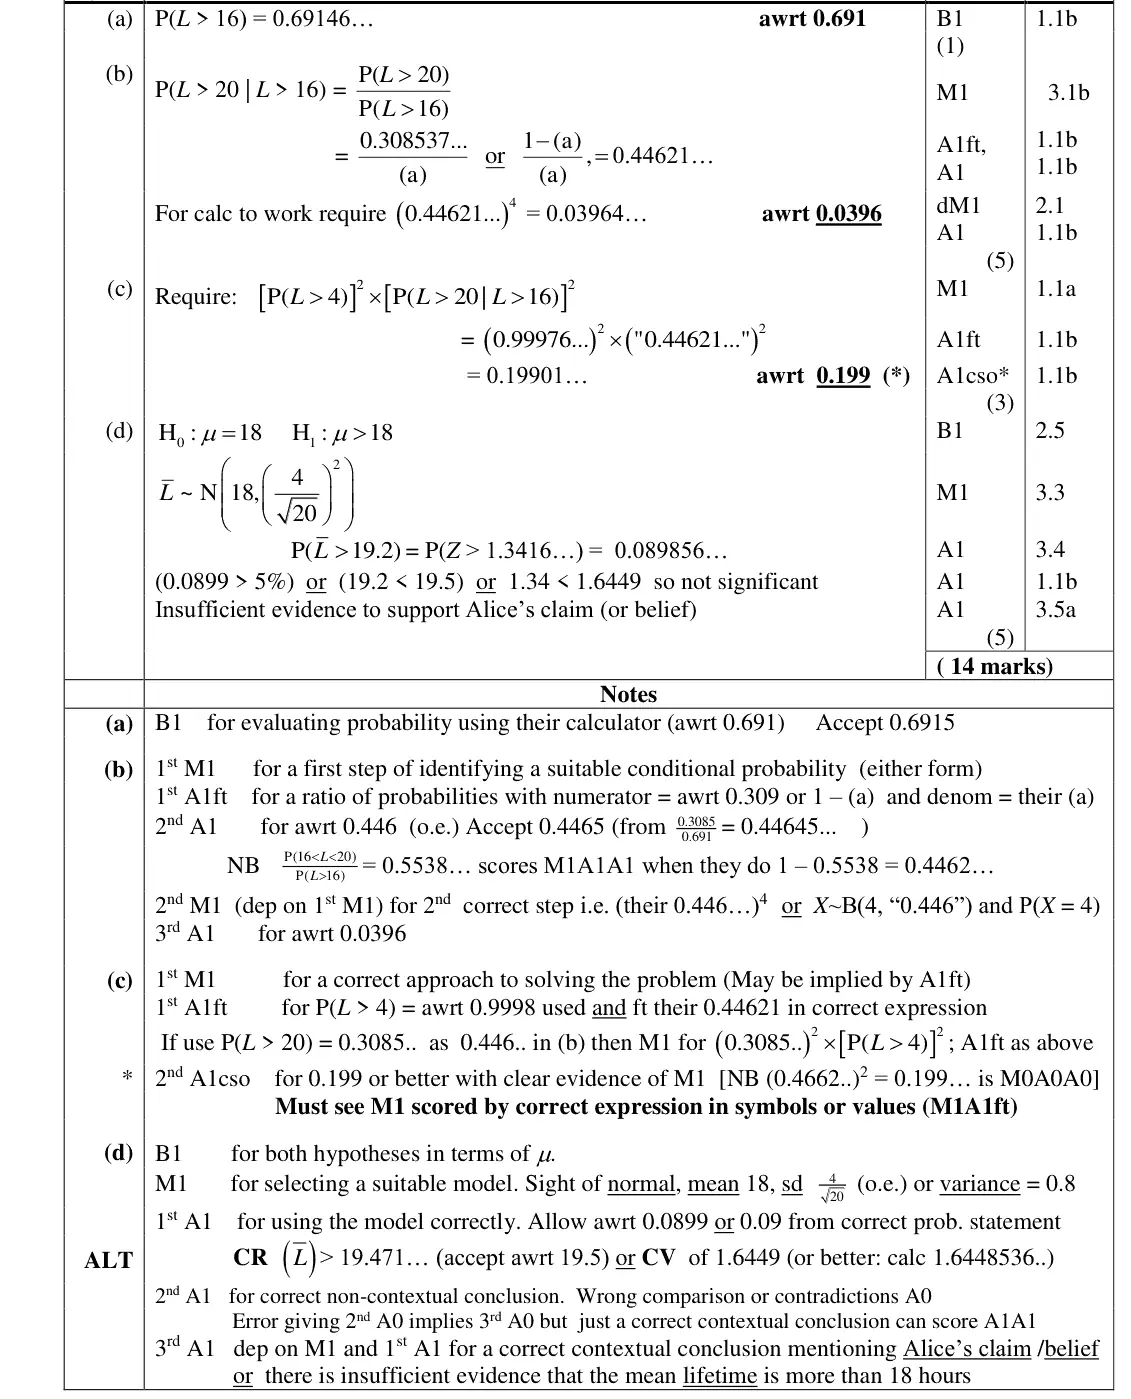
June 2018 · Paper 3 · Q5(b)5 marks
Mark scheme (whole question; this part is marked with the orange bar)
Examiner's comment
Whilst parts (a) and (d) were often answered well, parts (b) and (c) proved much more challenging and only the strongest 10% made significant progress here. Part (a) was answered well and most identified that a conditional probability was required in part (b) were often able to make progress, often obtaining the probability of 0.4462 and using that correctly to complete part (b) and make progress in (c).
Common mistakes
conditional probability P(L > 20 given L > 16) = 0.3085/0.6915 = 0.446
then all 4 batteries independent: 0.446⁴ = 0.0396
many missed the conditional step
June 2018 · Paper 3 · Q5(c)3 marks
Mark scheme (whole question; this part is marked with the orange bar)
Examiner's comment
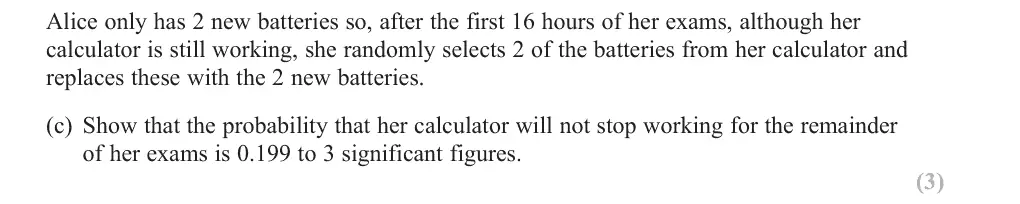
Whilst parts (a) and (d) were often answered well, parts (b) and (c) proved much more challenging and only the strongest 10% made significant progress here. Part (a) was answered well and most progress in (c). In part (c), some simply squared their probability of 0.4462 without realising the need to consider the two new batteries as well. Part (d) was often answered quite well with many stating the hypotheses
Common mistakes
two new batteries need P(L > 4)² = 0.9998² and two old ones 0.446²
squaring 0.446 alone is M0
correct expression must be seen for the given answer
June 2018 · Paper 3 · Q5(d)5 marksEasy
Mark scheme (whole question; this part is marked with the orange bar)
Examiner's comment
Whilst parts (a) and (d) were often answered well, parts (b) and (c) proved much more challenging and only the strongest 10% made significant progress here. Part (a) was answered well and most two new batteries as well. Part (d) was often answered quite well with many stating the hypotheses correctly and identifying the correct model. Most calculated the appropriate probability correctly and many gave their solution in context too. SECTION B: MECHANICS Introduction Overall the quality of the scripts seemed very mixed with some clear and entirely correct solutions but a substantial number were well below standard, particularly for Question 9 and Question 10. There may have been some evidence of time being a limiting factor as some Question 10 answers seemed rushed or unfinished, although it is difficult to be sure whether time or ability was the main issue here. Question 7 was the best answered with 54% of the students scoring full marks, closely followed by question 6 where 55% of students scored full marks. Question 9 was by far the most challenging where the modal mark was zero and just under half the students scored 6, or fewer, out of 13. In calculations the numerical value of g which should be used is 9.8 unless otherwise stated. Final answers should then be given to 2 (or 3) significant figures – more accurate answers will be penalised, including fractions but exact multiples of g are usually accepted. If there is a printed answer to show then students need to ensure that they show sufficient detail in their working to warrant being awarded all of the marks available. In all cases, as stated on the front of the question paper, students should show sufficient working to make their methods clear to the examiner and correct answers without working may not score all, or indeed, any of the marks available. If a student runs out of space in which to give his/her answer than he/she is advised to use a supplementary sheet.
Common mistakes
H0: μ = 18, H1: μ > 18 (in terms of μ)
sample mean ~ N(18, 4²/20)
P(mean > 19.2) = 0.0899 > 0.05 (or CR mean > 19.5, z = 1.34 < 1.6449)
not significant, insufficient evidence for Alice's belief, in context
Find an Edexcel maths tutor
Stuck on this? Book a trial session with an Edexcel specialist.