Understand and use simple, discrete probability distributions (calculation of mean and variance of discrete random variables is excluded), including the binomial distribution, as a model; calculate probabilities using the binomial distribution.
Guidance
Students will be expected to use distributions to model a real-world situation and to comment critically on the appropriateness. Students should know and be able to identify the discrete uniform distribution. The notation X∼ B(n, p) may be used. Use of a calculator to find individual or cumulative binomial probabilities.
Mark scheme (whole question; this part is marked with the orange bar)
Examiner's comment
Students were able to find a probability using the Binomial distribution and part (a) and part
Common mistakes
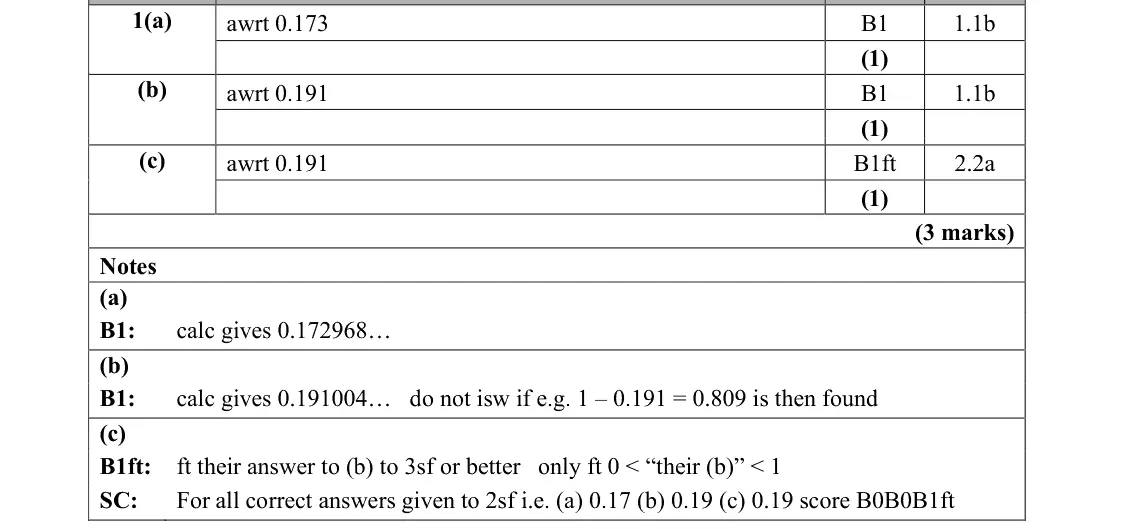
calculator binomial pdf gives 0.172968...
answer to at least 3 s.f. (2 s.f. answers lose the mark)
June 2025 · AS Paper 2 (Statistics) · Q1(b)1 mark
Mark scheme (whole question; this part is marked with the orange bar)
Examiner's comment
(b) were answered very well. Students sometimes lost marks for not giving an answer to at least three significant figures. Even though there was a Special Case on the mark scheme, not many students picked up this mark as they had incorrectly answered part (c).
Common mistakes
cumulative P(X ≤ 5) = 0.191
do not go on to 1 − 0.191
give 3 s.f.
June 2025 · AS Paper 2 (Statistics) · Q1(c)1 mark
Mark scheme (whole question; this part is marked with the orange bar)
Examiner's comment
many students picked up this mark as they had incorrectly answered part (c). Part (c) was not answered well. Students failed to understand that an integer value is needed for the use of Binomial distribution and their calculator did not give them an answer when 5.7 was used. Often students said the answer was not possible or they did not attempt it. For those students who understood that it needed to be an integer, they often incorrectly found P(X <= 6) rather P(X <= 5), or used interpolation to arrive at an answer in between these values.
Common mistakes
X is discrete (integer values only) so P(X ≤ 5.7) = P(X ≤ 5) = 0.191
common errors: saying it is not possible, using P(X ≤ 6), or interpolating between 5 and 6
June 2025 · AS Paper 2 (Statistics) · Q3(a)3 marks
Mark scheme (whole question; this part is marked with the orange bar)
Examiner's comment
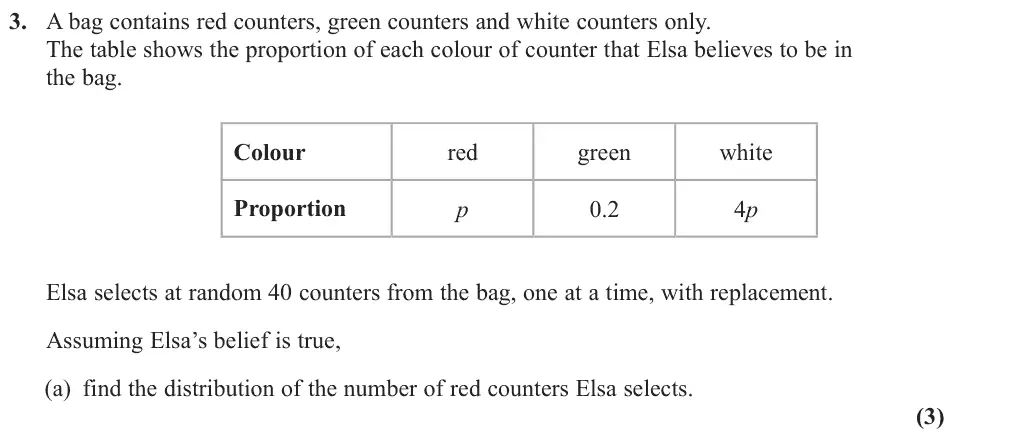
Most students found p = 0.16 easily but then they did not make the connection that they needed to state the full distribution. A common misunderstanding was to use the probabilities to calculate the expected number of counters of each colour in a sample of 40.
Common mistakes
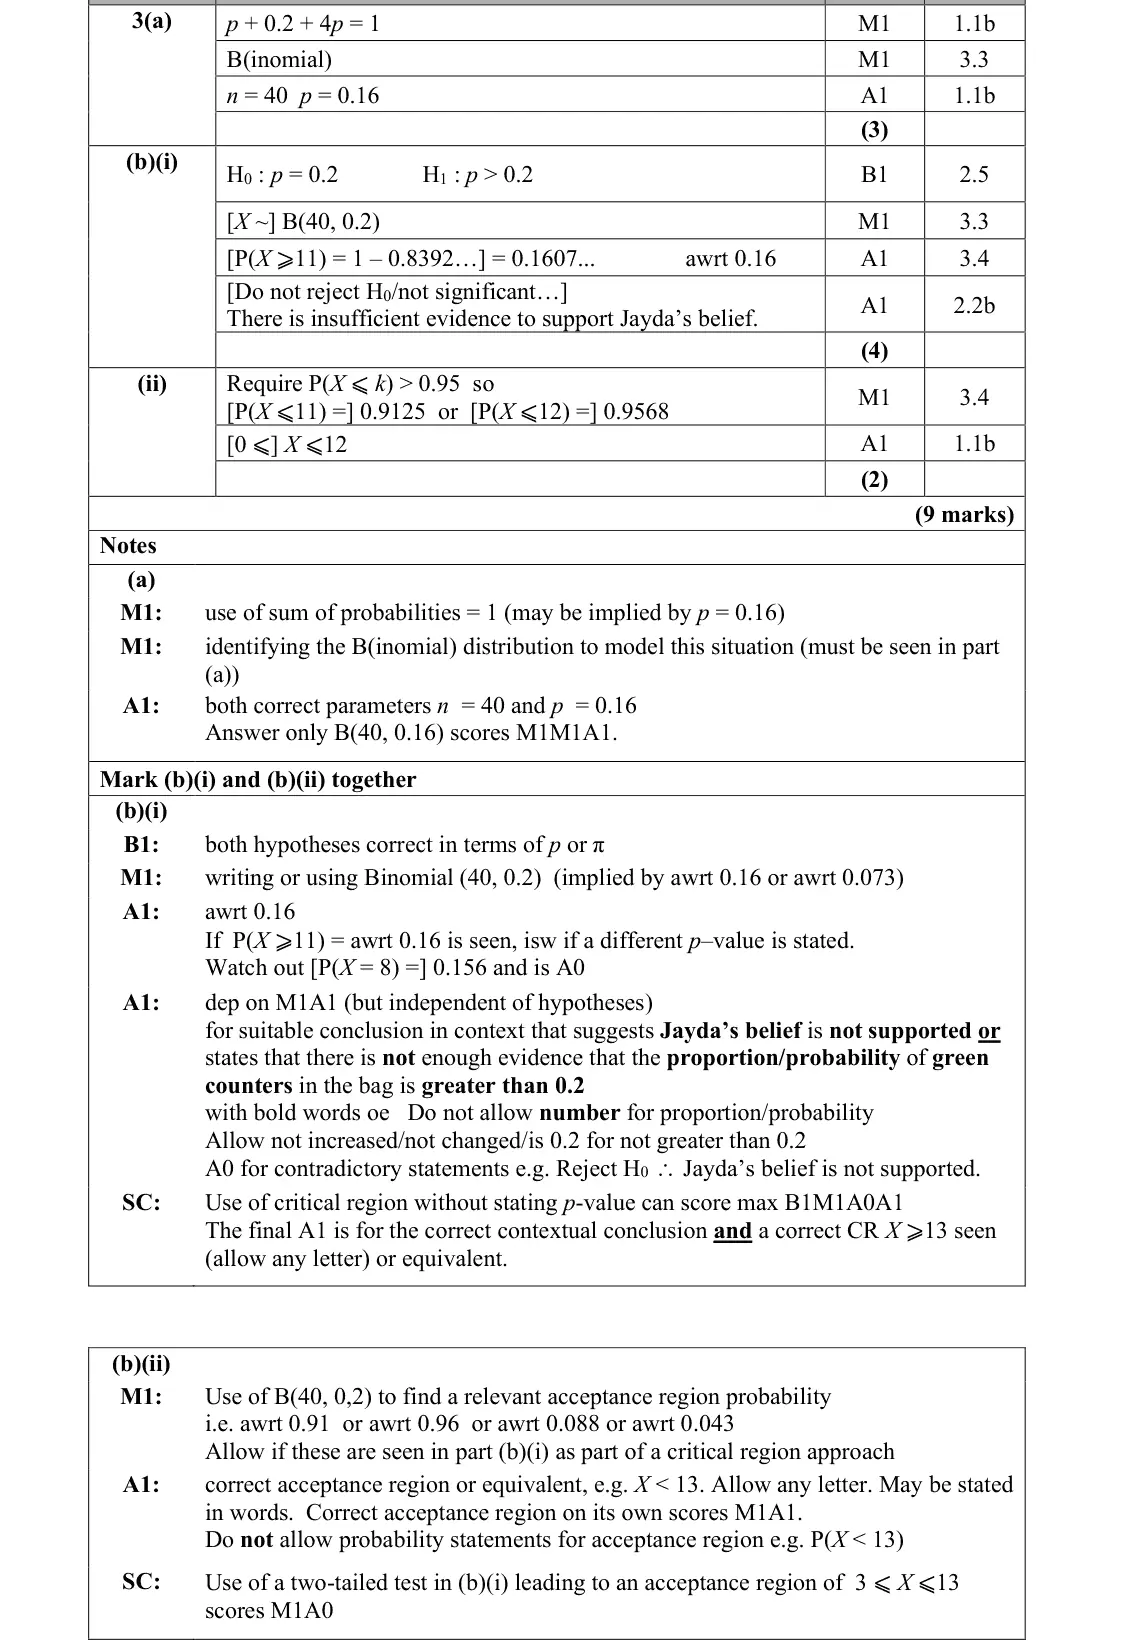
p + 0.2 + 4p = 1 gives p = 0.16
must state the full distribution B(40, 0.16), not just p or expected numbers of each colour
June 2025 · AS Paper 2 (Statistics) · Q3(b)(i)4 marks
Mark scheme (whole question; this part is marked with the orange bar)
Examiner's comment
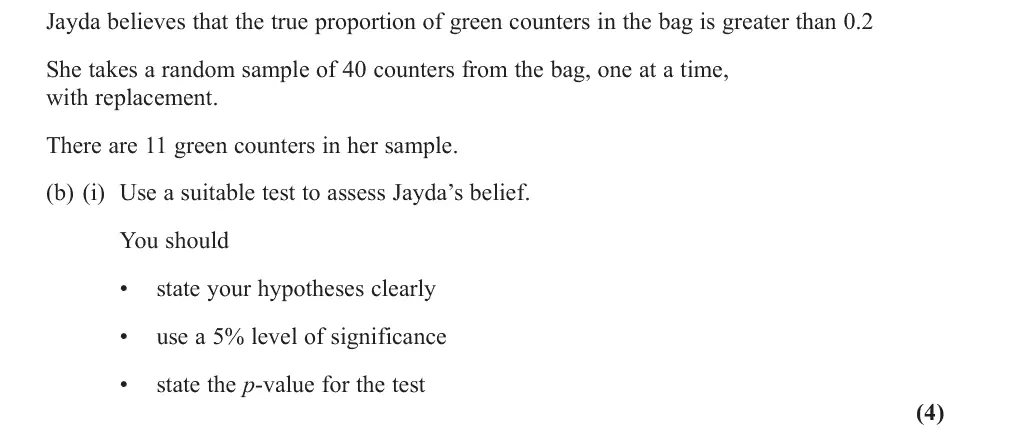
In (b)(i) the hypotheses were usually correctly stated with most students using a one-tailed test. On some occasions students are writing these hypotheses in words rather than using appropriate notation. Most students were able to select and use the correct Binomial distribution. Many, however, then calculated P(X = 11) or incorrectly attempted P(X >= 11) = 1 – P(X <= 11). Of the students who gained the A mark for the probability 0.16, the conclusion was usually correct and mostly given in sufficient contextual detail. Those students who used a critical region approach generally did less well, as most omitted the required p-value and scored a maximum of 3 marks. relevant probabilities at some point in part (b). A few students gave a probability rather than a region as their final answer here.
Common mistakes
H0: p = 0.2, H1: p > 0.2 in terms of p (not words)
do not reject H0, insufficient evidence for Jayda's belief, in context
a critical-region approach without the p-value scores at most 3
June 2025 · AS Paper 2 (Statistics) · Q3(b)(ii)2 marks
Mark scheme (whole question; this part is marked with the orange bar)
Examiner's comment
In (b)(ii) students appeared unfamiliar with the vocabulary ‘acceptance region’. A very common mistake was an attempt to find the critical region. It was not uncommon to see P(X <= 12 ) = 0.9568 followed by an acceptance region of X >= 13. Those who did realise that the acceptance region was not the same as the critical region often reverted to a 2-tailed approach. Students were able to earn the method mark here by calculating one or more relevant probabilities at some point in part (b). A few students gave a probability rather than a
Common mistakes
acceptance region is the complement of the critical region: P(X ≤ 12) = 0.9568 > 0.95 so 0 ≤ X ≤ 12
common errors: giving the critical region X ≥ 13, switching to a two-tailed test, giving a probability statement instead of a region
June 2025 · Paper 3 (Statistics) · Q3(a)3 marks
Mark scheme (whole question; this part is marked with the orange bar)
Examiner's comment
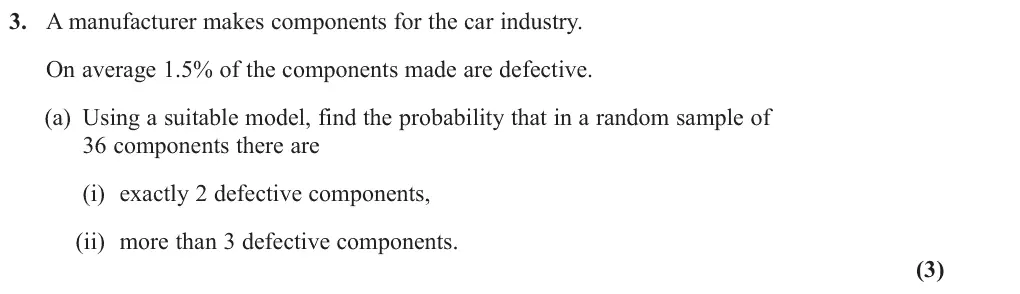
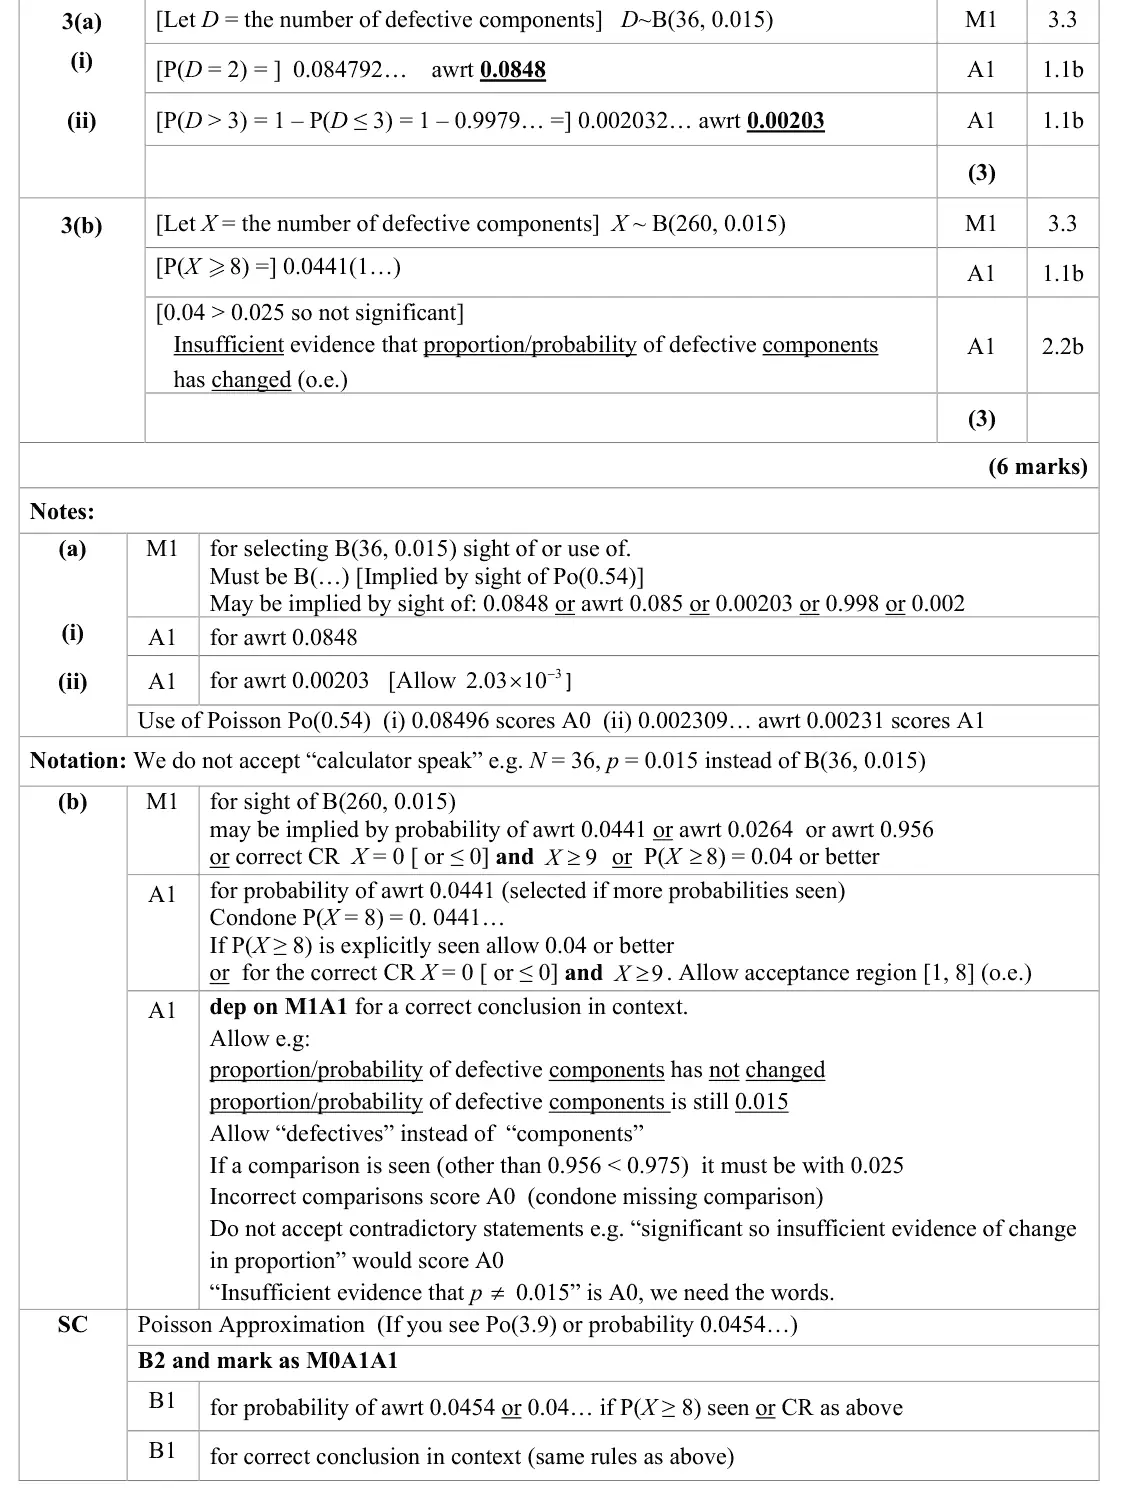
Part (a) was usually answered well. Some explicitly stated the correct model but others achieved this mark by giving one of the correct probabilities though accuracy marks were often not gained as a number of responses truncated in (i) to give 0.0847 and others simply gave 0.002 in (ii) rather than to the 3 significant figures expected. In part (ii) the most commonly seen incorrect answer was 0.0167 caused by thinking that the phrase “more than 3” included 3 or using 1 -P(𝐷𝐷⩽2) as the complement for P(D > 3).
Common mistakes
state B(36, 0.015) (not calculator speak)
P(D > 3) = 1 − P(D ≤ 3), not 1 − P(D ≤ 2)
3 s.f.: 0.0848 (not truncated 0.0847) and 0.00203 (not 0.002)
June 2025 · Paper 3 (Statistics) · Q3(b)3 marks
Mark scheme (whole question; this part is marked with the orange bar)
Examiner's comment
In part (b) most responses had the correct binomial model or inferred it by stating a suitable probability. A common mistake though was to use P(X = 8) rather than 𝑃𝑃(𝑋𝑋⩾8) which did not gain either of the remaining marks. Those with the correct probability sometimes gave a comparison with 0.05 rather than 0.025 and did not gain the final mark and others did not give a conclusion in context. Although a critical region was not required here (we will only ask for this if it can be found using the tables provided) some did use this approach. Many were successful but a few did not give both tails of the critical region and others did not state the critical region properly for example by just stating ( ) P 9 0.0177... X = and not writing the critical region as 𝑋𝑋⩾9 and X = 0. A small number attempted to use a normal approximation here.
Common mistakes
X ~ B(260, 0.015)
use P(X ≥ 8) = 0.0441, not P(X = 8)
two-tailed so compare with 0.025, not 0.05
conclusion in context (insufficient evidence the proportion of defective components has changed)
a critical region needs both tails
June 2025 · Paper 3 (Statistics) · Q6(a)4 marks
Mark scheme (whole question; this part is marked with the orange bar)
Examiner's comment
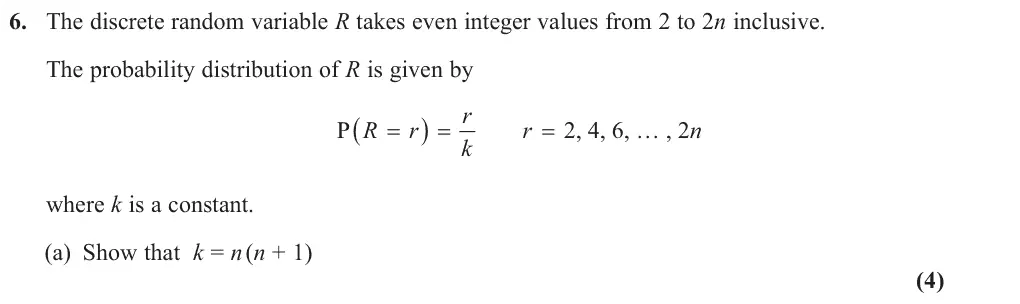
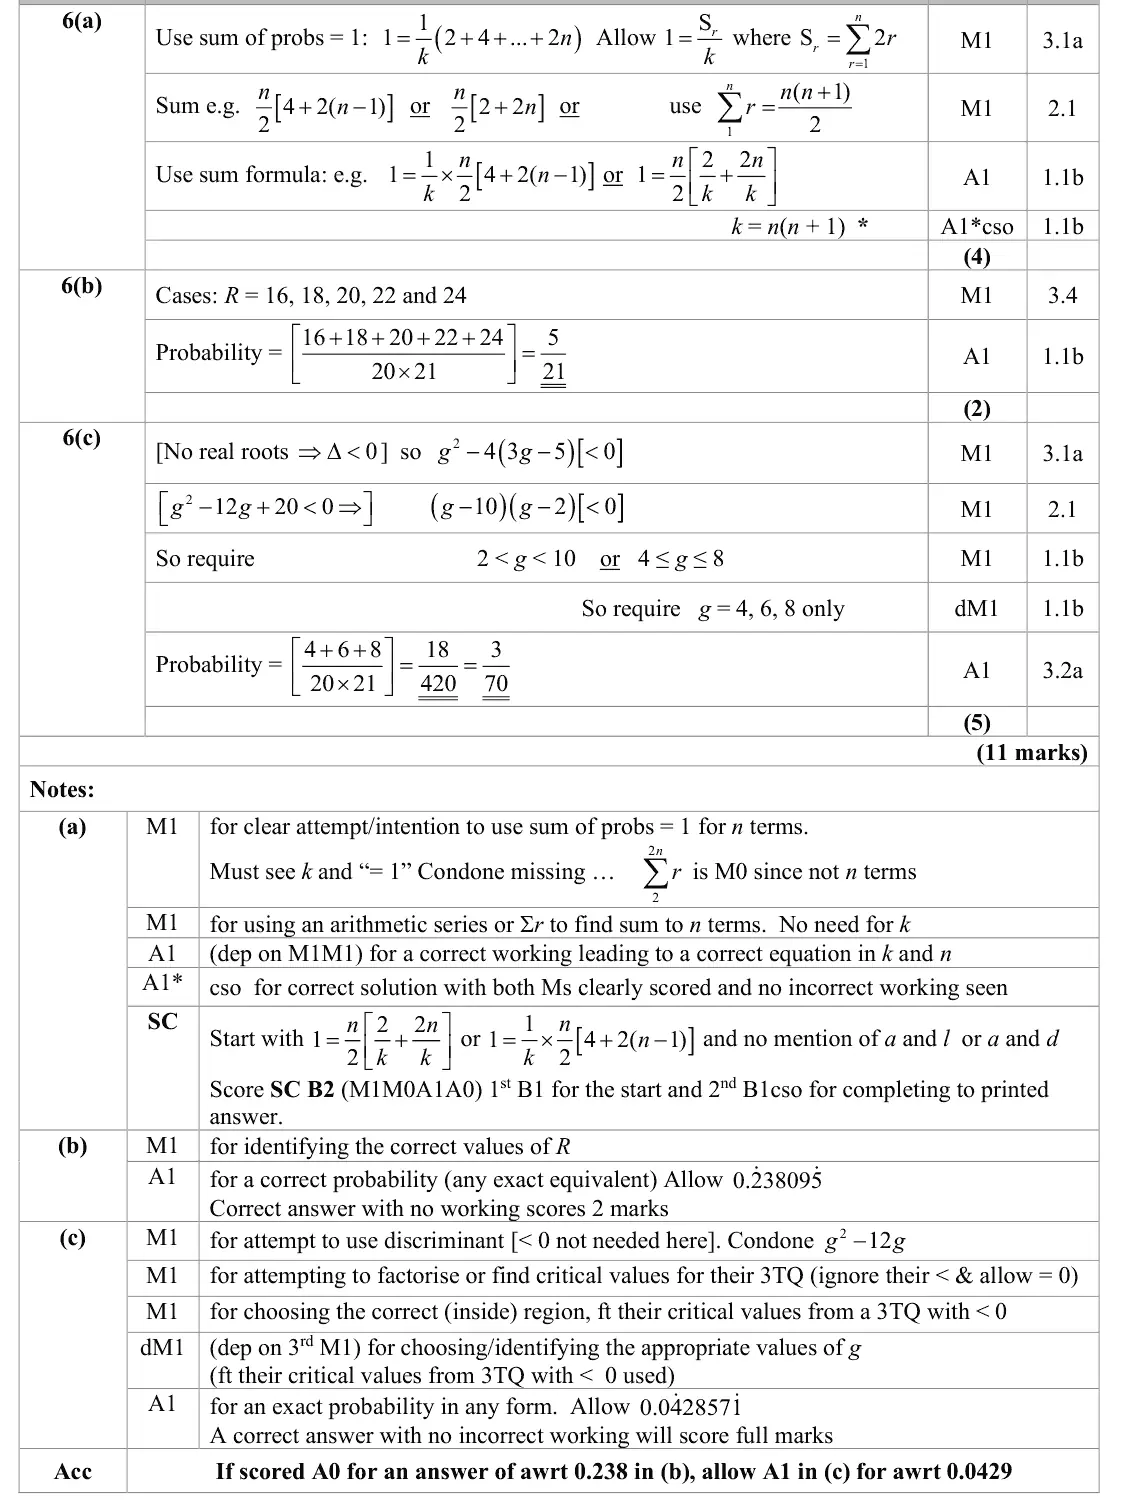
This question provided some challenge and discrimination for the end of the paper. Most learners attempted this and made some progress. Part (a) was a “show that” question and learners need to remember therefore to show all steps in their working clearly and present a solution without incorrect working. Most were able to identify that they needed to use the fact that the sum of the probabilities equalled 1. A popular starting point was to write down 1= 2 4 6 2 ... n k k k k + + + + and some were then able to recognise that an arithmetic series was involved and use a suitable formula to find the sum. Some learners didn’t use the correct number of terms with 2n or 4 (from the 4 terms 2, 4, 6 and 2n) being common errors. Full and concisely presented solutions were rare.
Common mistakes
sum of probabilities = 1: (2 + 4 + ... + 2n)/k = 1 with n terms (not 2n or 4)
arithmetic series sum n(n + 1)
every step shown for the given answer
June 2025 · Paper 3 (Statistics) · Q6(b)2 marks
Mark scheme (whole question; this part is marked with the orange bar)
Examiner's comment
This question provided some challenge and discrimination for the end of the paper. Most learners attempted this and made some progress. Part (b) was generally answered well, though some were confused by the even number restriction and attempted 16 17 18 ... 24 25 420 + + + + + and a few included 26. Those who attempted P(𝑅𝑅⩽24) -P(𝑅𝑅⩽14) were rarely successful but many simply listed the 5 cases required and were readily able to reach the correct answer.
Common mistakes
even values only: R = 16, 18, 20, 22, 24 (not 26, not odd values)
divide by 20 × 21 = 420
5/21
June 2025 · Paper 3 (Statistics) · Q6(c)5 marks
Mark scheme (whole question; this part is marked with the orange bar)
Examiner's comment
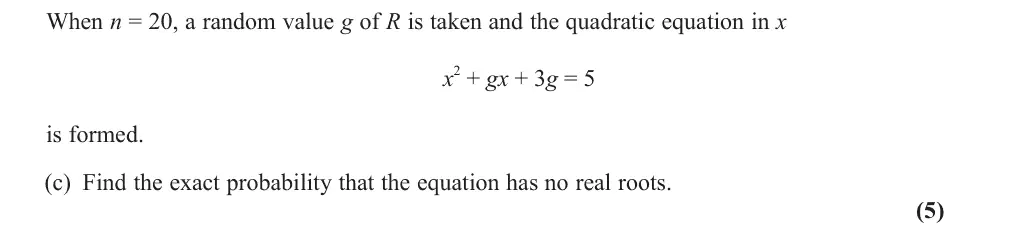
This question provided some challenge and discrimination for the end of the paper. Most learners attempted this and made some progress. The attempts seen in part (c) were encouraging with many realising that the discriminant of the quadratic equation was required and for “no real roots” this must be negative. Most of these learners were able to form the correct quadratic equation in g and find the correct critical values but the correct critical region eluded some with g < 2 and g < 10 being a common error. From the correct inequalities for g it was a small step to identify that the values of g required were 4, 6 and 8 and the majority of learners who got this far were able to complete the solution and state the correct probability in the correct form.
Common mistakes
no real roots: g² − 4(3g − 5) < 0 so (g − 2)(g − 10) < 0 and 2 < g < 10 (inside region)
even values g = 4, 6, 8
probability 18/420 = 3/70
June 2024 · AS Paper 2 (Statistics) · Q4(a)3 marks
Mark scheme (whole question; this part is marked with the orange bar)
Examiner's comment
Part (a) was well answered with the majority of students gaining this mark, the only issues occurring with rounding or calculating P(𝑋 <= 10) rather than P(𝑋 = 10). Part (a)(ii) was less well attempted with many students unsure of the difference between <= and <. The most common error seen was to evaluate P(𝑋 <= 14) – P(𝑋 >= 12) although many other incorrect expressions were seen. Often when students worked out P(𝑋= 12) + P(𝑋= 13) + P(𝑋= 14), they attained full marks. For those who attempted part (b), this was answered much better than in previous series and
Common mistakes
(i) P(X = 10) = 0.154, not P(X ⩽ 10)
(ii) P(12 ⩽ X < 15) = P(X ⩽ 14) − P(X ⩽ 11) = 0.179
common error P(X ⩽ 14) − P(X ⩽ 12)
June 2024 · AS Paper 2 (Statistics) · Q4(b)4 marks
Mark scheme (whole question; this part is marked with the orange bar)
Examiner's comment
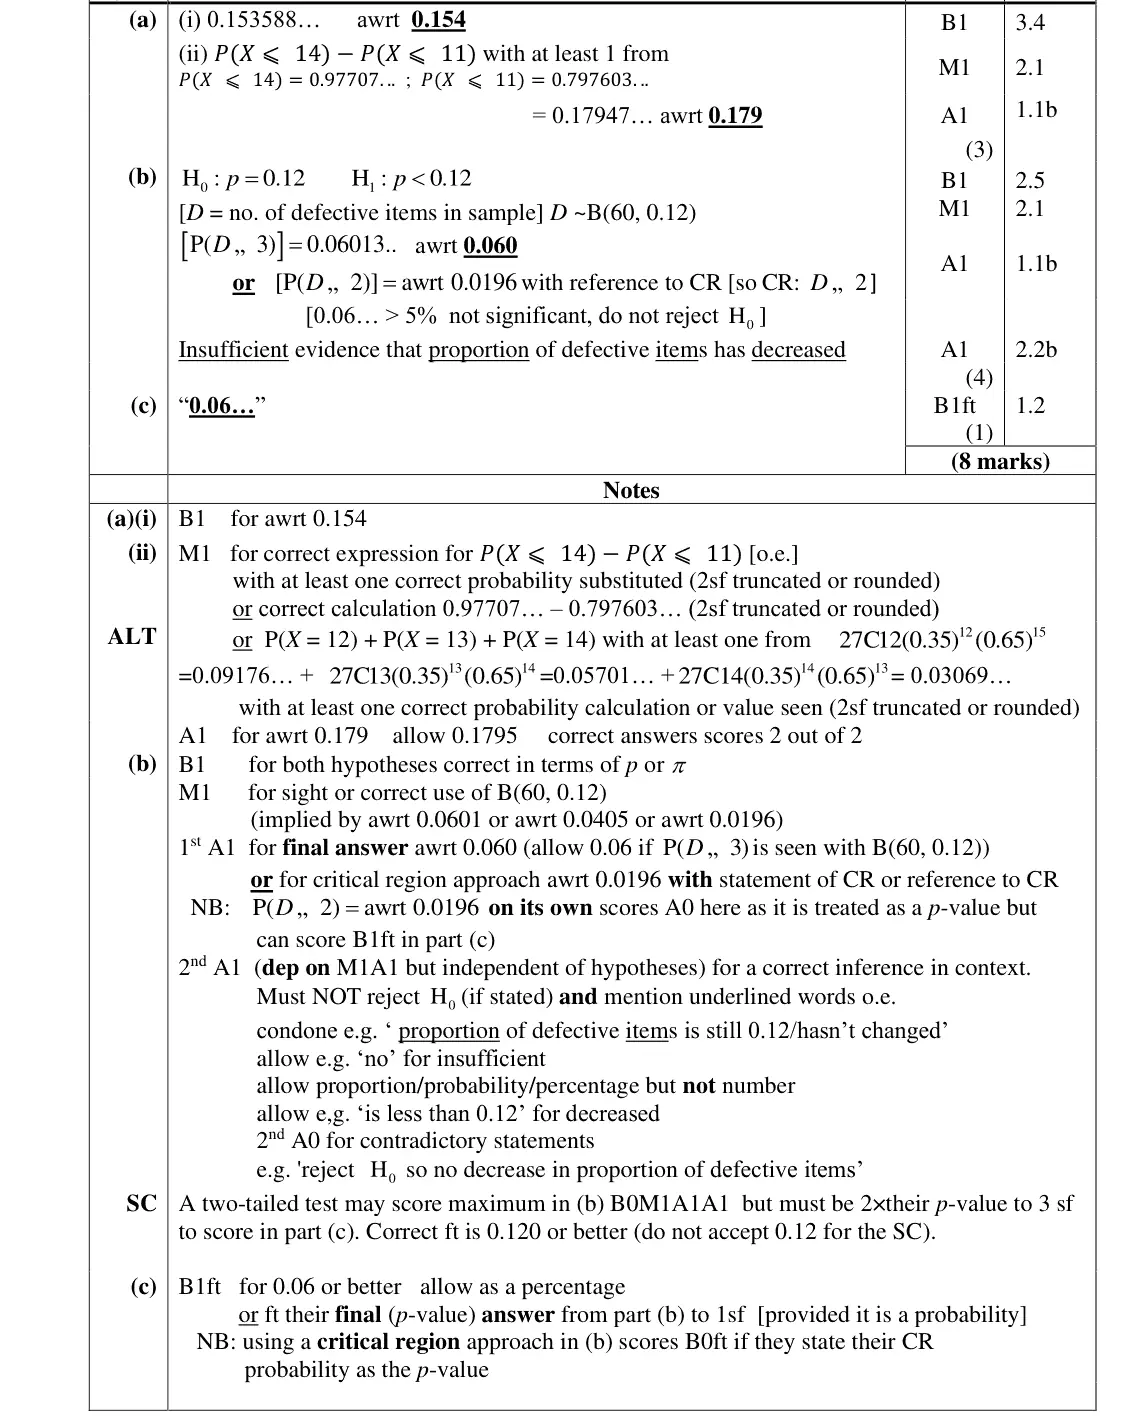
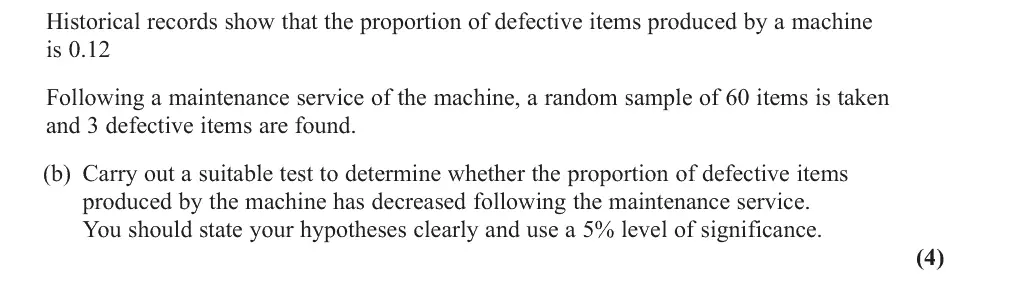
For those who attempted part (b), this was answered much better than in previous series and students are becoming more familiar with the structure of these questions, writing the hypotheses in terms of p and the distribution clearly. Sometimes the probability statements were not clearly stated, with students writing down the values that they had inputted into their calculators. It was quite common to see P(𝑋 < 3) or P(𝑋 = 3) rather than P(𝑋 <= 3) calculated. The conclusion was not always given in context. When the context was given, it was usually correct, although missing out the word “proportion” or its equivalent meant the mark was lost. Some students chose to use a critical region approach rather than a p-value approach, but they often did not make this clear and some were then unsure about whether 3 was inside or outside the critical region and what this implied for the acceptance or otherwise of H0 Part (d) was frequently omitted or the value p = 0.12 given. Those who used the critical region approach rarely got this mark. However, students are becoming more aware of what the p-value represents.
do not reject H₀: insufficient evidence that the proportion of defective items has decreased
conclusion in context with "proportion"
CR approach must be made clear (CR D ⩽ 2)
June 2024 · AS Paper 2 (Statistics) · Q5(a)1 mark
Mark scheme (whole question; this part is marked with the orange bar)
Examiner's comment
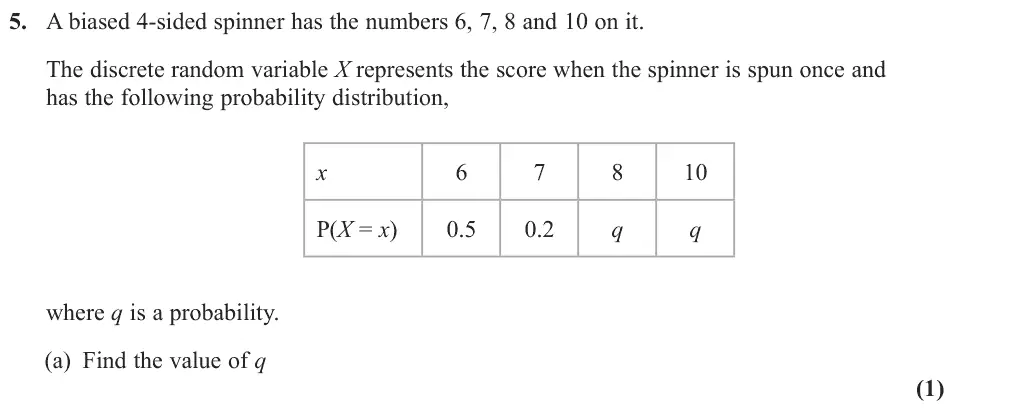
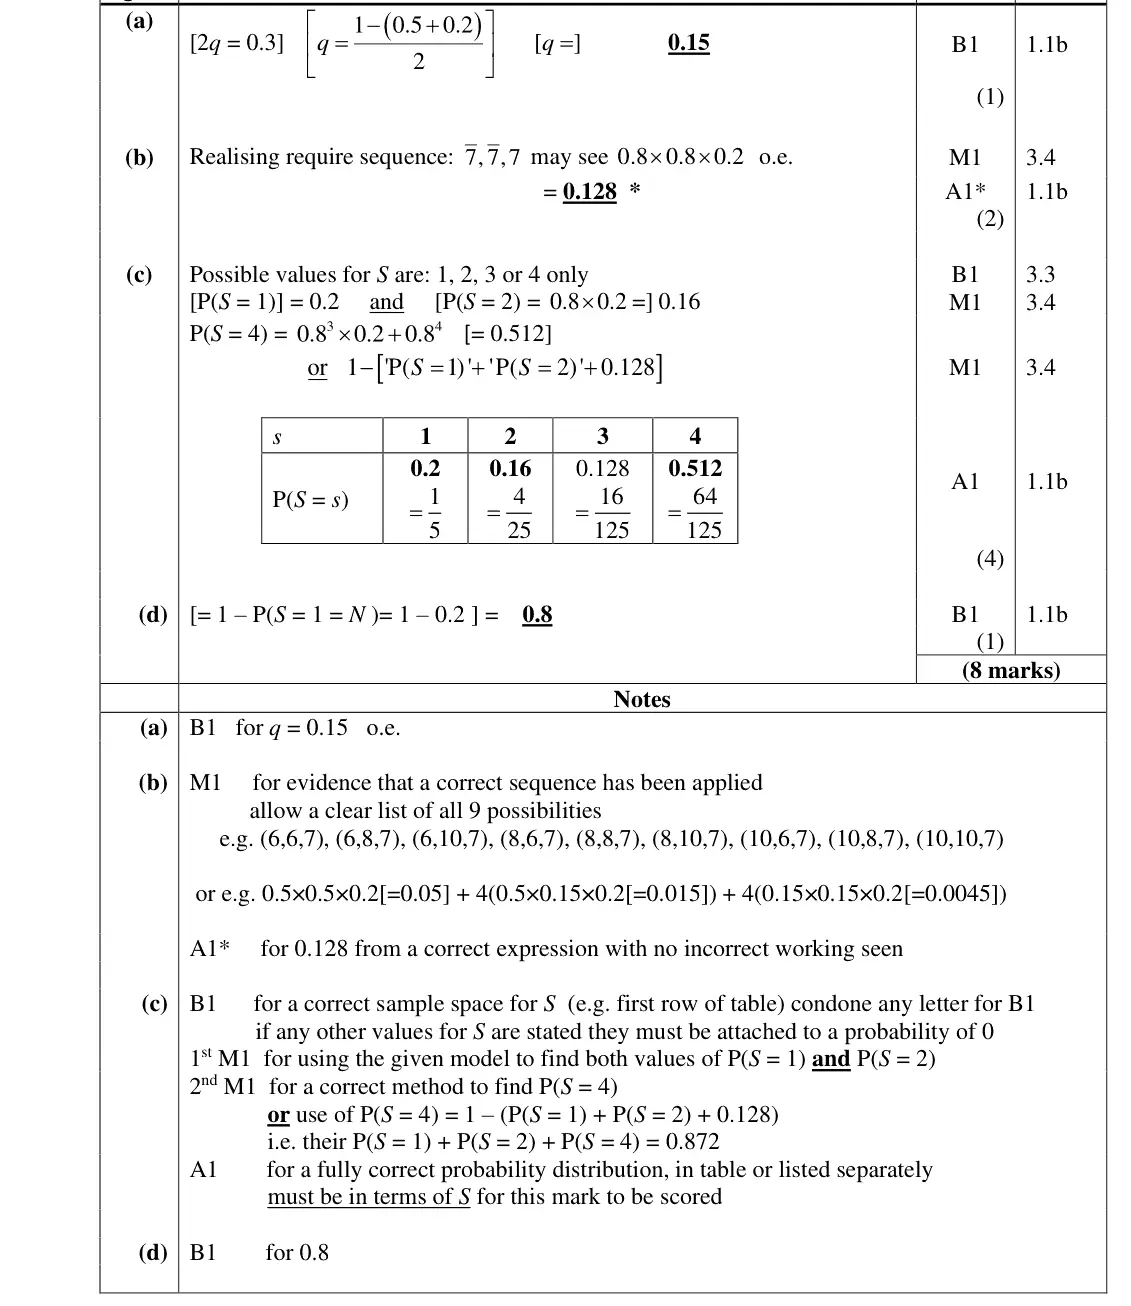
Part (a) and part (b) was generally done well by the vast majority of students. A large number of students overcomplicated their workings by calculating probabilities for all 9 possibilities rather than simply calculating P(𝑛𝑜𝑡 7) x P(𝑛𝑜𝑡 7) x P(7). Many students still do not understand the concept of a probability distribution and many attempts were made to calculate a single probability, usually from a binomial distribution, in
Common mistakes
probabilities sum to 1: 2q = 0.3, q = 0.15
June 2024 · AS Paper 2 (Statistics) · Q5(b)2 marks
Mark scheme (whole question; this part is marked with the orange bar)
Examiner's comment
Part (a) and part (b) was generally done well by the vast majority of students. A large number of students overcomplicated their workings by calculating probabilities for all 9 possibilities rather than simply calculating P(𝑛𝑜𝑡 7) x P(𝑛𝑜𝑡 7) x P(7). Many students still do not understand the concept of a probability distribution and many attempts were made to calculate a single probability, usually from a binomial distribution, in
Common mistakes
stops after the 3rd spin means not 7, not 7, then 7: 0.8 × 0.8 × 0.2 = 0.128
listing all nine sequences is unnecessary
June 2024 · AS Paper 2 (Statistics) · Q5(c)4 marks
Mark scheme (whole question; this part is marked with the orange bar)
Examiner's comment
The final question on the paper, as expected, proved to be the most demanding and parts (c) and (d) were only completed by the most able students. part (c). Some students were able to make a good attempt at the probability distribution, but a large number failed to correctly calculate P(𝑆= 4) as they didn't account for the spinner failing to land on a 7 four times. Most students left out part (d) as they were unable to interpret what this probability
Common mistakes
S takes values 1, 2, 3, 4 only
P(S = 1) = 0.2, P(S = 2) = 0.16, P(S = 3) = 0.128, P(S = 4) = 0.8³ = 0.512 (she stops after 4 spins whether or not she gets a 7)
P(S = 4) = 0.8³ × 0.2 alone is the common error
trying a binomial
June 2024 · AS Paper 2 (Statistics) · Q5(d)1 mark
Mark scheme (whole question; this part is marked with the orange bar)
Examiner's comment
and (d) were only completed by the most able students. Most students left out part (d) as they were unable to interpret what this probability represented. Of those who did try, many complicated probability expressions were seen often leading to an incorrect answer.
Common mistakes
S > N unless she gets a 7 on the first spin (S = N = 1): 1 − 0.2 = 0.8
most omitted or overcomplicated this
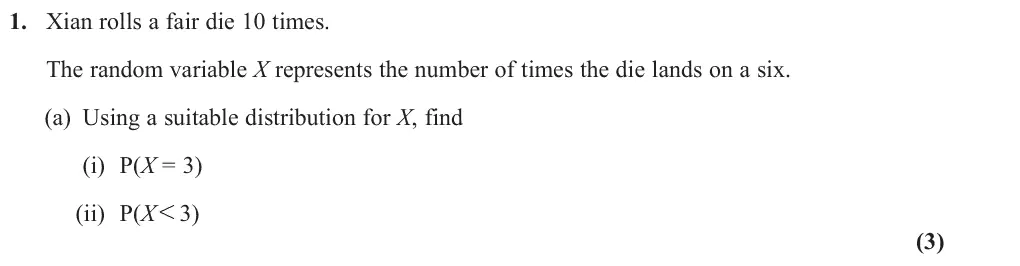
June 2024 · Paper 3 (Statistics) · Q1(a)3 marks
Mark scheme (whole question; this part is marked with the orange bar)
Examiner's comment
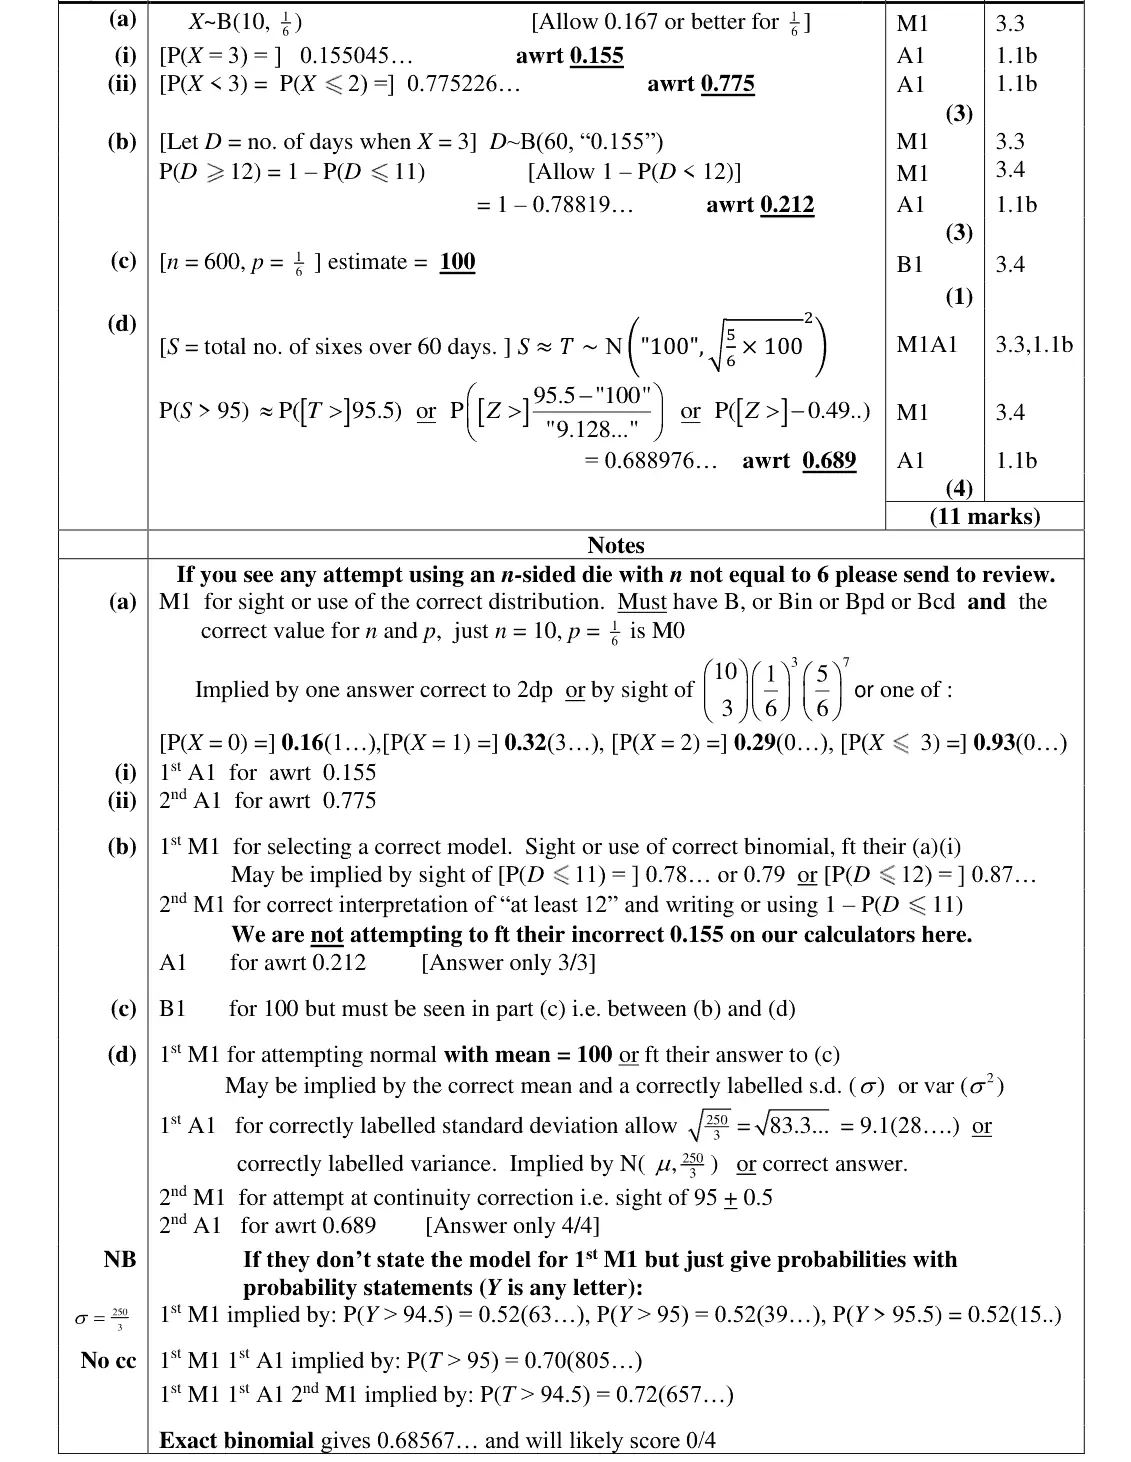
Almost all students were able to write down or use the correct binomial model in part (a) and usually evaluate P(X = 3) correctly. Some struggled with part (ii) and an answer of 0.930… from P(X ⩽ 3) was often seen suggesting that students are not entirely familiar with how their calculator operates. Others seemed to mis-interpret the inequality and attempted 1 – P(X ⩽ 2).
Mark scheme (whole question; this part is marked with the orange bar)
Examiner's comment
In part (b) a new random variable was needed and students who defined this clearly usually made good progress, but some simply tried to use B(60, 1 6 ). Interpreting the phrase “at least 12 days” caused problems for some students but generally this part was answered well. The final two parts required a third random variable S ~B(600, 1 6 ) and many wrote down the correct mean for part (c) and often stated that this random variable was approximated by N(100, …) to get
Common mistakes
define a new variable D ~ B(60, 0.155) (not B(60, 1/6))
at least 12 is 1 − P(D ≤ 11) = 0.212
June 2024 · Paper 3 (Statistics) · Q1(c)1 mark
Mark scheme (whole question; this part is marked with the orange bar)
Examiner's comment
for part (c) and often stated that this random variable was approximated by N(100, …) to get started in part (d). Many students seemed unsure about finding the standard deviation (the
Common mistakes
total sixes S ~ B(600, 1/6) so estimate np = 100
June 2024 · Paper 3 (Statistics) · Q1(d)4 marks
Mark scheme (whole question; this part is marked with the orange bar)
Examiner's comment
started in part (d). Many students seemed unsure about finding the standard deviation (the formulae are available in the formula booklet) and there was a great deal of mislabelling or use of the variance instead of the standard deviation. A good number realised that a continuity correction was required, though of course not always in the right direction, but the correct final answer was not uncommon.
Common mistakes
N(100, 250/3): sd = 9.13, do not use the variance as sd
Mark scheme (whole question; this part is marked with the orange bar)
Examiner's comment
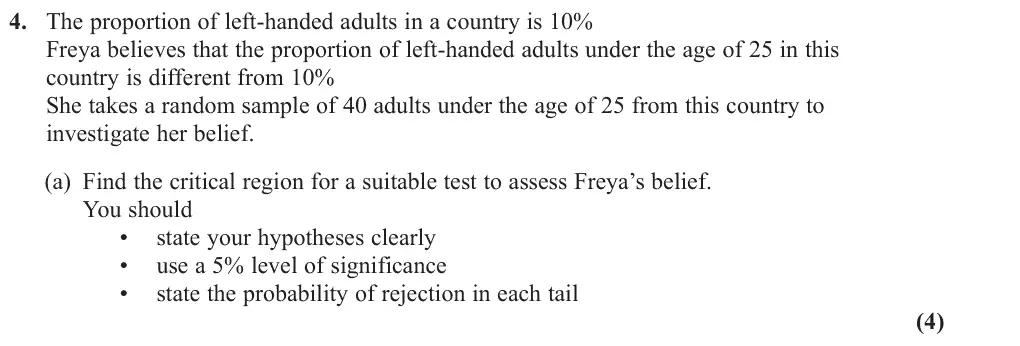
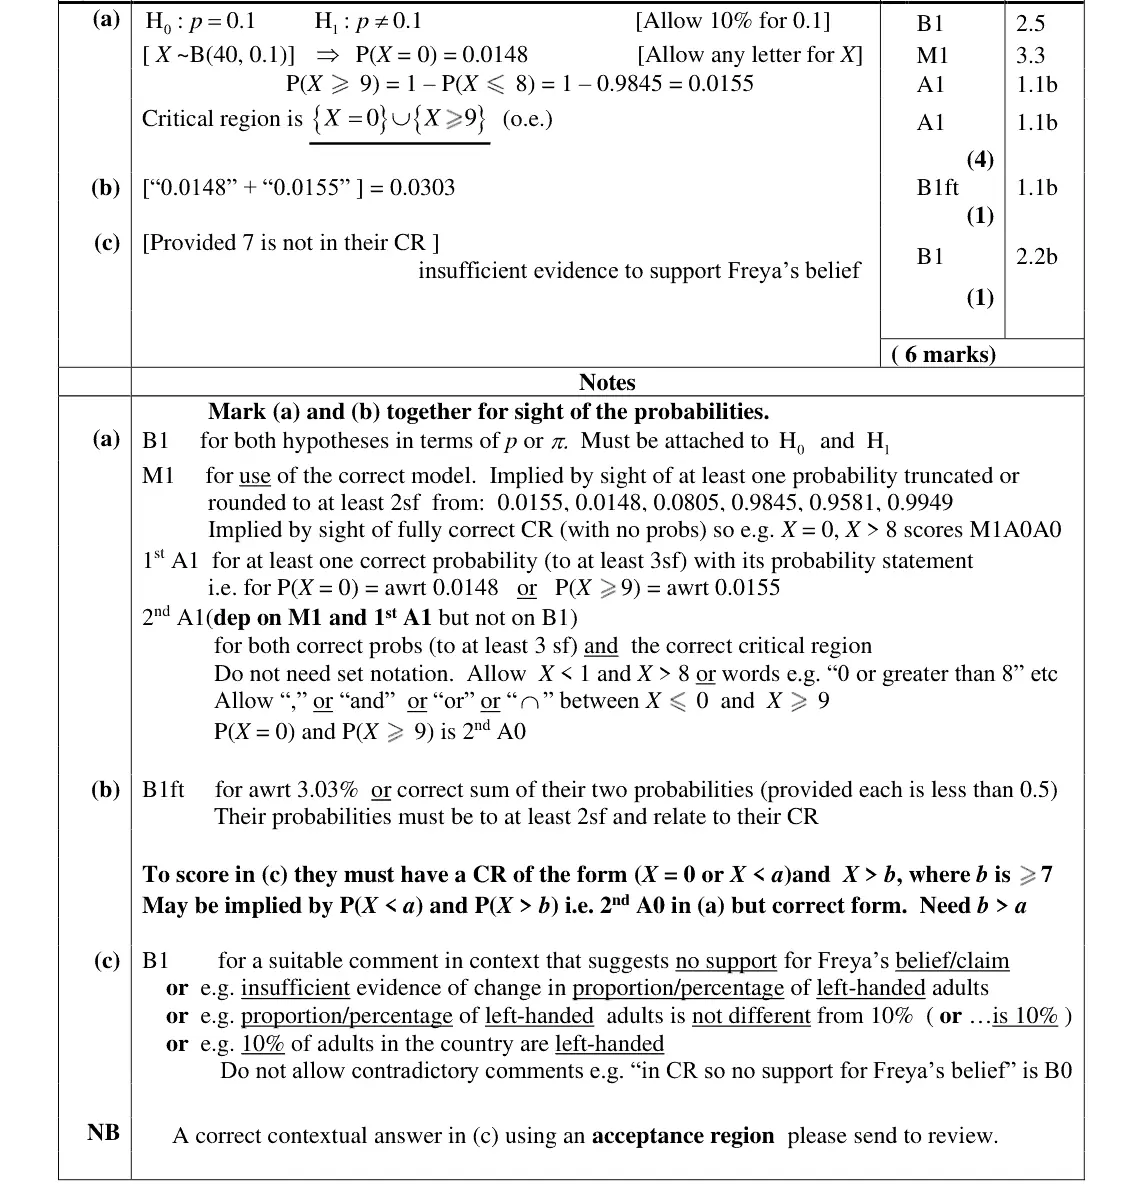
In part (a) most gave the hypotheses correctly in terms of p though some failed to have the H0 and H1 labels and some had p = 0 for the null hypothesis perhaps confusing this with a test for correlation. Most used the correct distribution to try and find the critical region but notation was often poor with P(X = 8) being written when P(X ⩽ 8) was meant or calculated and a number struggled to find P(X ⩾ 9) correctly leading to upper tails of the critical region of X ⩾ 8 or X ⩾ 10. There were many errors with the probabilities in each tail with P(X = 0) = 0.0147 (a truncated answer) frequently seen instead of 0.0148 the correct rounded value. Students don’t seem to be aware that the table function on their calculator truncates values rather than rounding them. Some students gave their critical regions inside probability statements and of course failed to secure the accuracy mark, and some didn’t think that X = 0 was a valid part of the critical region and omitted this from their answer. Many students who had identified a critical region were able to add their tail probabilities to give the significance level, but some merely wrote down 0.025 or doubled the probability of 0.0155 found in part (a). this against their probabilities of 0.0148 or 0.0155 from part (a).
CR X = 0 or X ≥ 9, not inside probability statements and not omitting X = 0
June 2023 · AS Paper 2 (Statistics) · Q4(b)4 marks
Mark scheme (whole question; this part is marked with the orange bar)
Examiner's comment
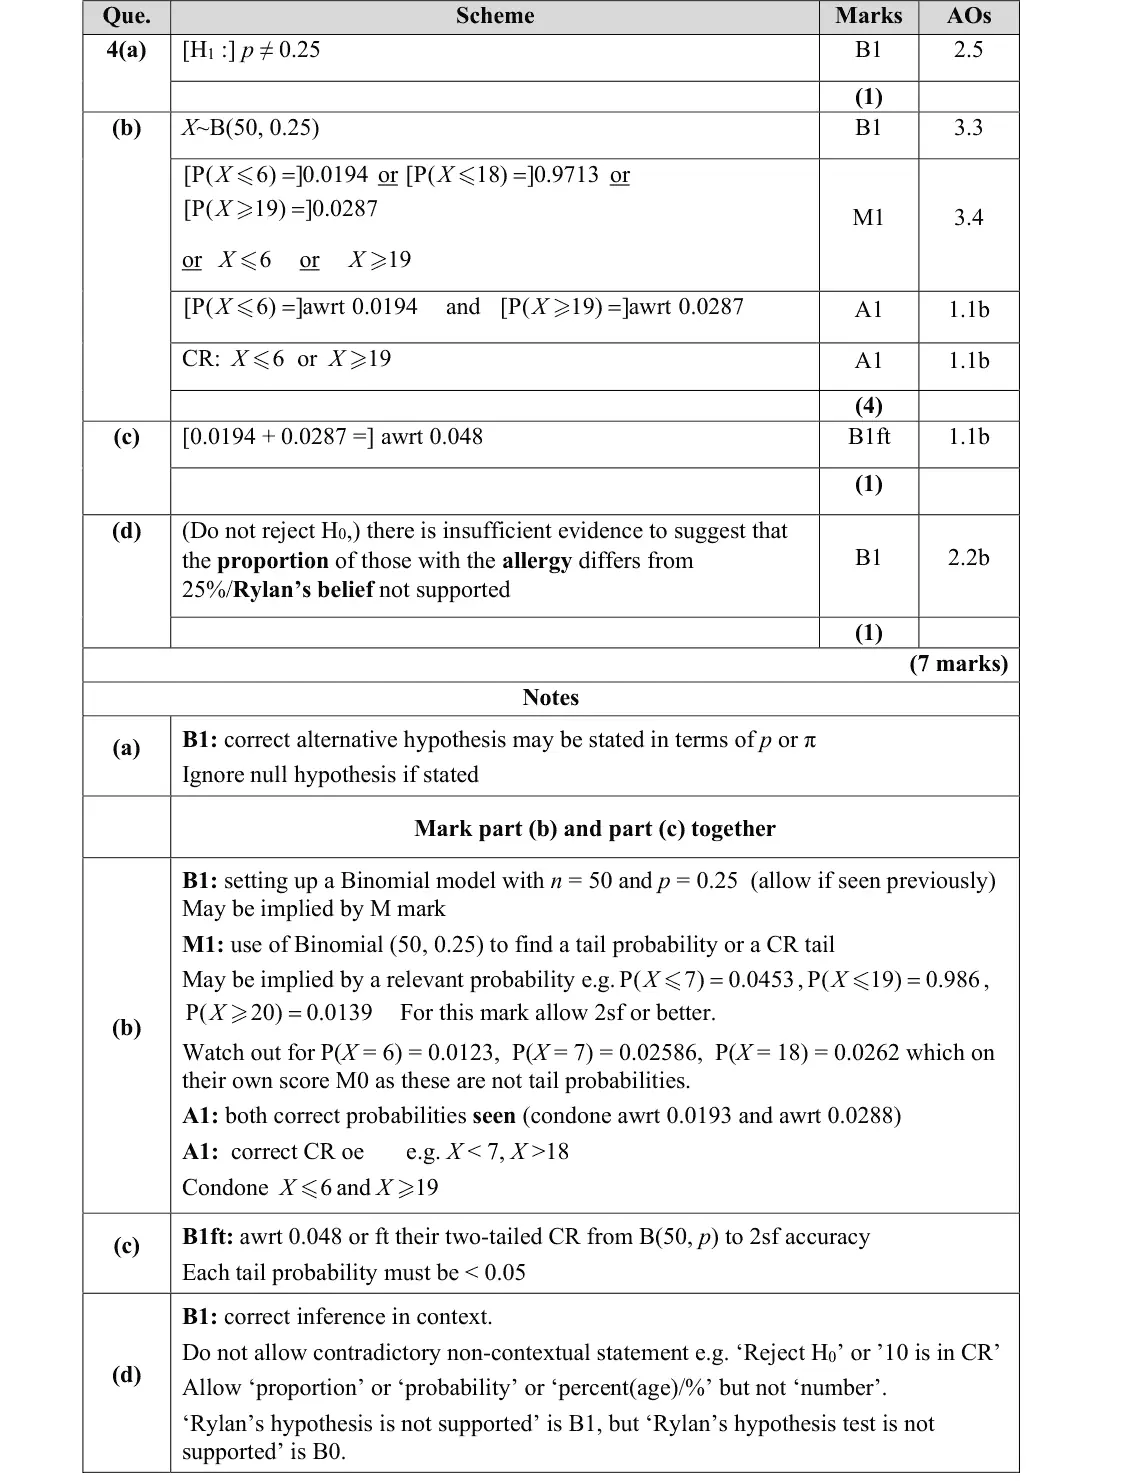
There were some good attempts seen at this question with most students able to display some knowledge of hypothesis testing. In part (b), when attempted, most students acknowledged that it was a Binomial distribution and many were able to find the probability associated with at least one of the tails (usually the lower one). However, some did not take notice in the question that the probability in each tail was required to be as close to 2.5% as possible, and hence found an incorrect upper critical region. Marks were sometimes lost for failing to state the probability associated with each tail (particularly the upper tail) and for incorrectly identifying the upper critical region, usually opting for X >= 20. There are a significant number of students writing the critical region as a probability. Many students with an incorrect critical region were still able to earn the mark in
Common mistakes
X ~ B(50, 0.25)
P(X ≤ 6) = 0.0194 and P(X ≥ 19) = 0.0287 must both be stated
CR X ≤ 6 or X ≥ 19 (X ≥ 20 common error)
point probabilities such as P(X = 6) are not tail probabilities
CR written as a probability
June 2023 · AS Paper 2 (Statistics) · Q5(a)5 marks
Mark scheme (whole question; this part is marked with the orange bar)
Examiner's comment
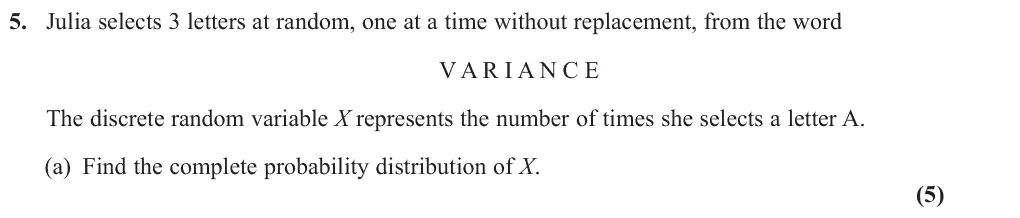
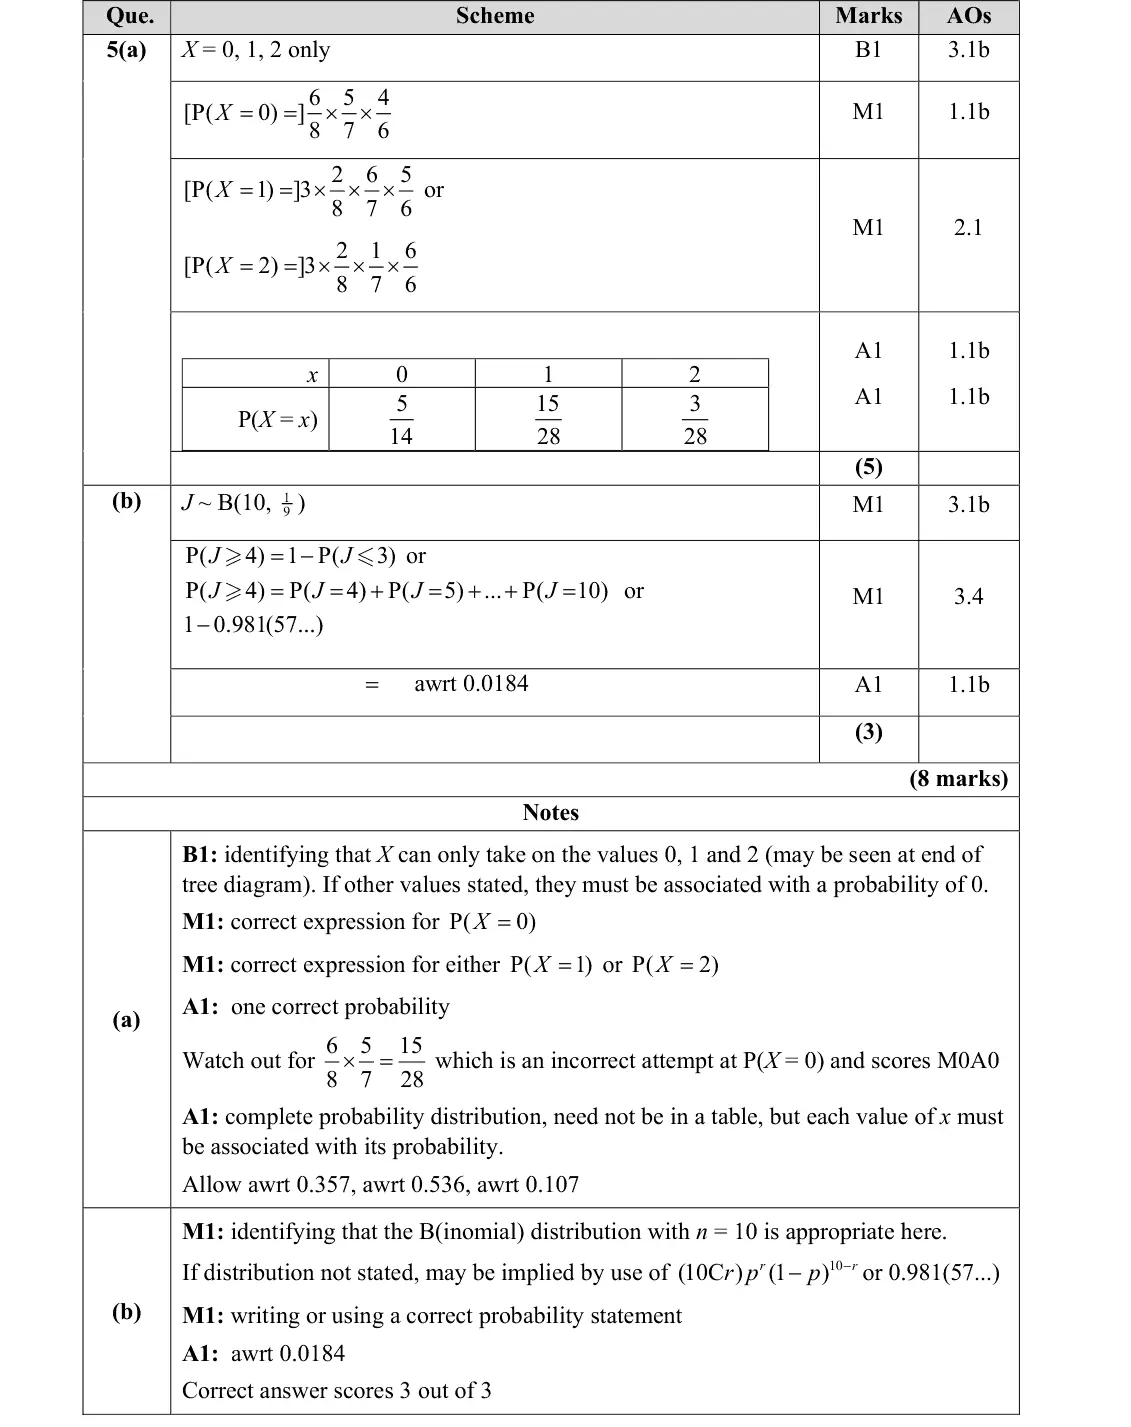
The final question on the paper, as expected, proved to be the most demanding as many students were unable to make any progress at all here. Part (a) was the most discriminating with many students leaving this part blank. Students often thought that X followed a binomial distribution. Some tried to work out individual probabilities for each letter rather than focusing on the number of A’s that could be selected. A large number of tree diagrams were seen but some could not get from the diagram to a probability distribution as they were unable to give a probability for each of the different values of X. Students who correctly worked out the probability of obtaining 1 or 2 A's sometimes did not recognise that the answer needed multiplying by 3.
multiply by 3 for the arrangements (often forgotten)
X is not binomial
June 2023 · AS Paper 2 (Statistics) · Q5(b)3 marks
Mark scheme (whole question; this part is marked with the orange bar)
Examiner's comment
The final question on the paper, as expected, proved to be the most demanding as many students were unable to make any progress at all here. Part (b) saw a higher standard. Students were able to work out that a binomial distribution needed to be used and many were able to give the correct value of n and p. One common mistake involved choosing 9 trials rather than 10 as there are 9 letters in DEVIATION.
Common mistakes
with replacement so binomial B(10, 1/9) (one E in DEVIATION's 9 letters)
P(J ≥ 4) = 1 − P(J ≤ 3) = 0.0184
common error n = 9 trials
June 2023 · Paper 3 (Statistics) · Q2(a)1 mark
Mark scheme (whole question; this part is marked with the orange bar)
Examiner's comment
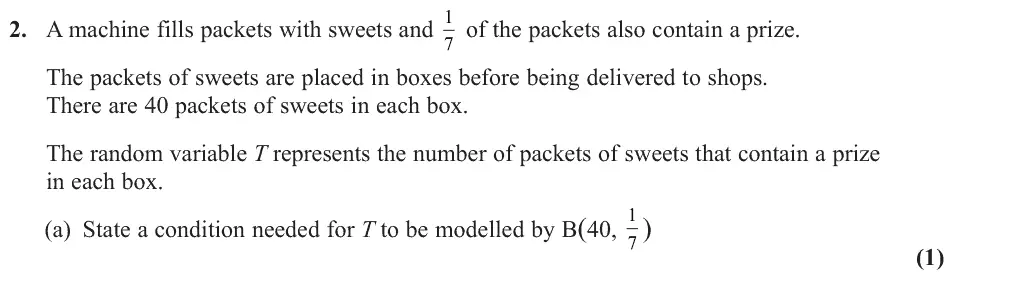
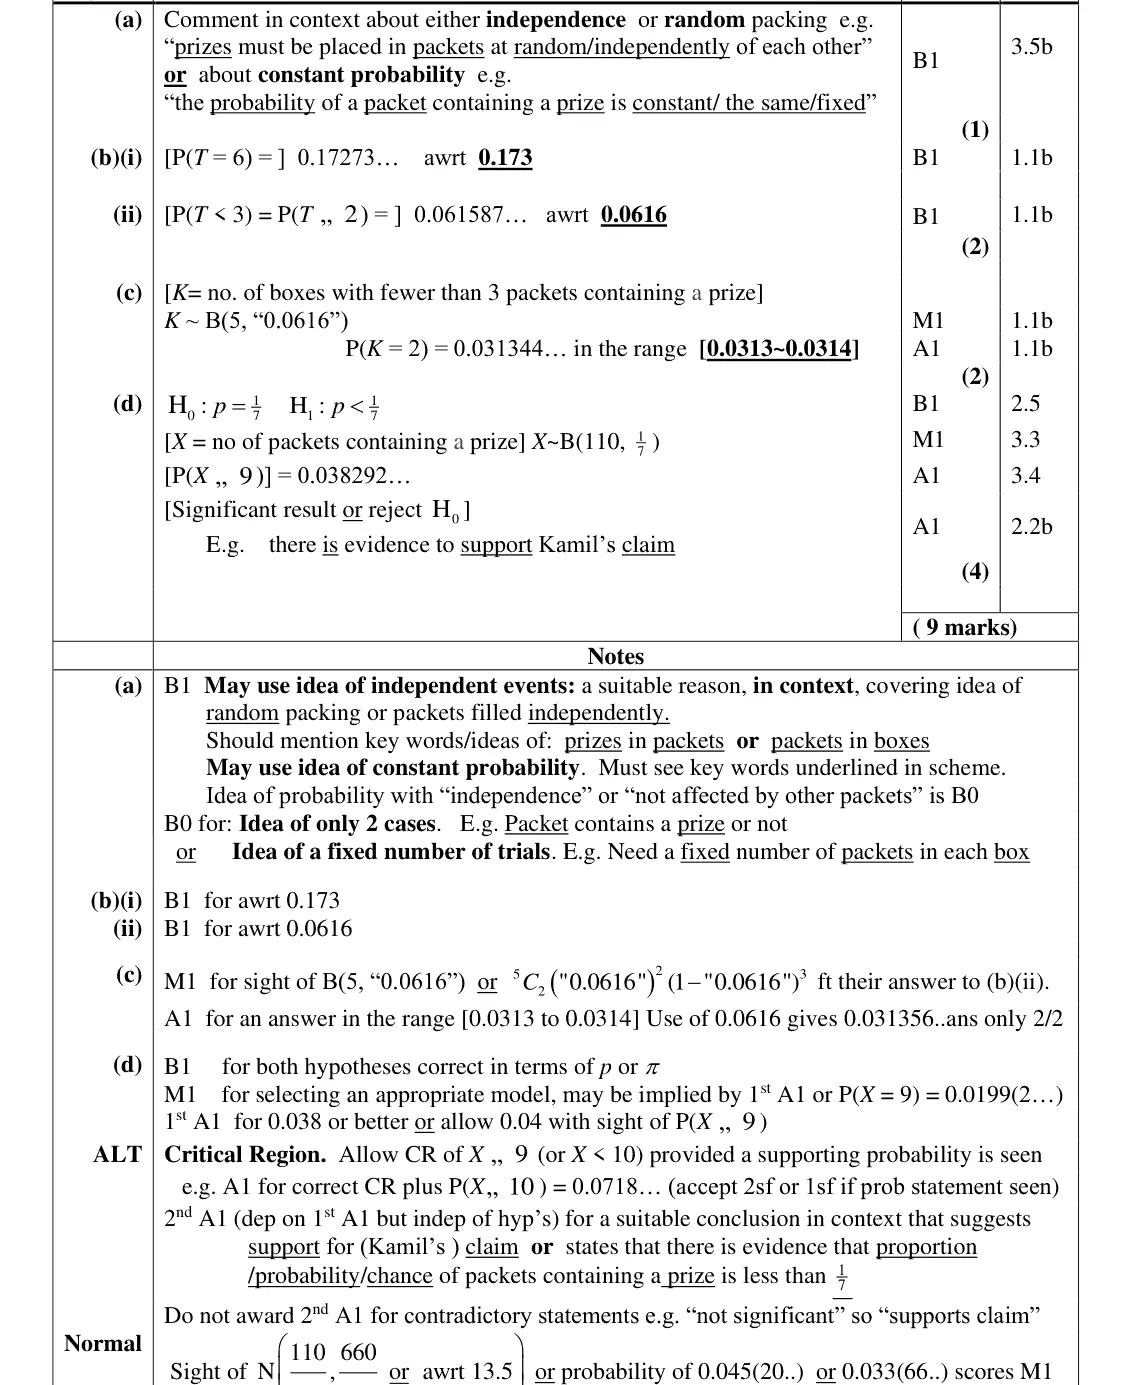
This question was also answered well. In part (a) students were often aware of the conditions needed for a binomial distribution but did not always present their answers in context with the precision required. Some focussed on the need for a fixed number of trials or that packets either did or did not contain a prize but these features were clearly identified in the question. Those scoring the mark either identified the need for prizes to be placed in packets at random or that the probability of a packet containing a prize needed to be constant. There was some confusion between “events”, such as a prize being placed in a packet, being independent and the “probability” of such an event being constant. We sometimes saw a statement such as “the probability of a packet containing a prize is independent” which didn’t score this first mark.
Common mistakes
must be in context: prizes placed in packets at random/independently, or constant probability of a packet containing a prize
"fixed number of trials" or "two outcomes" score B0 (given in question)
"the probability is independent" scores B0
June 2023 · Paper 3 (Statistics) · Q2(b)2 marks
Mark scheme (whole question; this part is marked with the orange bar)
Examiner's comment
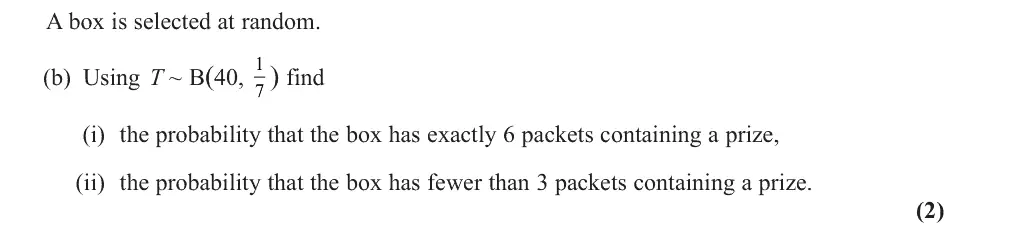
This question was also answered well. Part (b) was generally answered well though some gave answers to 2dp or 2sf rather than the 3sf as instructed on the front of the paper. Most answered (i) correctly but in (ii) common incorrect answers were from those who found P(T = 3) or P(T ⩽ 3). In part (c)
Common mistakes
fewer than 3 means P(T ≤ 2) = 0.0616, not P(T ≤ 3) or P(T = 3)
give 3 s.f. not 2
June 2023 · Paper 3 (Statistics) · Q2(c)2 marks
Mark scheme (whole question; this part is marked with the orange bar)
Examiner's comment
This question was also answered well. common incorrect answers were from those who found P(T = 3) or P(T ⩽ 3). In part (c) many were able to identify the correct distribution and those who stated this were guaranteed the method mark even if their answer to (b)(ii) was incorrect. Whilst many did obtain the correct answer here those with an incorrect answer to (b)(ii) who simply wrote down a probability could not be given either mark. Some students in part (c) didn’t identify the binomial model but wrote an expression for the probability of the form - 5 but a few forgot the 5 2 3 C term. C p (1 ) p 2 2 The hypothesis test in part (d) was answered well with correct notation used for the
Common mistakes
new binomial K ~ B(5, 0.0616) for number of boxes
include the 5C2 factor
write the model down so the method mark can follow through
June 2023 · Paper 3 (Statistics) · Q2(d)4 marks
Mark scheme (whole question; this part is marked with the orange bar)
Examiner's comment
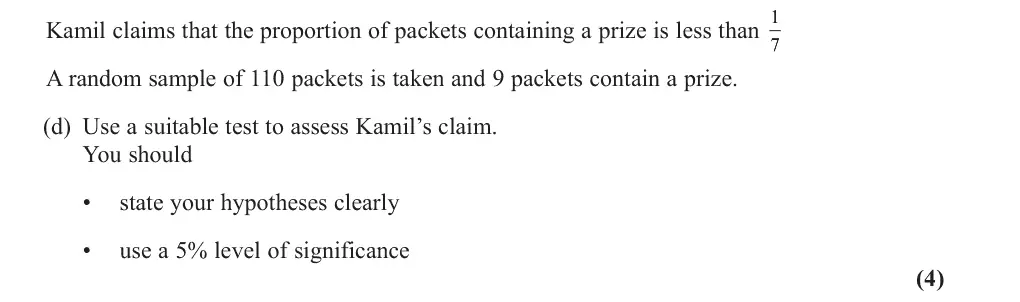
This question was also answered well. The hypothesis test in part (d) was answered well with correct notation used for the hypotheses and the appropriate one-tailed test identified. Most selected the correct binomial model but it was disappointing to see a number finding P(X = 9) rather than P(X ⩽ 9). A correct conclusion in context was often given: some using the simple response that there is evidence to support Kamil’s claim and others stating that there was 1 evidence that the proportion of packets containing a prize is less than 7. It was encouraging to see that most of those using the second approach were referring to “proportion” rather than “number of” this time.
Common mistakes
H0: p = 1/7, H1: p < 1/7 (one-tailed)
use P(X ≤ 9) = 0.0383, not P(X = 9)
conclusion in context about the proportion, not the number, of packets
June 2023 · Paper 3 (Statistics) · Q5(b)5 marks
Mark scheme (whole question; this part is marked with the orange bar)
Examiner's comment
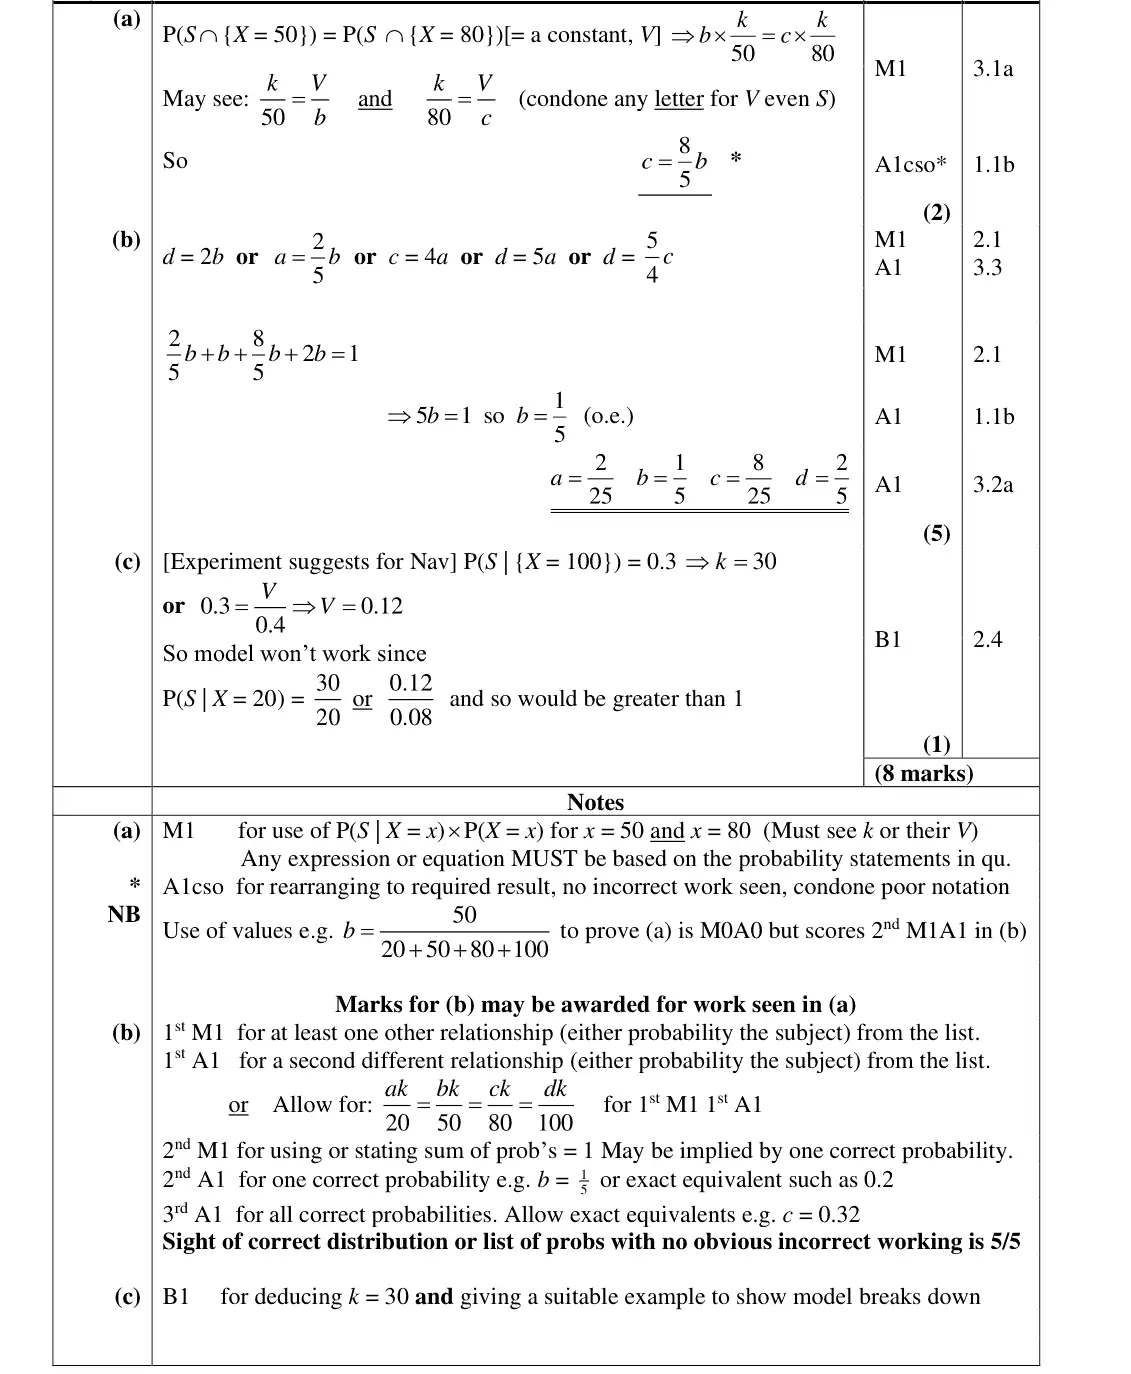
This question proved to be the most challenging on the paper for students.
Common mistakes
form further relations (d = 2b, a = 2b/5) from the same idea, then sum of probabilities = 1: b = 1/5, a = 2/25, c = 8/25, d = 2/5
June 2022 · AS Paper 2 (Statistics) · Q2(a)3 marksEasy
Mark scheme (whole question; this part is marked with the orange bar)
Examiner's comment
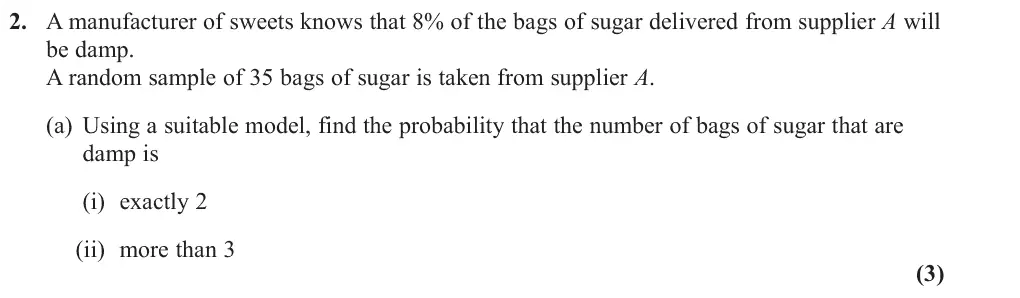
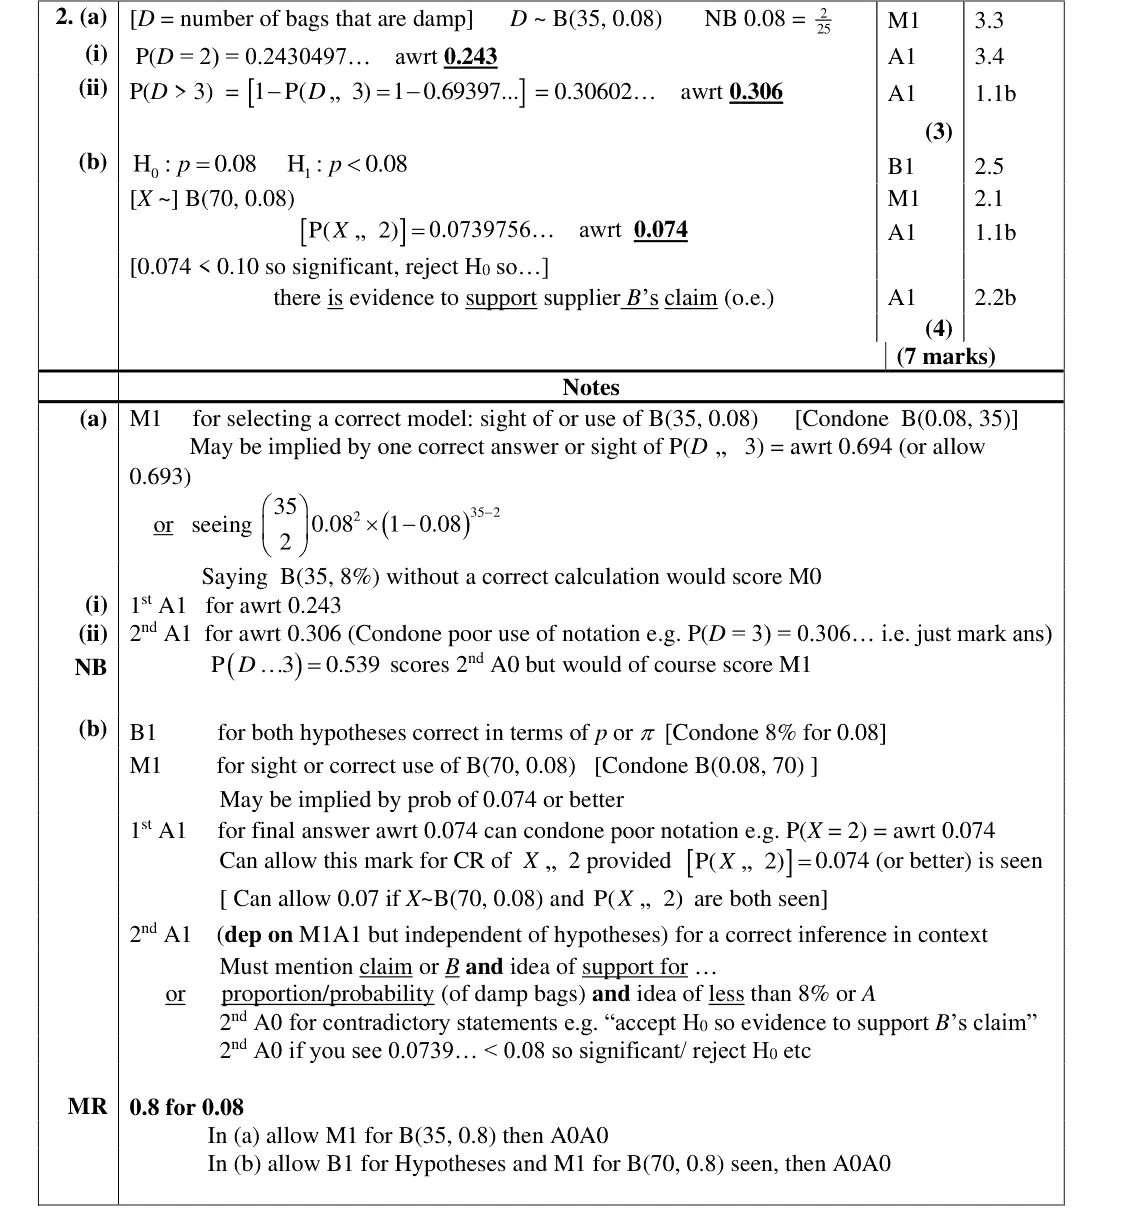
This question was answered well with nearly 40% scoring 6 or 7 marks. In part (a) many selected the correct model and usually stated it correctly though on this occasion we did condone seeing B(0.08, 35) for example. Many students simply write down what appears on their calculator input screen and they should be aware that this is not standard mathematical notation and without a correct answer following it would not gain the method mark. Most also scored the mark for (i) though some failed to give an accurate enough answer with 0.24 being the only answer offered on a few occasions. The front of the paper says that 3 significant figures should be used but we will usually allow any answer which rounds to 3sf (indicated as awrt on the mark scheme.) Part (ii) was not answered so well with some finding ( ) , some thinking that P(D > 3) = 1 – P(D „ 2) and others unsure P 3 D… about which function to use on their calculator and ending up with P(D = 3). In part (b) the
Common mistakes
D ~ B(35, 0.08)
(i) 0.243 (3 s.f., not 0.24)
(ii) 1 − P(D ≤ 3) = 0.306, common error P(D ≥ 3) or P(D = 3)
calculator notation is not acceptable working
June 2022 · AS Paper 2 (Statistics) · Q2(b)4 marks
Mark scheme (whole question; this part is marked with the orange bar)
Examiner's comment
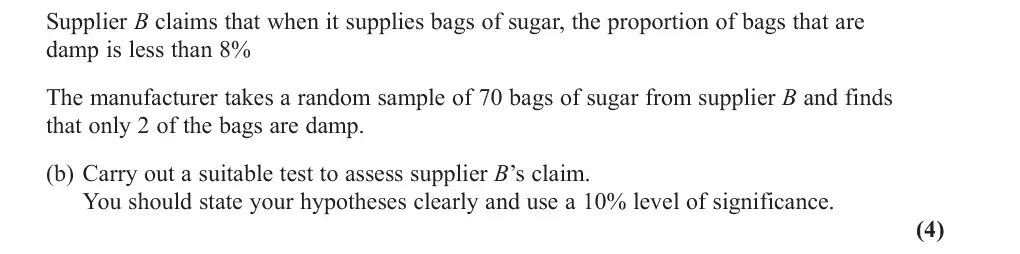
about which function to use on their calculator and ending up with P(D = 3). In part (b) the hypotheses were usually correctly stated using p and a correct model selected. Most obtained the correct probability although some found P(X = 2) rather than P(X „ 2). The correct decision was usually made but some failed to give a suitable contextual conclusion: the simplest description mentioned that there was evidence to support supplier B’s claim but other chose to talk about damp bags and often referred to the “number of bags” rather than the “proportion” decreasing. This type of question is now fairly familiar on these papers but there were a number of students who did not seem to have covered the topic of hypothesis testing and nearly 15% scored zero on this question.
conclusion in context about the proportion (not the number) of damp bags, supporting B's claim
June 2022 · AS Paper 2 (Statistics) · Q5(a)3 marks
Mark scheme (whole question; this part is marked with the orange bar)
Examiner's comment
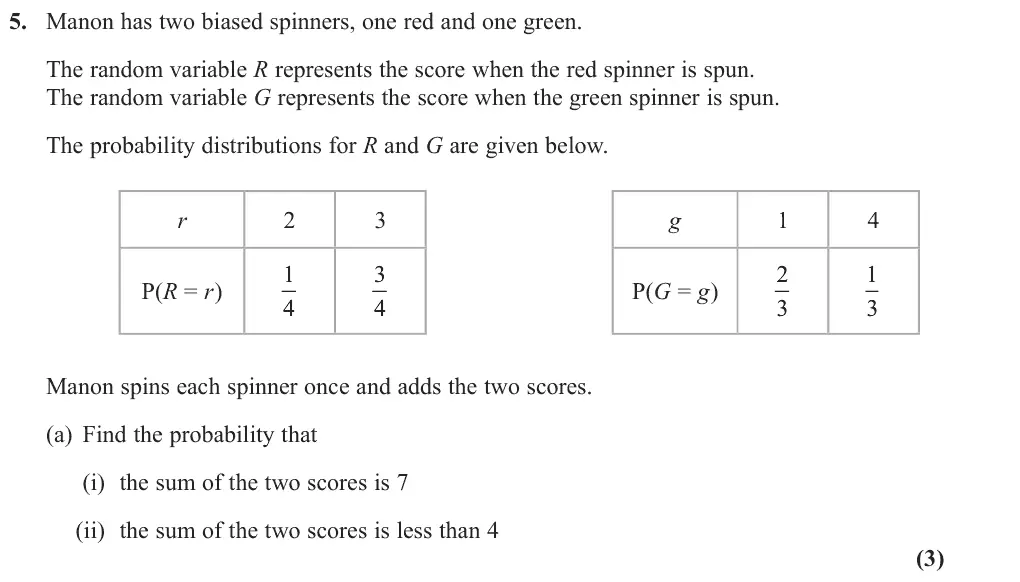
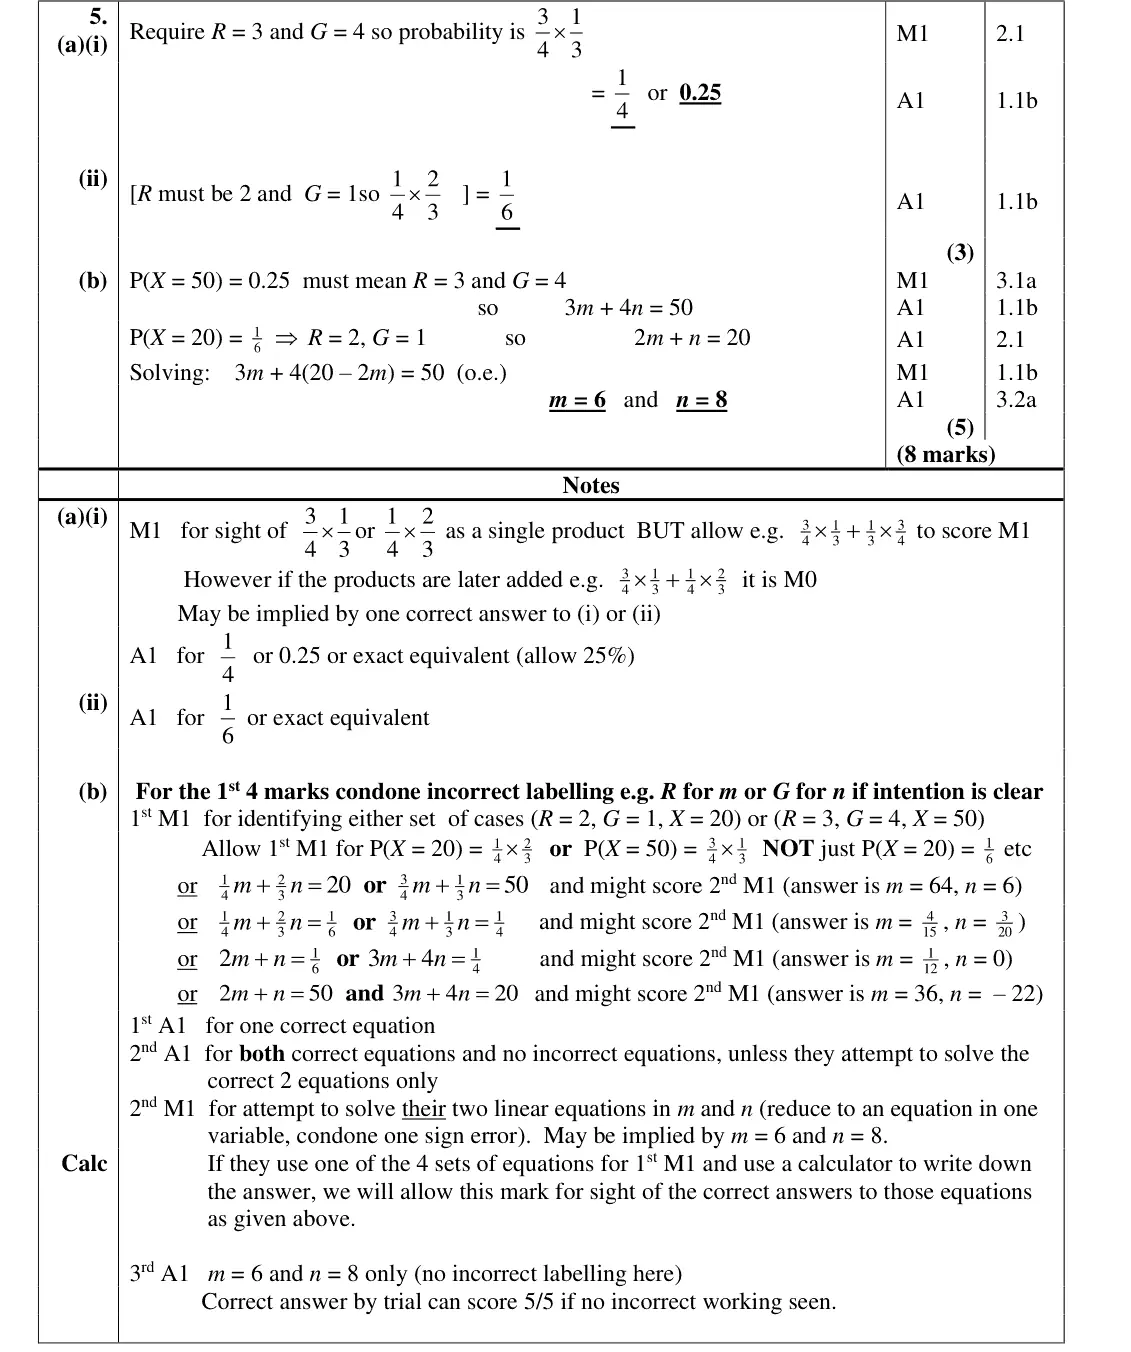
Part (a) was answered well by most candidates but often there was little explanation offered to explain where their probabilities came from, nevertheless the correct answers to (i) and (ii) were + but they had at often seen. Some thought that, for example, in (i) the answer should be 3 3 1 1 4 3 3 4 least realised that the red spinner must have landed on 3 and the green spinner on 4 and scored the first mark. Part (b) was designed as a problem solving question and it was good to see a number of
Common mistakes
sum 7 needs R = 3 and G = 4: ¾ × ⅓ = ¼
less than 4 needs R = 2, G = 1: ¼ × ⅔ = 1/6
do not add products of other cases
June 2022 · AS Paper 2 (Statistics) · Q5(b)5 marksMedium
Mark scheme (whole question; this part is marked with the orange bar)
Examiner's comment
first mark. Part (b) was designed as a problem solving question and it was good to see a number of students trying it though understandable that many felt there were easier pickings available in paper 22 and moved onto that. Most attempts involved setting up two linear equations and solving them but there was some confusion over values of the random variables and probabilities associated with these values. However over 10% of candidates scored full marks on this question and shoed a good understanding of this topic.
Common mistakes
P(X = 50) = ¼ means R = 3, G = 4 so 3m + 4n = 50
P(X = 20) = 1/6 means R = 2, G = 1 so 2m + n = 20
m = 6, n = 8
confusion between values of X and probabilities (e.g. ¼m + ⅔n = 20)
June 2022 · Paper 3 (Statistics) · Q1(a)3 marks
Mark scheme (whole question; this part is marked with the orange bar)
Examiner's comment
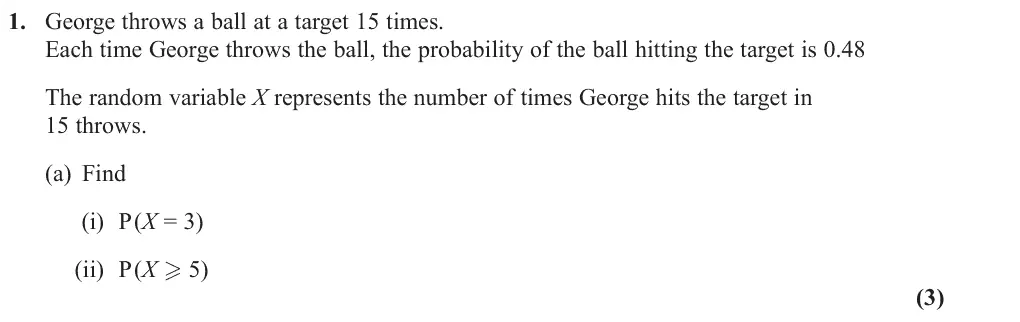
This was generally a good start to the paper for many students with almost all being able to score some of the marks on this question. In part (a) students were usually able to find at least one of the two required probabilities although occasionally they miscopied from their calculator with 0.197 being written down rather than 0.0197. The notation demonstrating use of a binomial distribution was varied. Some students wrote down answers without stating the distribution that was being used, in this instance this was condoned provided that a correct probability was seen, but students should be aware that method marks are often awarded for sight of the correct model. Where full marks were not awarded the most common reasons were, rounding answers to fewer than 3 significant figures, not knowing whether to use Binomial PD or CD on their calculator, or for not knowing how to rewrite ( ) in a form that allowed use of the binomial CD function. X P 5
Common mistakes
state X ~ B(15, 0.48) (method marks are for the model)
(i) binomial pd 0.0197 (not miscopied as 0.197)
(ii) P(X ≥ 5) = 1 − P(X ≤ 4) = 0.920
3 s.f.
June 2022 · Paper 3 (Statistics) · Q1(b)3 marks
Mark scheme (whole question; this part is marked with the orange bar)
Examiner's comment
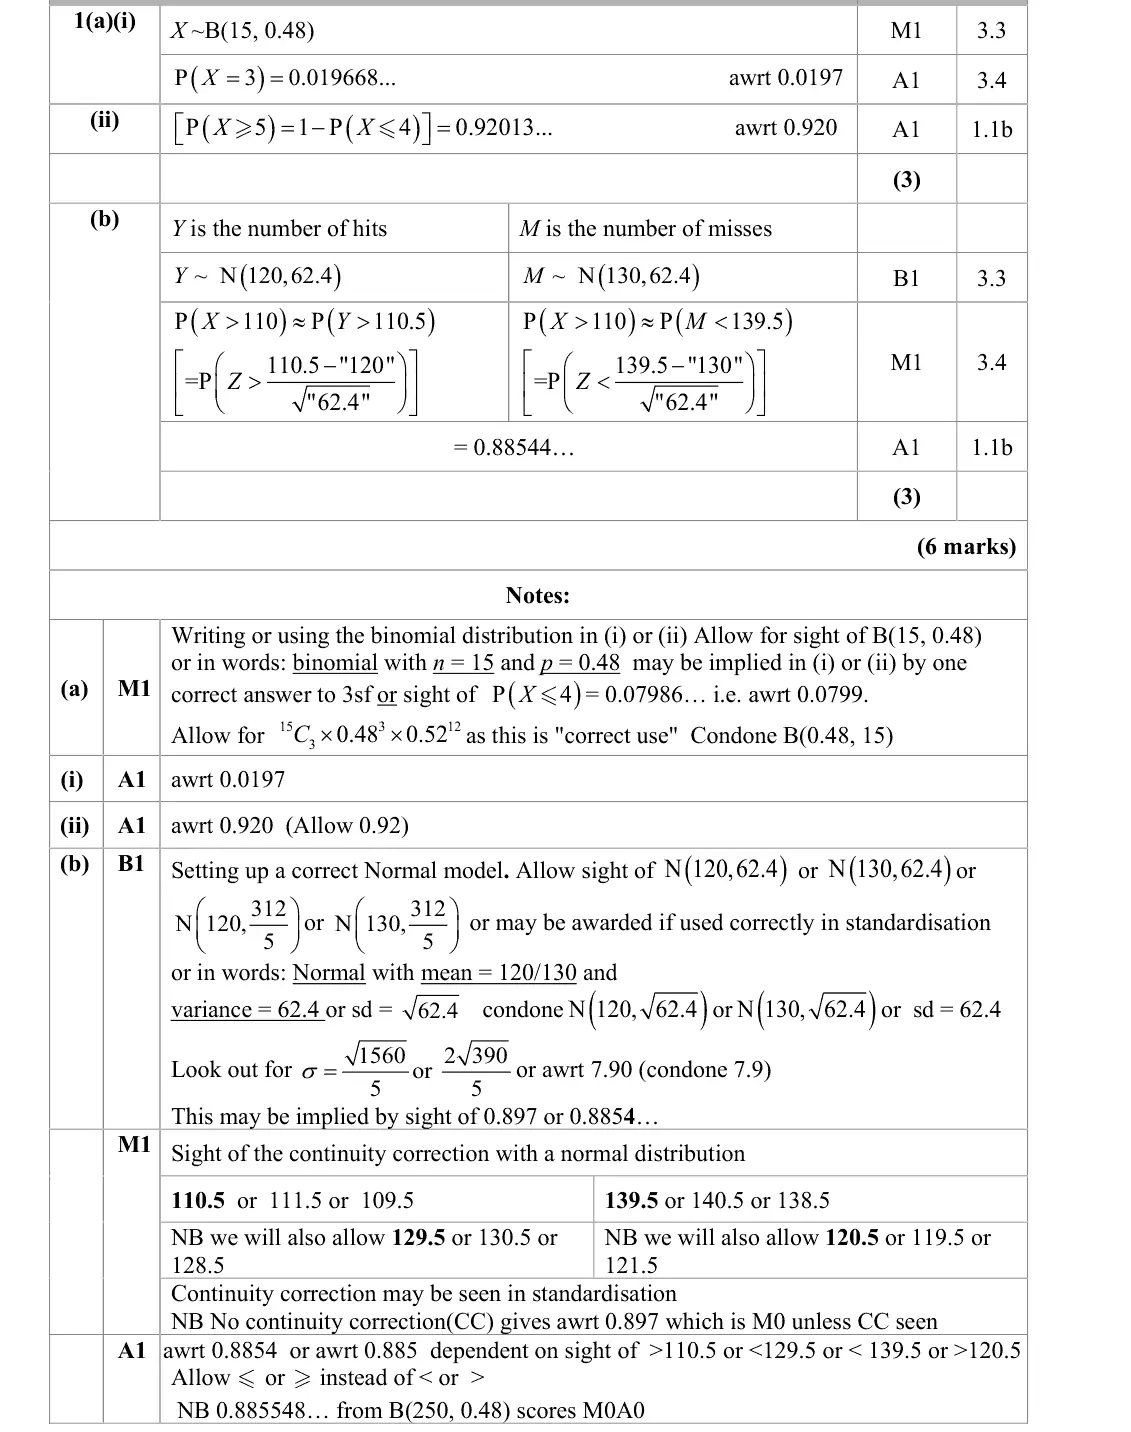
This was generally a good start to the paper for many students with almost all being able to score some of the marks on this question. Part (b) caused more problems for students. The question clearly asked the students to use a normal approximation and most found the correct mean and variance for the Normal distribution and went on to find a probability. There is some confusion about whether it is the variance or the standard deviation which is a parameter of the normal distribution and too many failed to summarise their working with a simple statement N(120, 64.2). Almost all students correctly interpreted “more than 110” as requiring P(X > 110) but a minority of students remembered to use a continuity correction, required when approximating a discrete distribution with the normal distribution, and those that did attempt to use a continuity correction often used an incorrect one, most commonly 109.5. Despite being directed to use a normal approximation by the question some students used the binomial distribution. This gave an answer very close to the one obtained from the correct distribution, so it was very important to write down the distribution used, the probability statement with its continuity correction and give the answer to a sufficient degree of accuracy before rounding.
Common mistakes
N(120, 62.4): 62.4 is the variance, sd = √62.4
continuity correction P(Y > 110.5) = 0.885 (109.5 is a common wrong one
no correction gives 0.897)
an exact binomial answer scores 0
June 2022 · Paper 3 (Statistics) · Q2(d)4 marksMedium
Mark scheme (whole question; this part is marked with the orange bar)
Examiner's comment
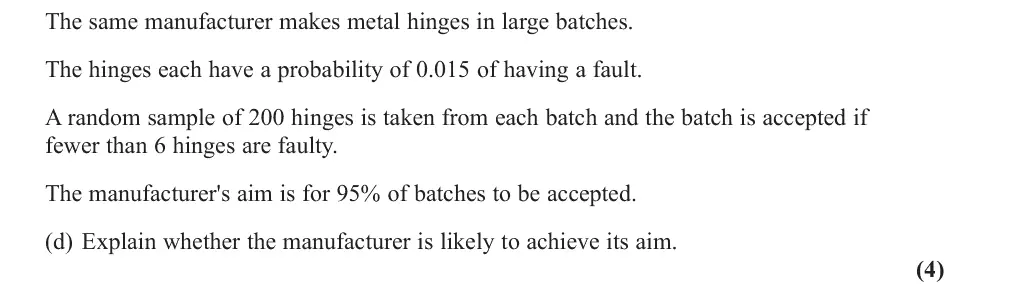
Students who attempted part (d) usually selected the correct Binomial model. A few students, recognising that n was large, used a normal approximation which was not appropriate in this case with very small p. It was common for students to find ( ) P 6 X rather than ( ) P 6 X < . Those who made this error were however still able to access the mark available for a correct interpretation. A minority of the students who gave a correct interpretation did not make the required comparison of their probability with the given 95% aim thus losing the final A mark. Students need to be aware that in questions such as this they should be using the values calculated to justify and explain any conclusions they make. A reasonable proportion of students were confused about what the question was asking and tried to set up a hypothesis test, making a conclusion based on whether they were accepting or rejecting the null hypothesis rather than judging the likelihood of the manufacturer meeting his aim by comparing their probability with the given 95% aim. Some Weaker students simply worked out 6 out of 200 as a percentage and compared this with 5%.
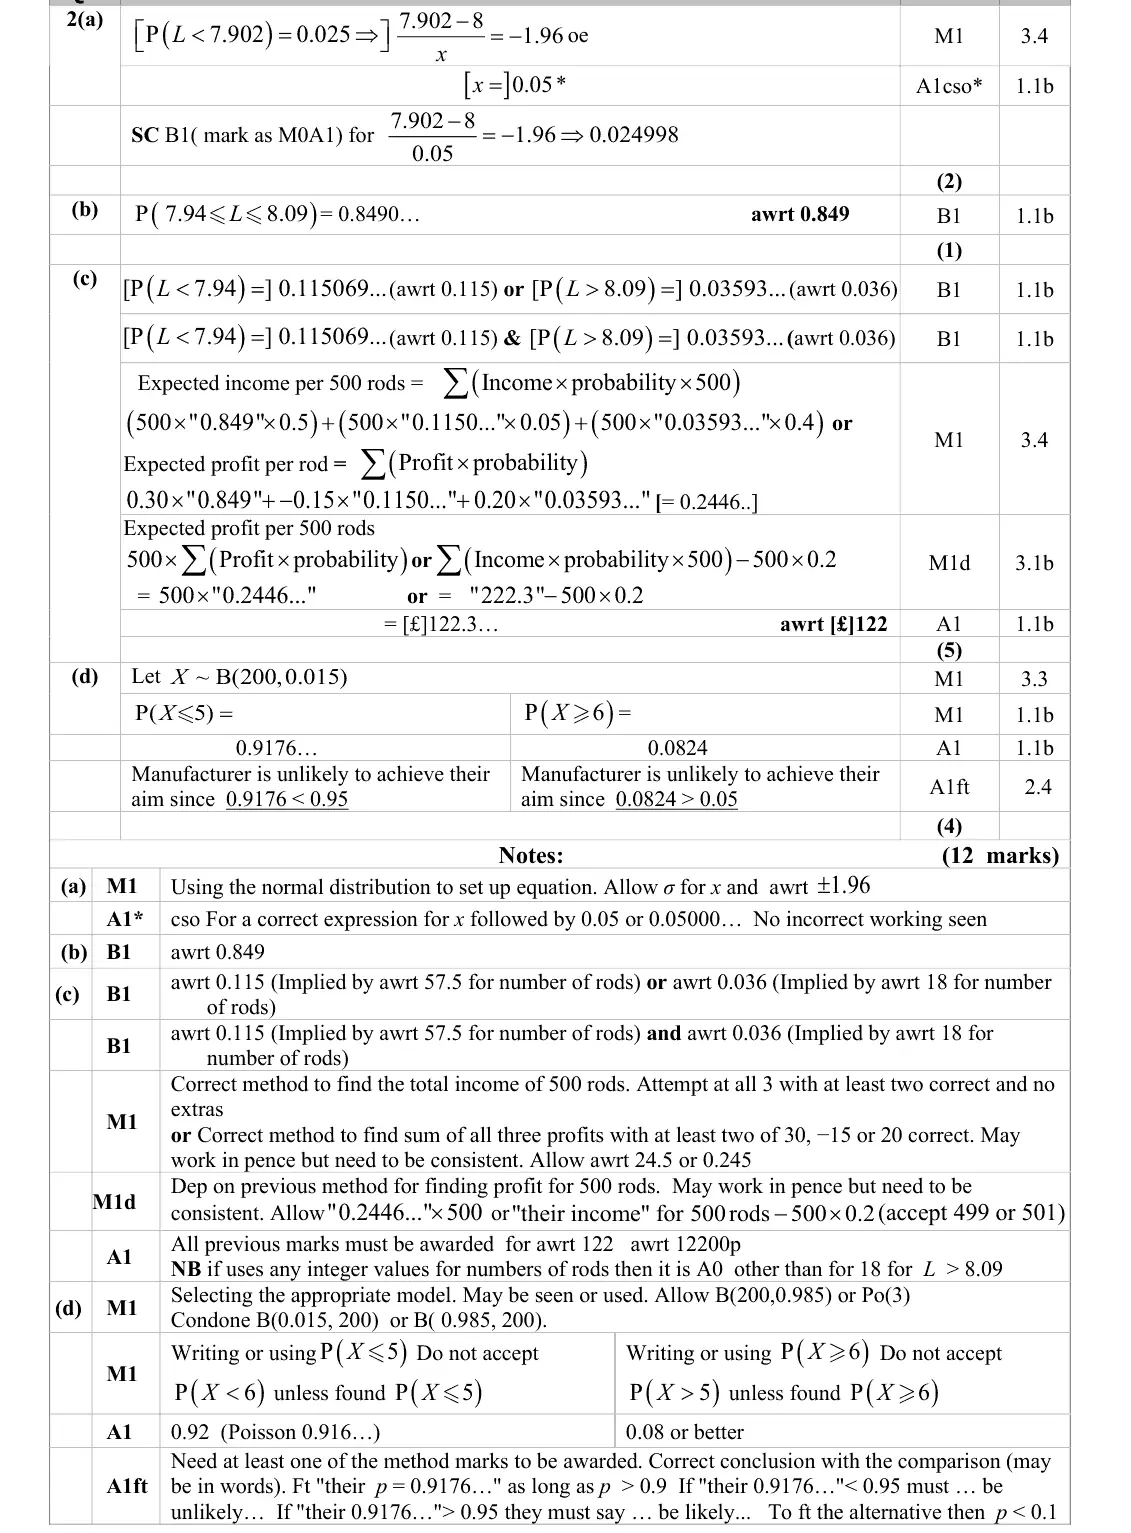
Common mistakes
X ~ B(200, 0.015) (not a normal approximation, p is small)
fewer than 6 means P(X ≤ 5) = 0.918, not P(X ≤ 6)
compare with 0.95 and conclude unlikely
not a hypothesis test
June 2022 · Paper 3 (Statistics) · Q4(b)3 marks
Mark scheme (whole question; this part is marked with the orange bar)
Examiner's comment
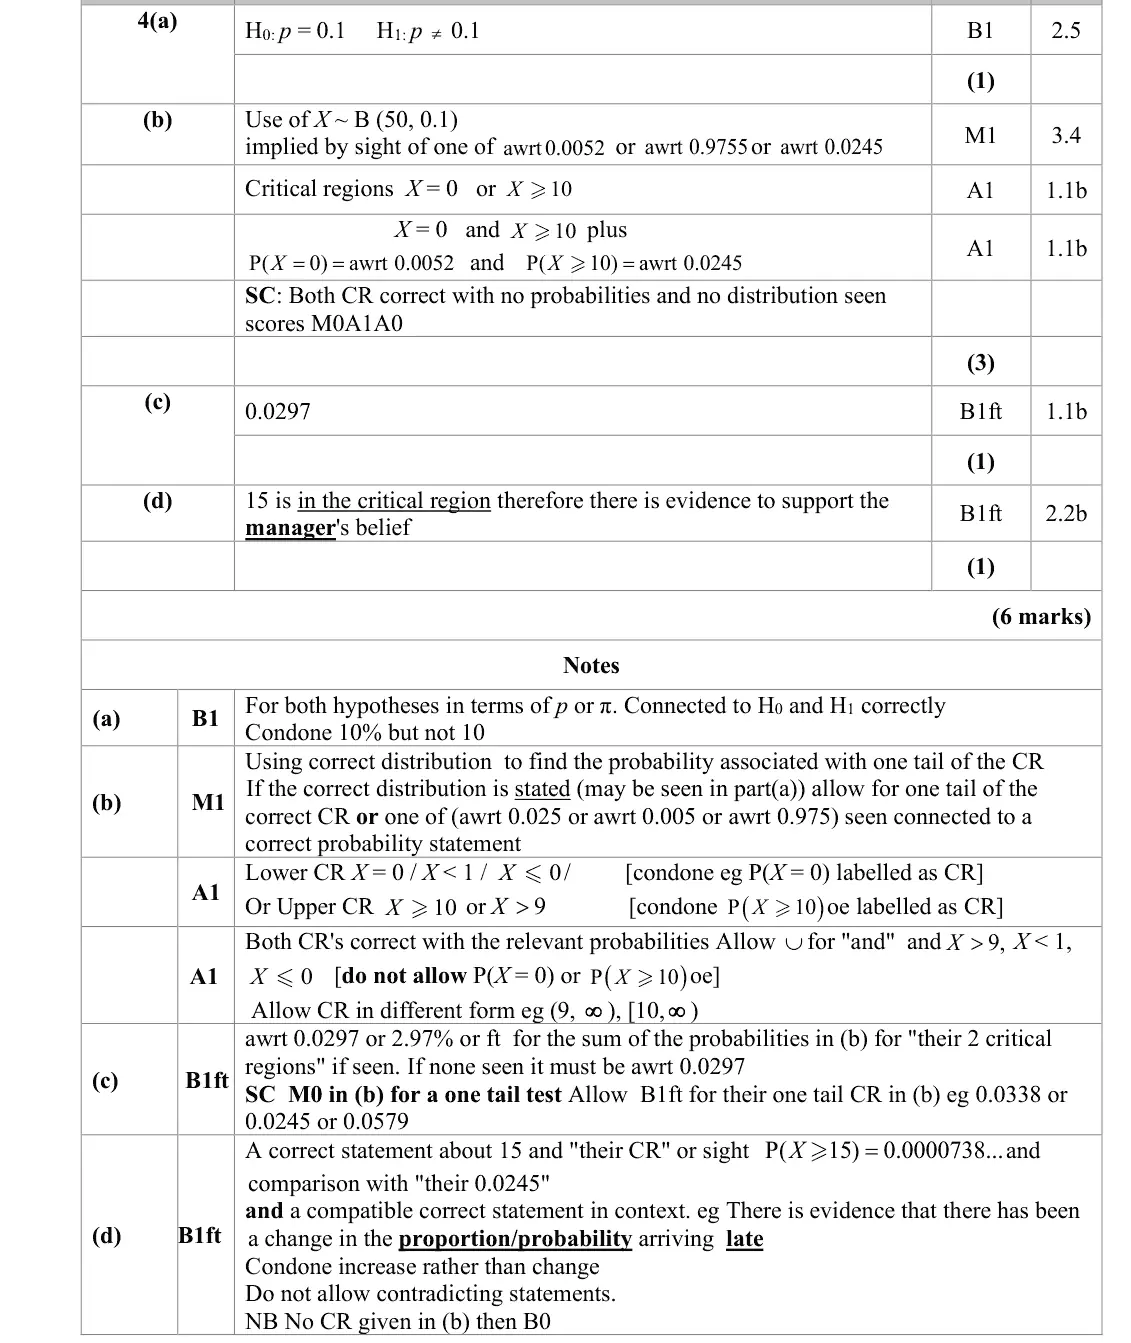
Part (b) proved to be a challenge for many of the students with a reasonable proportion unable to even begin, which is unusual for a question of this nature – as it is quite standard. Most students were able to state the correct distribution and write some probabilities, but many were not able to identify correctly the CR from their probabilities. Responses scoring M1A1A1 were rare. This was often due students giving probability statements rather than giving a CR Other issues included: • giving probabilities to only 2 s.f. • selecting the region between the two Critical values as their CR Students who were aware of what a two-tailed CR looks like almost always got part (c) For those students who stated both tails of the critical region in (b), the majority correctly compared 15 with their critical region and then usually supported the manager. Others used the longer version of the contextual statement and most did so correctly.
Common mistakes
B(50, 0.1)
critical region X = 0 or X ≥ 10 with P(X = 0) = 0.0052 and P(X ≥ 10) = 0.0245
give regions not probability statements
not the region between the critical values
Oct 2021 · AS Paper 2 (Statistics) · Q4(a)1 markEasy
Mark scheme (whole question; this part is marked with the orange bar)
Examiner's comment
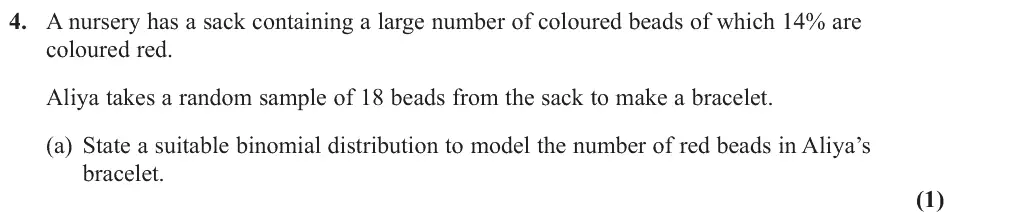
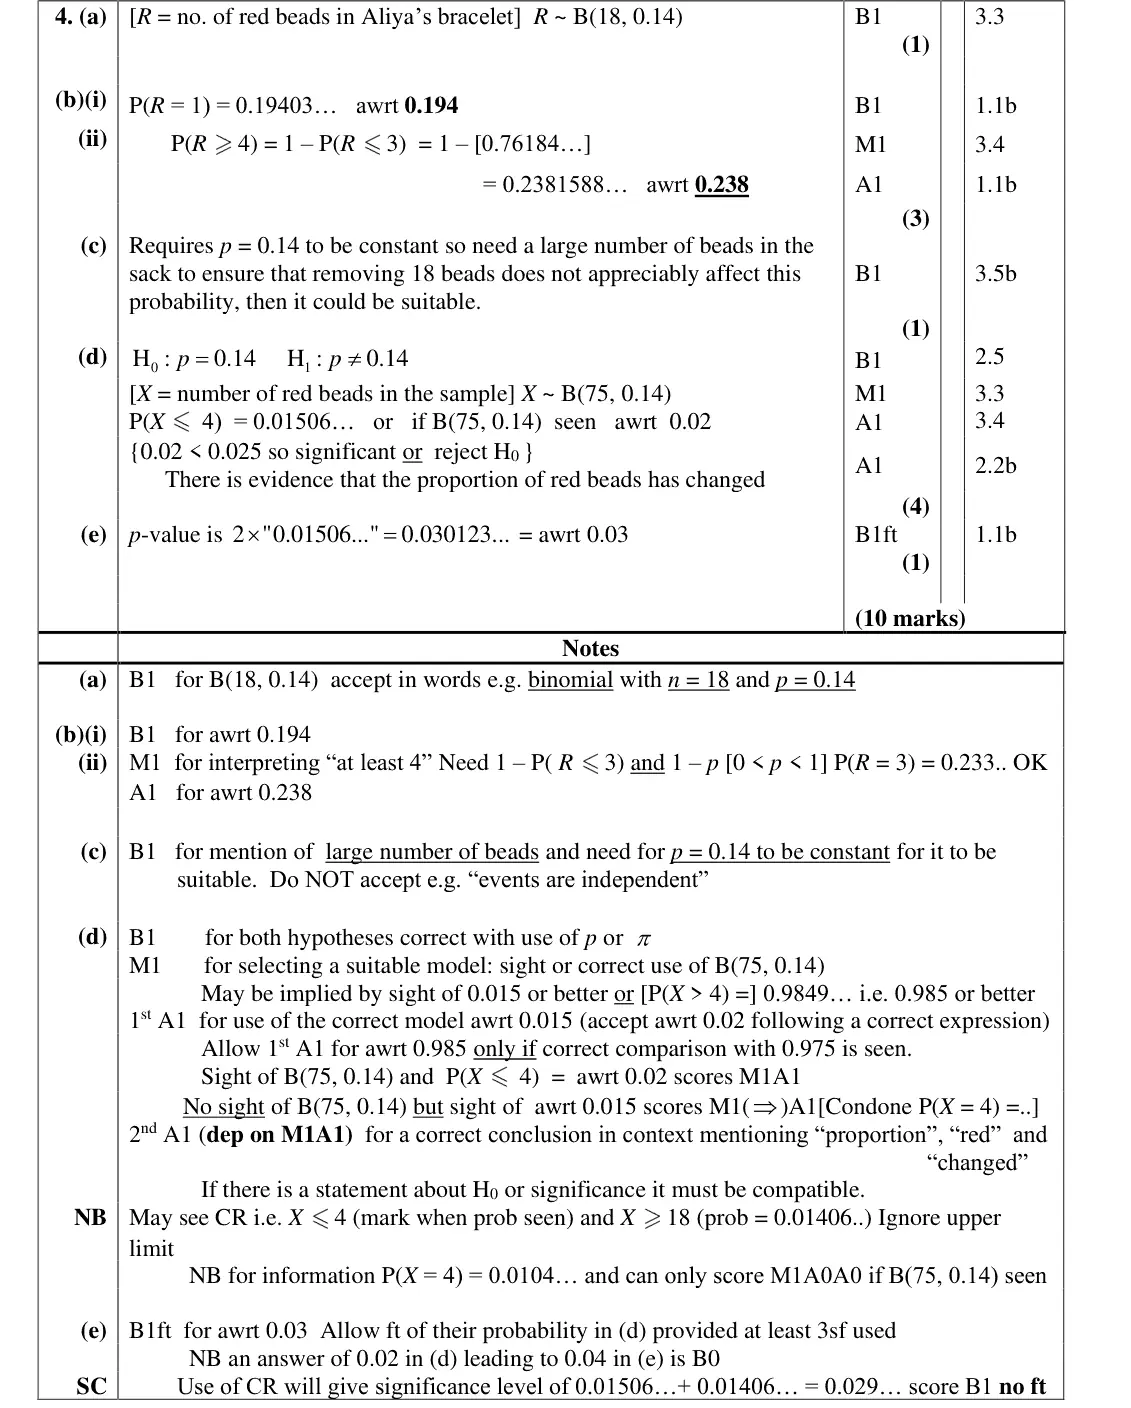
Most students were able to identify the correct binomial model in part (a) and use this to find the probabilities in part (b). However nearly 15% of students failed to score any marks in this question and this
Common mistakes
B(18, 0.14)
Oct 2021 · AS Paper 2 (Statistics) · Q4(b)3 marksMedium
Mark scheme (whole question; this part is marked with the orange bar)
Examiner's comment
probabilities in part (b). However nearly 15% of students failed to score any marks in this question and this is possibly a reflection of the weaker nature of the entry this time. In part (c) students were expected to
Common mistakes
(i) P(R = 1) = 0.194
(ii) at least 4 means 1 − P(R ≤ 3) = 0.238, not 1 − P(R ≤ 4)
Oct 2021 · AS Paper 2 (Statistics) · Q4(c)1 mark
Mark scheme (whole question; this part is marked with the orange bar)
Examiner's comment
is possibly a reflection of the weaker nature of the entry this time. In part (c) students were expected to comment on the suitability of this binomial model and we were looking for a recognition that removing beads without replacement would impact on the assumption that p is constant and so a large number of beads in the sack would be needed to ensure that the binomial distribution could still be used as a model; sadly none of the students scored the mark here.
Common mistakes
p = 0.14 must stay constant: removing beads without replacement changes it unless the sack holds a large number of beads
"events are independent" alone not accepted
almost no candidate scored this
Oct 2021 · Paper 3 (Statistics) · Q1(b)3 marks
Mark scheme (whole question; this part is marked with the orange bar)
Examiner's comment
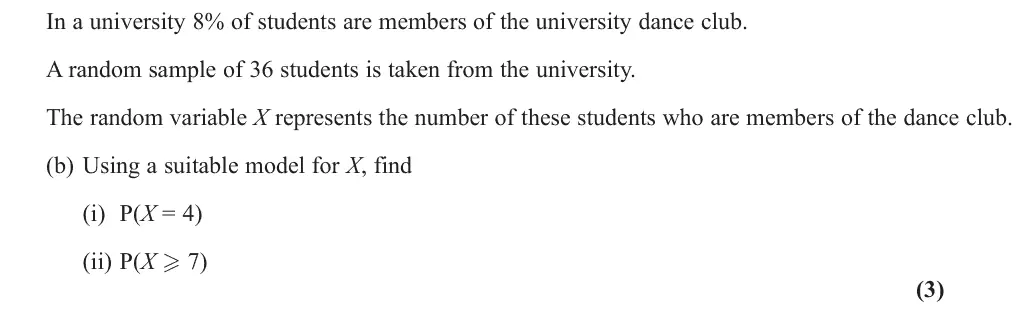
which suggested they were confused about the different types of sampling. Part (b) was generally answered very well with most stating the distribution, and scoring the method mark, and then evaluating part (i) correctly on their calculator. Part (ii) met with less success as many could not deal with the inequality or were unsure how to use their calculator correctly. Some seemed to confuse significant figures with decimal places: the front of the exam paper instructs then to use 3 significant figures but some only gave an answer of 0.022 here and lost this mark. Part (c) was usually answered correctly and many went on to use the
Common mistakes
state B(36, 0.08)
P(X ≥ 7) = 1 − P(X ≤ 6) = 0.0222
give 3 s.f. (0.022 loses the mark)
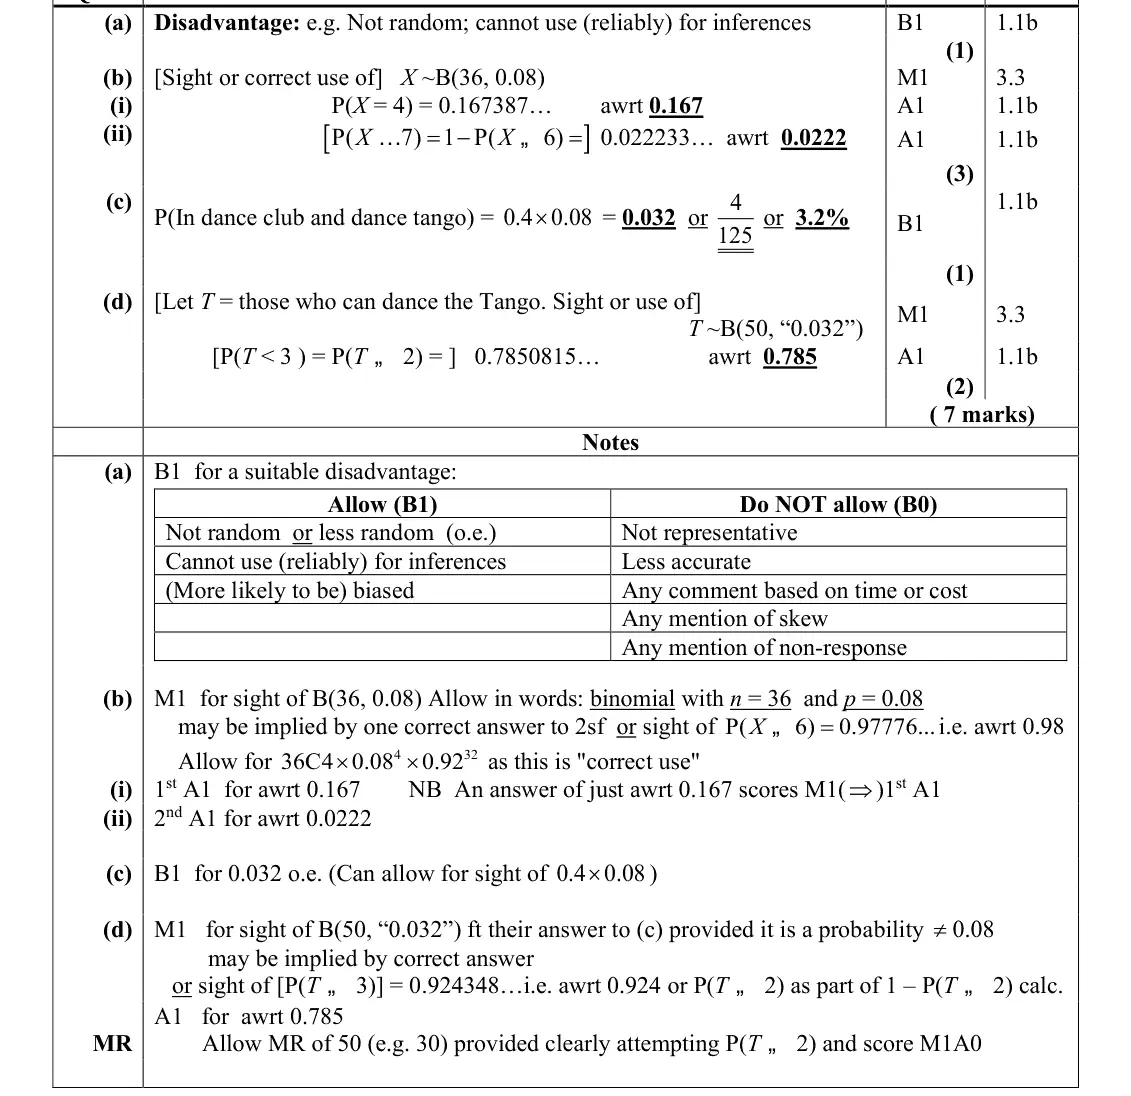
Oct 2021 · Paper 3 (Statistics) · Q1(d)2 marksMedium
Mark scheme (whole question; this part is marked with the orange bar)
Examiner's comment
correct binomial distribution in part (d) though some found interpreting “fewer than 3” a problem and a ). Overall though this proved a good start to the paper common incorrect answer was 0.924 (from P( X 3 and over 40% scored 6 or 7 marks here.
Common mistakes
new model B(50, 0.032) using (c)
fewer than 3 means P(T ≤ 2) = 0.785, not P(T ≤ 3) = 0.924
Oct 2021 · Paper 3 (Statistics) · Q6(a)5 marks
Mark scheme (whole question; this part is marked with the orange bar)
Examiner's comment
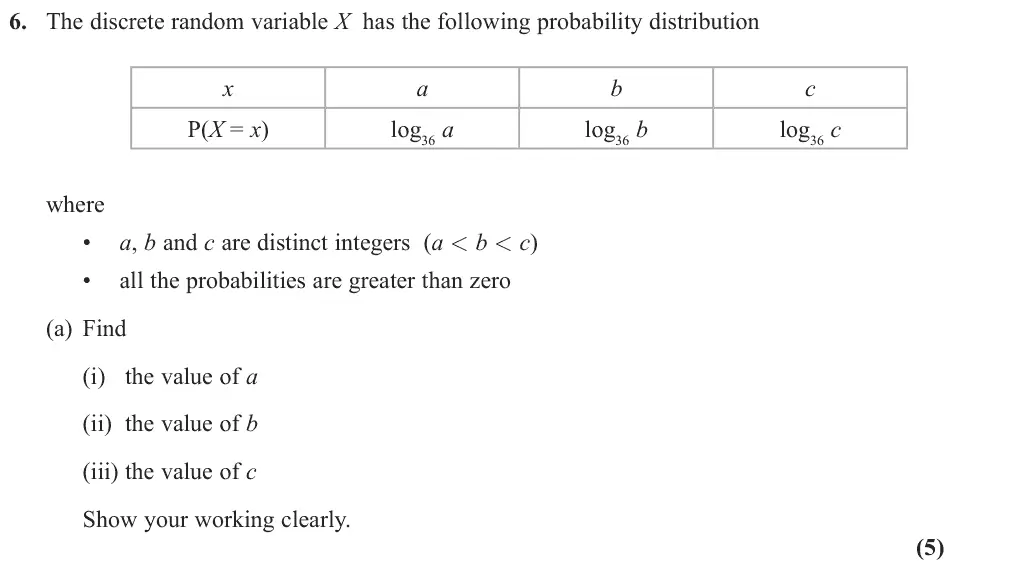
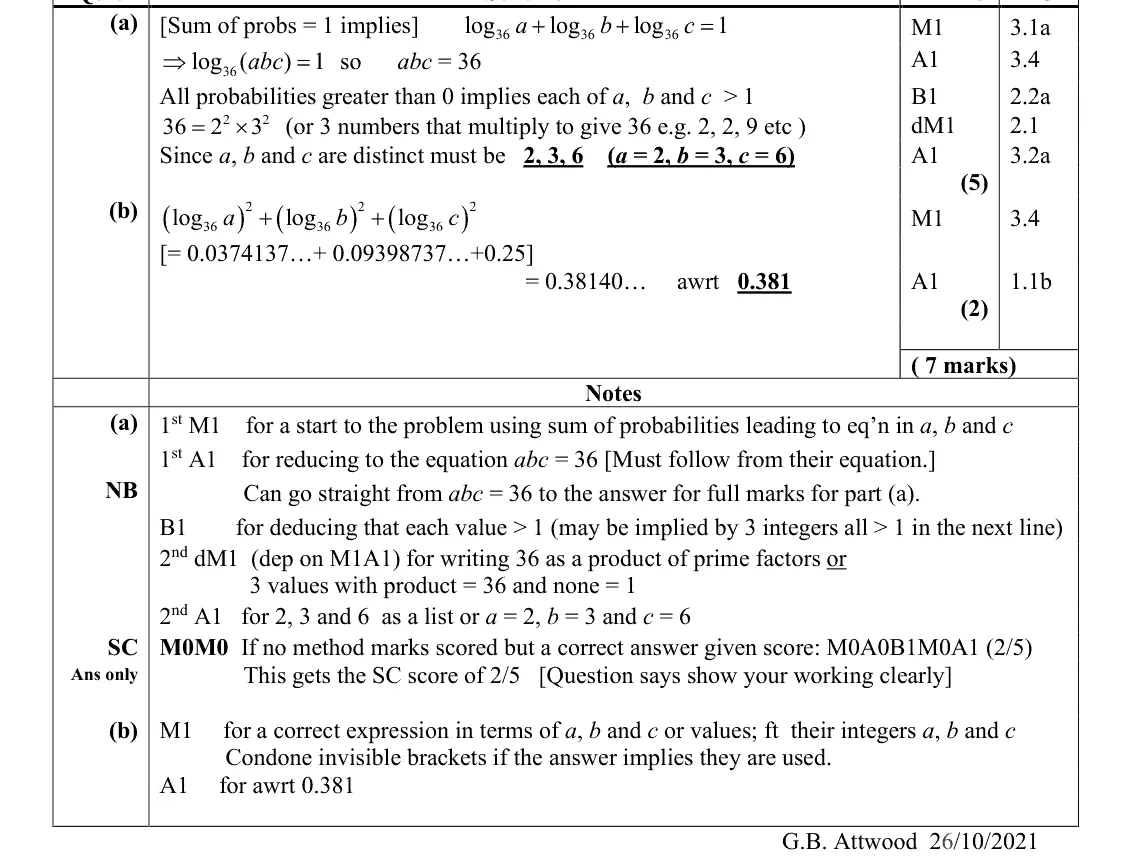
There is a requirement in the specification for questions occasionally to draw together knowledge from different areas of 9MA0 and this was a question aiming to do that. Many students realised that to start the problem they could use the fact that the sum of the probabilities must equal 1 but fewer than half of the students could move beyond that mark. Those who realised they had a sum of logarithms were often able to arrive at the equation abc = 36 but few could devise a strategy to deduce the values of a, b and c. Some stated that all of the values had to be greater than 1 though it was not always clear that they deduced this from the given bullet points in the question. Around a quarter of the
Common mistakes
sum of probabilities = 1 gives log₃₆(abc) = 1 so abc = 36
each probability > 0 so a, b, c > 1
distinct, so 2, 3, 6
working must be shown (answer only 2/5)
Oct 2021 · Paper 3 (Statistics) · Q6(b)2 marksHard
Mark scheme (whole question; this part is marked with the orange bar)
Examiner's comment
students found the correct set of values with varying degrees of explanation on the way. Part (b) was often left blank though the first mark was available without values for a, b and c provided brackets were used correctly for the expression. Nearly 10% managed to score full marks for the question.
Common mistakes
P(X₁ = X₂) = sum of squared probabilities (log₃₆a)² + (log₃₆b)² + (log₃₆c)² = 0.381
brackets needed
Oct 2020 · AS Paper 2 (Statistics) · Q36 marks
Mark scheme (whole question; this part is marked with the orange bar)
Examiner's comment
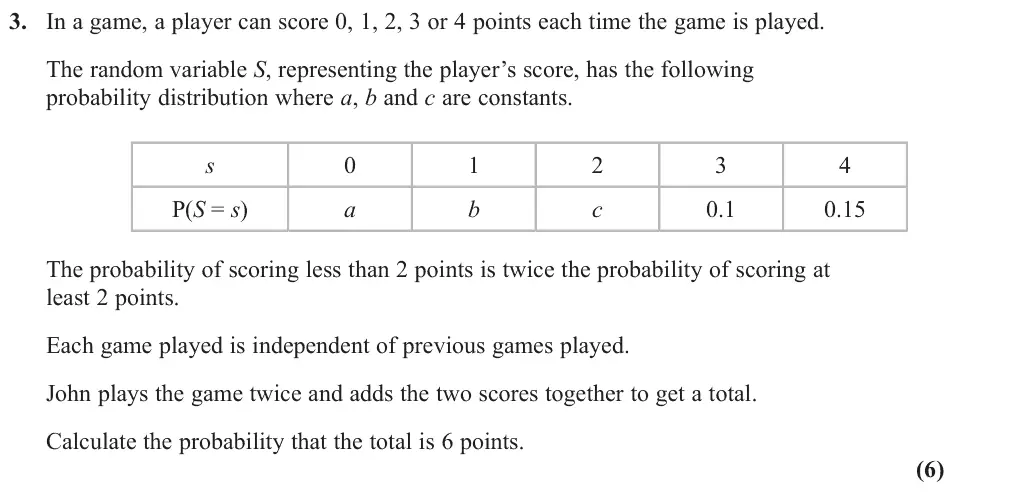
There were some very good solutions given to this question with clear and organised working but there were many others with a correct statement lurking amid a pile of detritus. Candidates need to plan a course of action before writing numbers down. The most common error was to double the wrong set of probabilities, but there were still marks to be gained in further working. There were too many candidates who did not see the need to use the sum of probabilities as part of a solution. The candidates who reached the latter stages generally found the correct ways in which to obtain a total of 6. One of the more frequent errors in finding the total of 6 was think that there are two ways of arranging 3,3.
Common mistakes
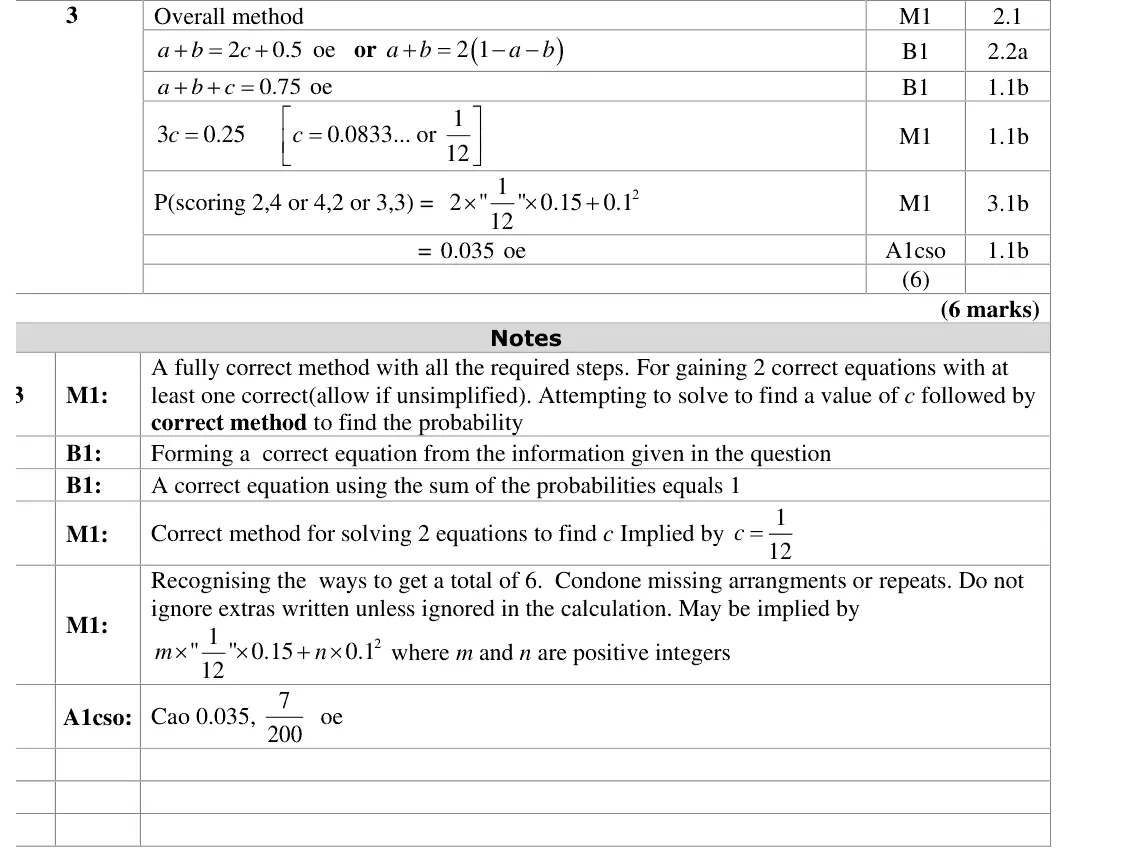
form a + b = 2(c + 0.25) and a + b + c = 0.75 (sum of probabilities = 1, often missed) to get c = 1/12
total 6 from (2,4), (4,2), (3,3): 2 × c × 0.15 + 0.1² = 0.035
doubling the wrong set of probabilities
(3,3) counted twice
Oct 2020 · AS Paper 2 (Statistics) · Q5(a)2 marks
Mark scheme (whole question; this part is marked with the orange bar)
Examiner's comment
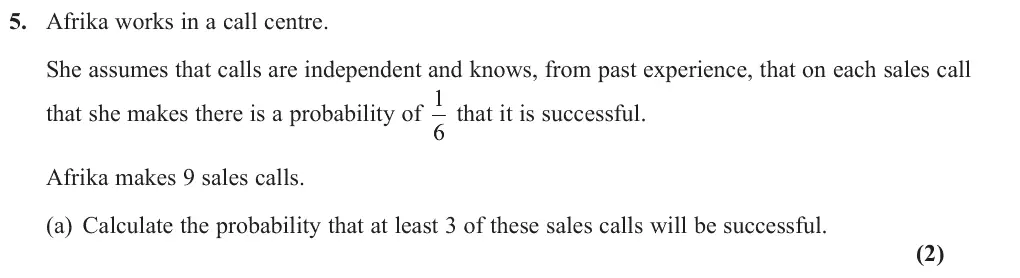
This question required the binomial distribution and it was pleasing to see that around 65% of candidates were able to recognise the distribution required in part(a) with approximately 50% being able to work out the correct probability. (a) and (b) and that in order to do part(b) you need the answer to part (a). The 1 most common error was using the distribution B 45, 6 Again in part (c) many candidates gave the correct model, but fewer were able
Common mistakes
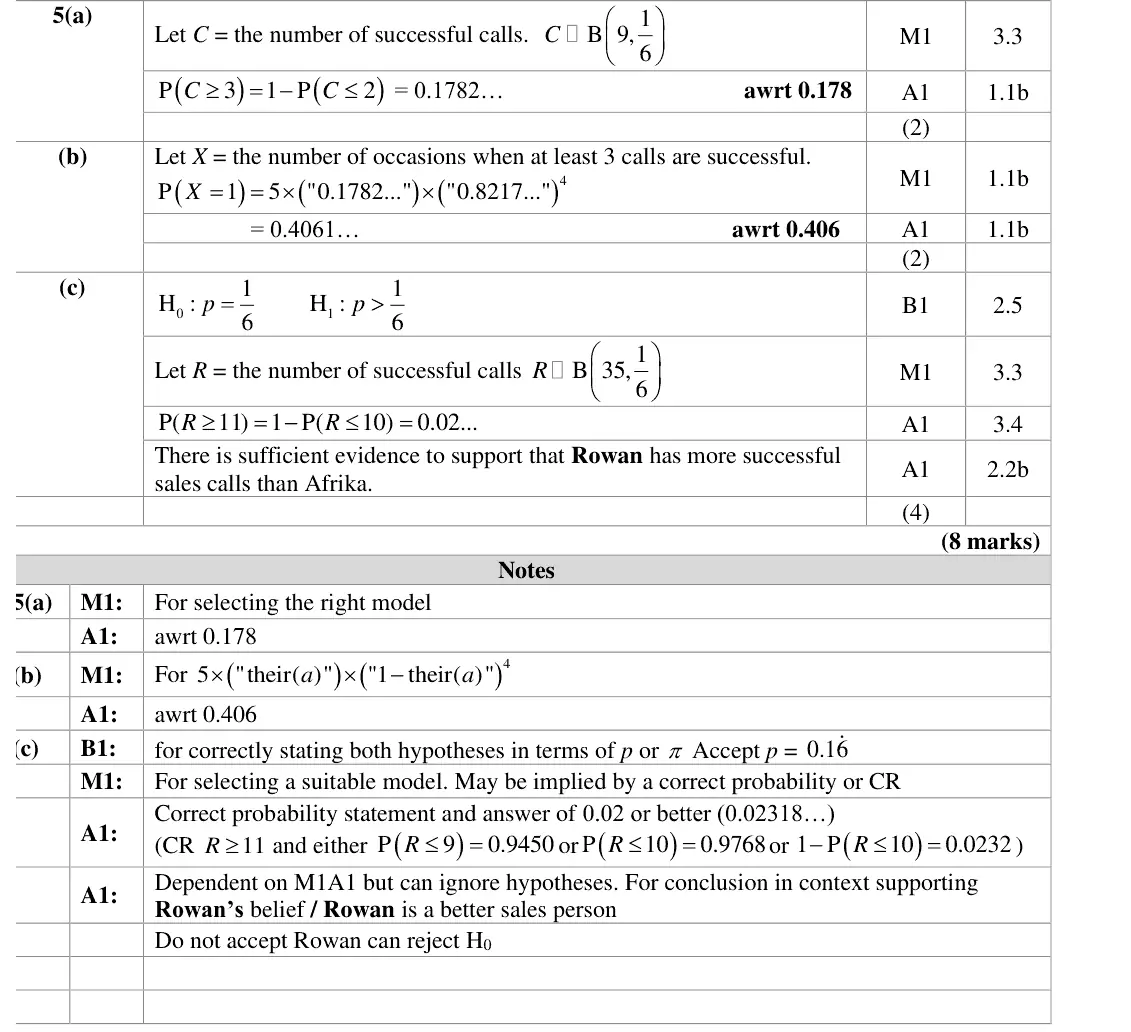
C ~ B(9, 1/6)
P(C ≥ 3) = 1 − P(C ≤ 2) = 0.178
Oct 2020 · AS Paper 2 (Statistics) · Q5(b)2 marks
Mark scheme (whole question; this part is marked with the orange bar)
Examiner's comment
This question required the binomial distribution and it was pleasing to see that around 65% of candidates were able to recognise the distribution required in In part (b) few candidates recognised that there was a connection between parts (a) and (b) and that in order to do part(b) you need the answer to part (a). The 1 most common error was using the distribution B 45, 6 Again in part (c) many candidates gave the correct model, but fewer were able
Common mistakes
second binomial on days: 5 × 0.178 × 0.822⁴ = 0.406
few saw the link to (a)
common error B(45, 1/6)
Oct 2020 · AS Paper 2 (Statistics) · Q5(c)4 marks
Mark scheme (whole question; this part is marked with the orange bar)
Examiner's comment
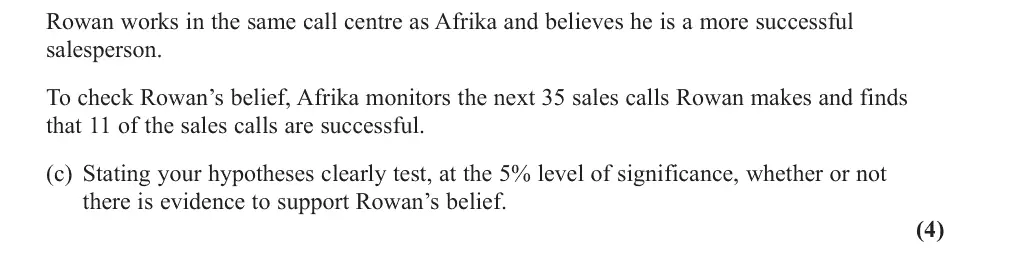
This question required the binomial distribution and it was pleasing to see that around 65% of candidates were able to recognise the distribution required in Again in part (c) many candidates gave the correct model, but fewer were able to write down the hypotheses correctly. Of those who progressed to the end, most evaluated the required probability, but a not insubstantial minority worked out the probability of exactly eleven. The great majority of those who found the correct probability then went on to give the correct answer in context.
Common mistakes
H0: p = 1/6, H1: p > 1/6 in terms of p
R ~ B(35, 1/6)
P(R ≥ 11) = 0.0232 < 0.05 (not P(R = 11))
conclusion in context supporting Rowan's belief, "reject H0" alone not enough
Oct 2020 · Paper 3 (Statistics) · Q4(a)2 marks
Mark scheme (whole question; this part is marked with the orange bar)
Examiner's comment
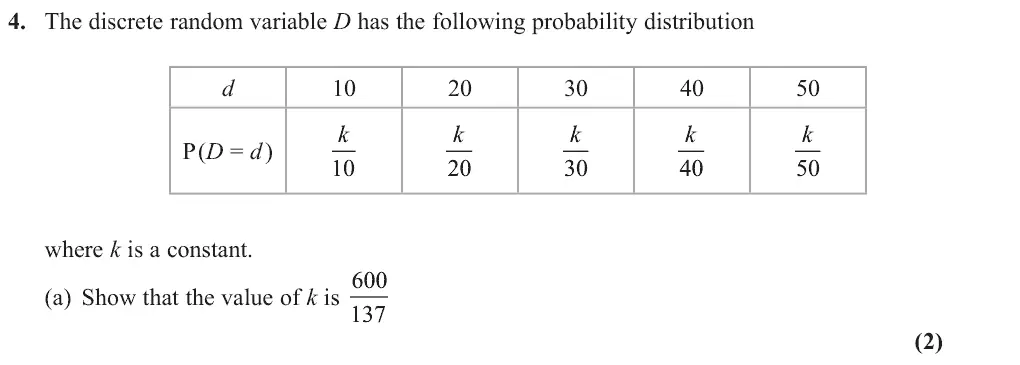
Part (a) was generally answered very well. Being a “show that” question meant that we needed to see a full explanation and most clearly showed the sum of the probabilities equal to 1 and then solved the resulting equation to find k. Failing to show this key step usually meant that no marks could be awarded. A significant number of students left the rest of the question blank but those who did make an attempt were usually able to identify some, though rarely all, the cases in (b). Finding the probabilities was more of
Common mistakes
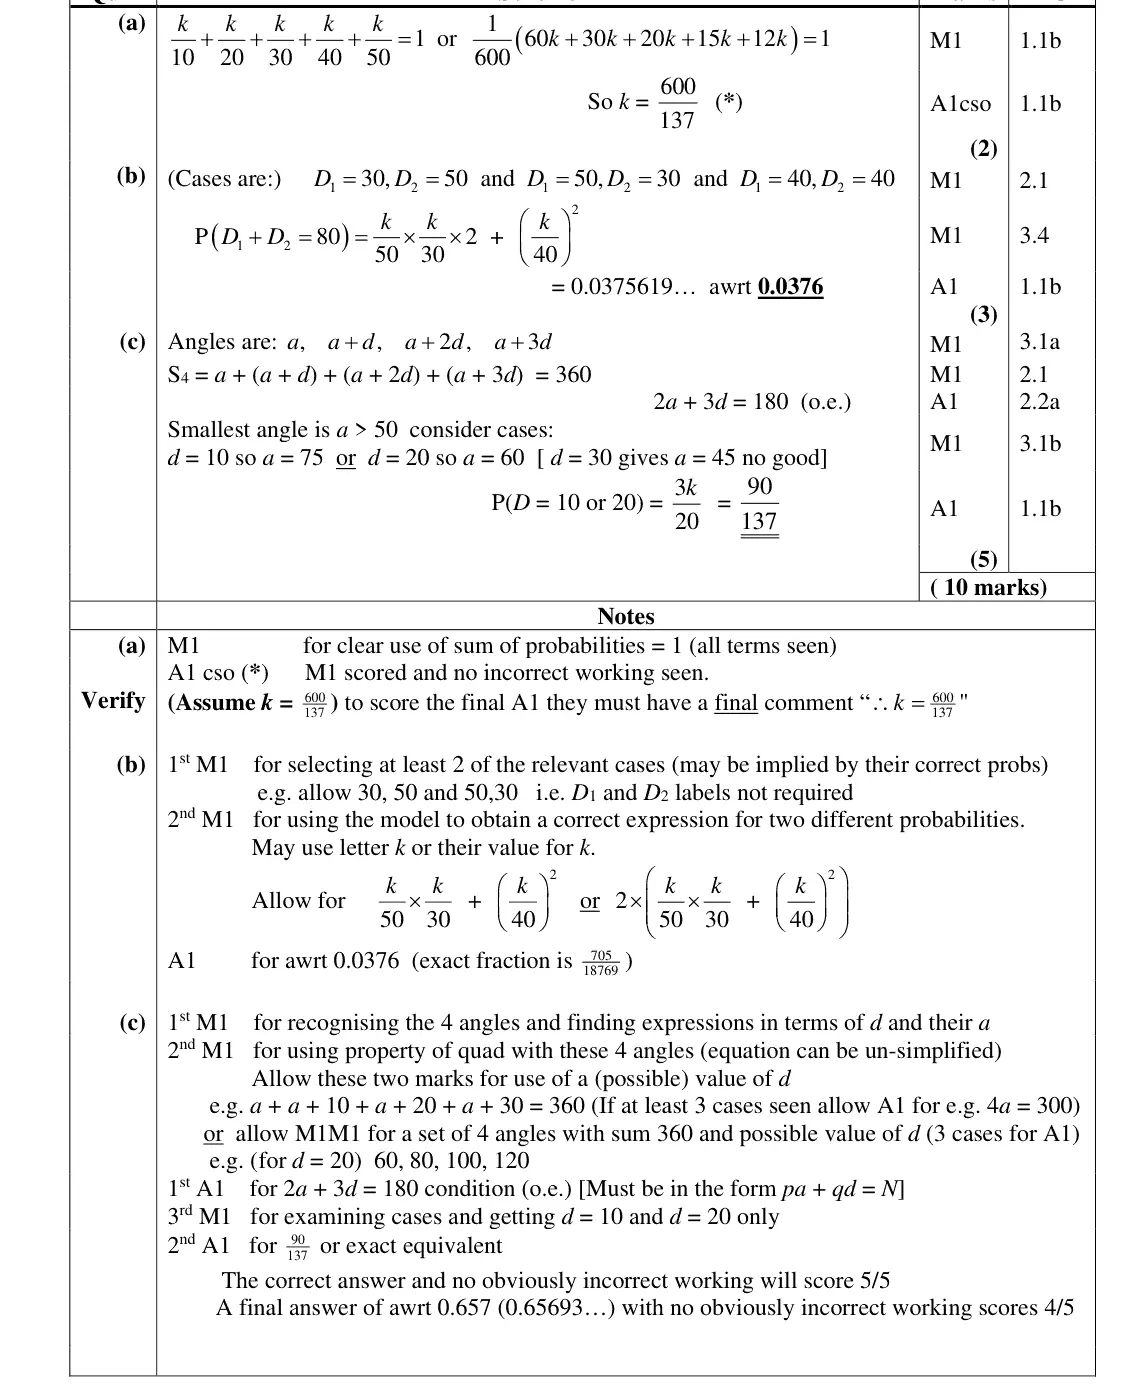
sum of all five probabilities = 1 with every term seen
final statement k = 600/137
Oct 2020 · Paper 3 (Statistics) · Q4(b)3 marks
Mark scheme (whole question; this part is marked with the orange bar)
Examiner's comment
identify some, though rarely all, the cases in (b). Finding the probabilities was more of a problem with some using P(D = 50) + P(D = 30) rather than the product and those having correct probabilities for all 3 cases were quite rare. It was good to see many students who had faltered on (b) still making a start on part (c). Many identified the 4
Common mistakes
three cases: (30, 50), (50, 30), (40, 40)
multiply probabilities for independent events (not add)
0.0376
Oct 2020 · Paper 3 (Statistics) · Q4(c)5 marks
Mark scheme (whole question; this part is marked with the orange bar)
Examiner's comment
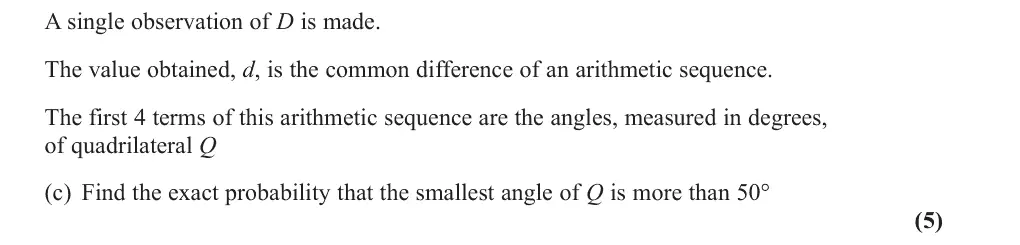
students who had faltered on (b) still making a start on part (c). Many identified the 4 angles as terms of an arithmetic series and some were able to reach the condition 2a + 3d = 180 (or equivalent) but many could not see how to complete the problem. Some used the information that a > 50 to reach d < 80 3 but were unable to make the connection that this meant that only the two cases d = 10 and d = 20 were required and so the probability could simply be written down.
Common mistakes
angles a, a + d, a + 2d, a + 3d sum to 360 so 2a + 3d = 180
a > 50 only for d = 10 or 20
P(D = 10 or 20) = 3k/20 = 90/137 exact
June 2019 · AS Paper 2 (Statistics) · Q3(a)1 markMedium
Mark scheme (whole question; this part is marked with the orange bar)
Examiner's comment
Whilst over half of candidates were able to score at least 3 marks on this question, only 3% went on to achieve full marks. Virtually all candidates struggled to name the distribution in part (a) with the vast majority opting for ‘binomial’. It would appear that the ‘uniform’ distribution is a topic unfamiliar to many candidates.
Common mistakes
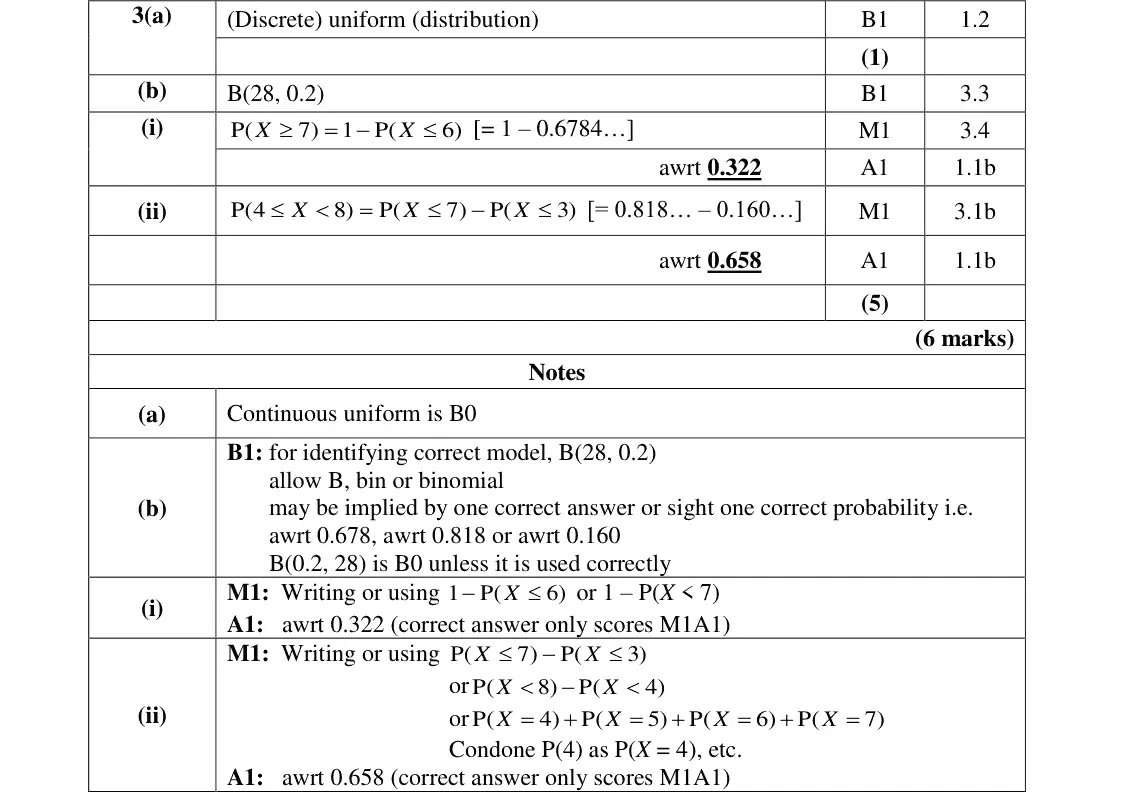
(discrete) uniform distribution
most wrongly said binomial
continuous uniform is B0
June 2019 · AS Paper 2 (Statistics) · Q3(b)5 marksMedium
Mark scheme (whole question; this part is marked with the orange bar)
Examiner's comment
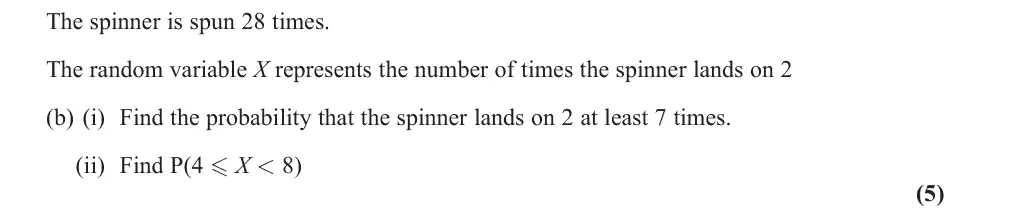
Whilst over half of candidates were able to score at least 3 marks on this question, only 3% went on to achieve full marks. Virtually all candidates struggled to name the distribution in Part (b)(i) was well answered as most candidates correctly identified the binomial distribution required here and confidently used 1 – P(X <= 6) to calculate P(X >= 7). Usual errors were seen, notably attempting 1 – P(X <= 7). Whilst there was some good use of calculators seen, a significant amount of candidates are still calculating these probabilities out by hand in full which costs them a large amount of time. Candidates are expected to use their calculators to find binomial probabilities and cumulative probabilities from the binomial distribution. Part (b)(ii) was more discriminating and correct attempts here were rare. The most common mistake was made by those candidates who found P(X <= 7) and subtracted {1 – P(X <= 3)} from it. Those candidates who wrote out the required probabilities in full, i.e. P(X = 4) + P(X = 5) + P(X = 6) + P(X = 7), tended to score full marks.
use calculator cumulative functions rather than summing by hand
June 2019 · AS Paper 2 (Statistics) · Q5(c)2 marksHard
Mark scheme (whole question; this part is marked with the orange bar)
Examiner's comment
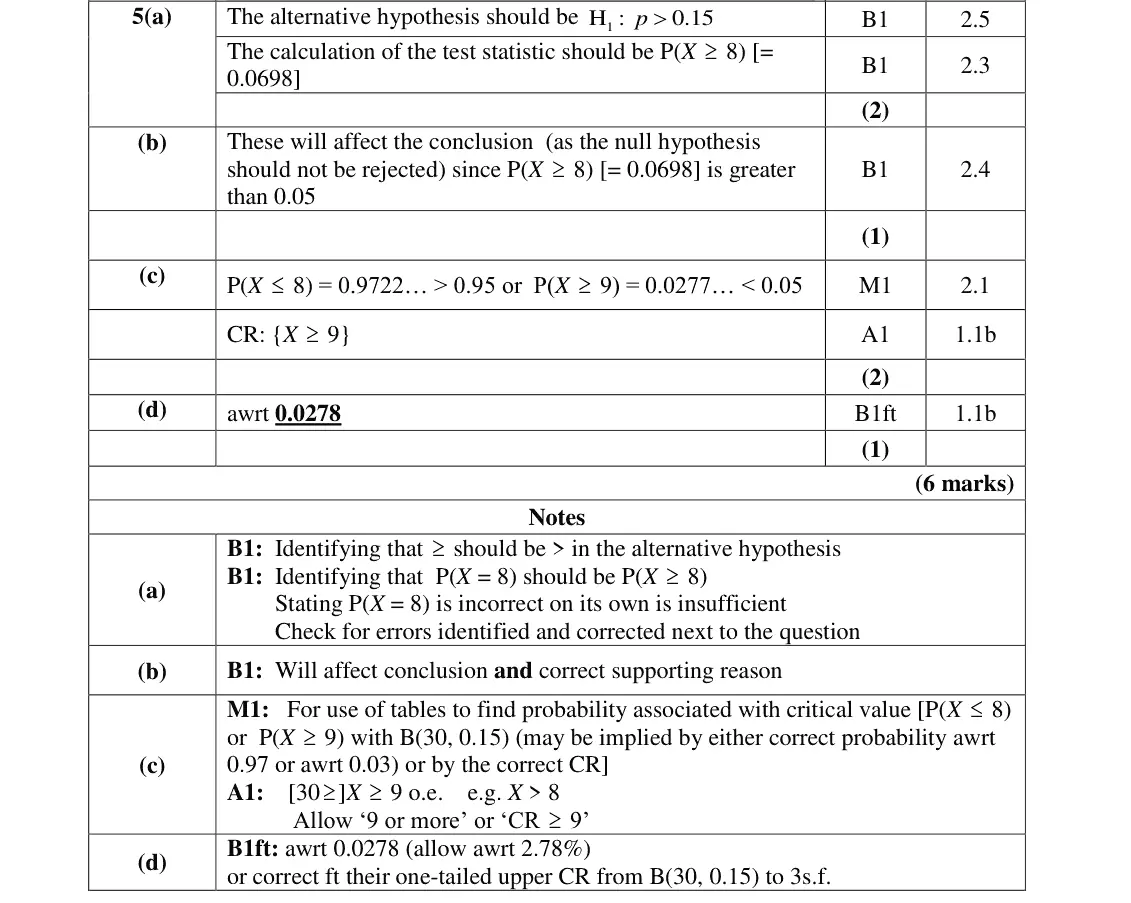
Only the most able candidates on the paper made significant progress through this question Despite the question stating the test should be one-tailed in part (c) some candidates found a two-tail critical region or went for the left hand tail rather than the right hand one. Where the upper tail was found the critical region was usually correct although some gave a critical value rather than a region or wrote it as a probability i.e. P(X >= 9). Some candidates rewrote Julia’s hypothesis test correctly at this point, not appreciating the difference between this and a critical region approach. Part (d) was usually correctly done by those who were successful in part (c). On some occasions answers were given only to two significant figures. Just over 5% of candidates scored full marks on the final question on this paper.
CR X ≥ 9 (not a two-tailed or lower tail region, not P(X ≥ 9) as a probability, not just the critical value)
June 2019 · Paper 3 (Statistics) · Q4(b)(i)2 marks
Mark scheme (whole question; this part is marked with the orange bar)
Examiner's comment
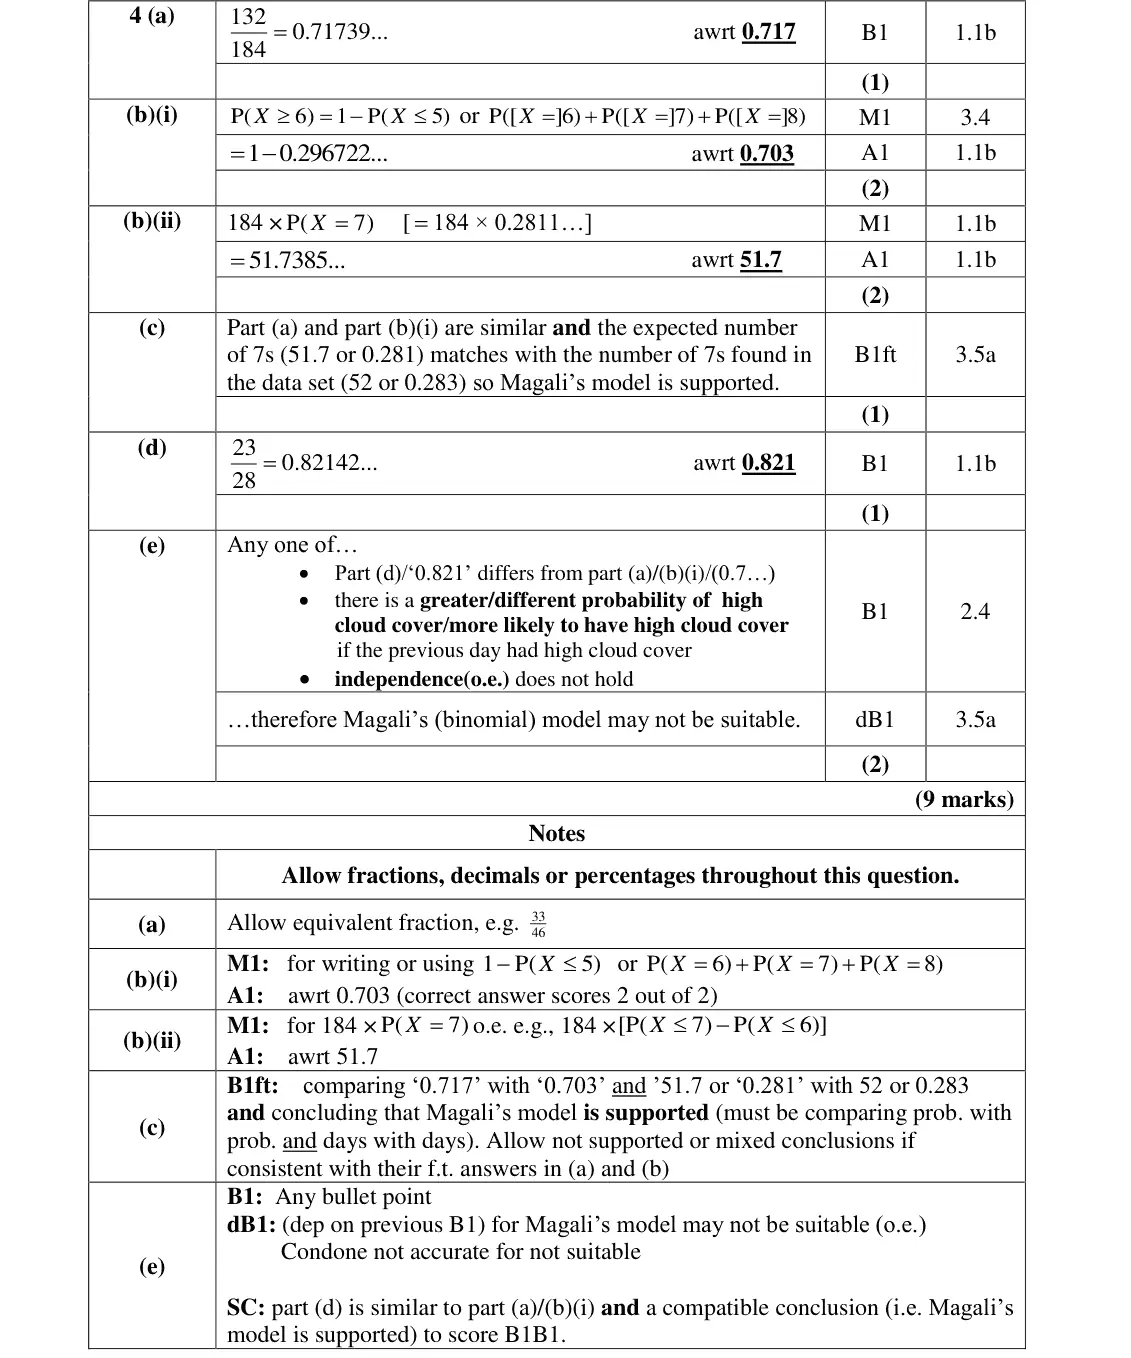
This question demonstrated that most candidates are confident in carrying out statistical calculations, particularly probabilities, but only the most able are confident in interpreting in In part (b)(i) most candidates scored both marks, usually going down the route of 1 – P(X <= 5) and rounding to a minimum of three significant figures. Where mistakes were seen they were generally down to the accuracy of the rounding (only to two significant figures) or those who had attempted P(X=6) or incorrectly assumed P(X >= 6) = 1 – P(X <= 6).
June 2019 · Paper 3 (Statistics) · Q4(b)(ii)2 marks
Mark scheme (whole question; this part is marked with the orange bar)
Examiner's comment
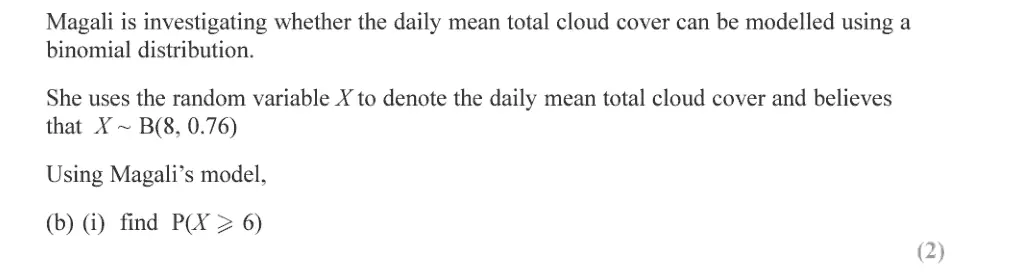
This question demonstrated that most candidates are confident in carrying out statistical calculations, particularly probabilities, but only the most able are confident in interpreting in In part (b)(ii) while candidates rarely had difficulty finding P(X=7) they frequently went no further, despite the question’s requirement for the expected value.
Common mistakes
184 × P(X = 7) = 51.7
many stopped at P(X = 7)
June 2019 · Paper 3 (Statistics) · Q4(c)1 mark
Mark scheme (whole question; this part is marked with the orange bar)
Examiner's comment
This question demonstrated that most candidates are confident in carrying out statistical calculations, particularly probabilities, but only the most able are confident in interpreting in Part (c) was not particularly well attempted by candidates with many leaving it out completely. Where there was a clear attempt those failing to score the mark usually only compared one set of the values, generally the 51.7 and the 52. Most who attempted part (d) scored the mark.
Common mistakes
compare 0.717 with 0.703 and 51.7 with 52 (probability with probability, days with days) and conclude the model is supported
comparing only one pair
June 2019 · Paper 3 (Statistics) · Q5(b)3 marks
Mark scheme (whole question; this part is marked with the orange bar)
Examiner's comment
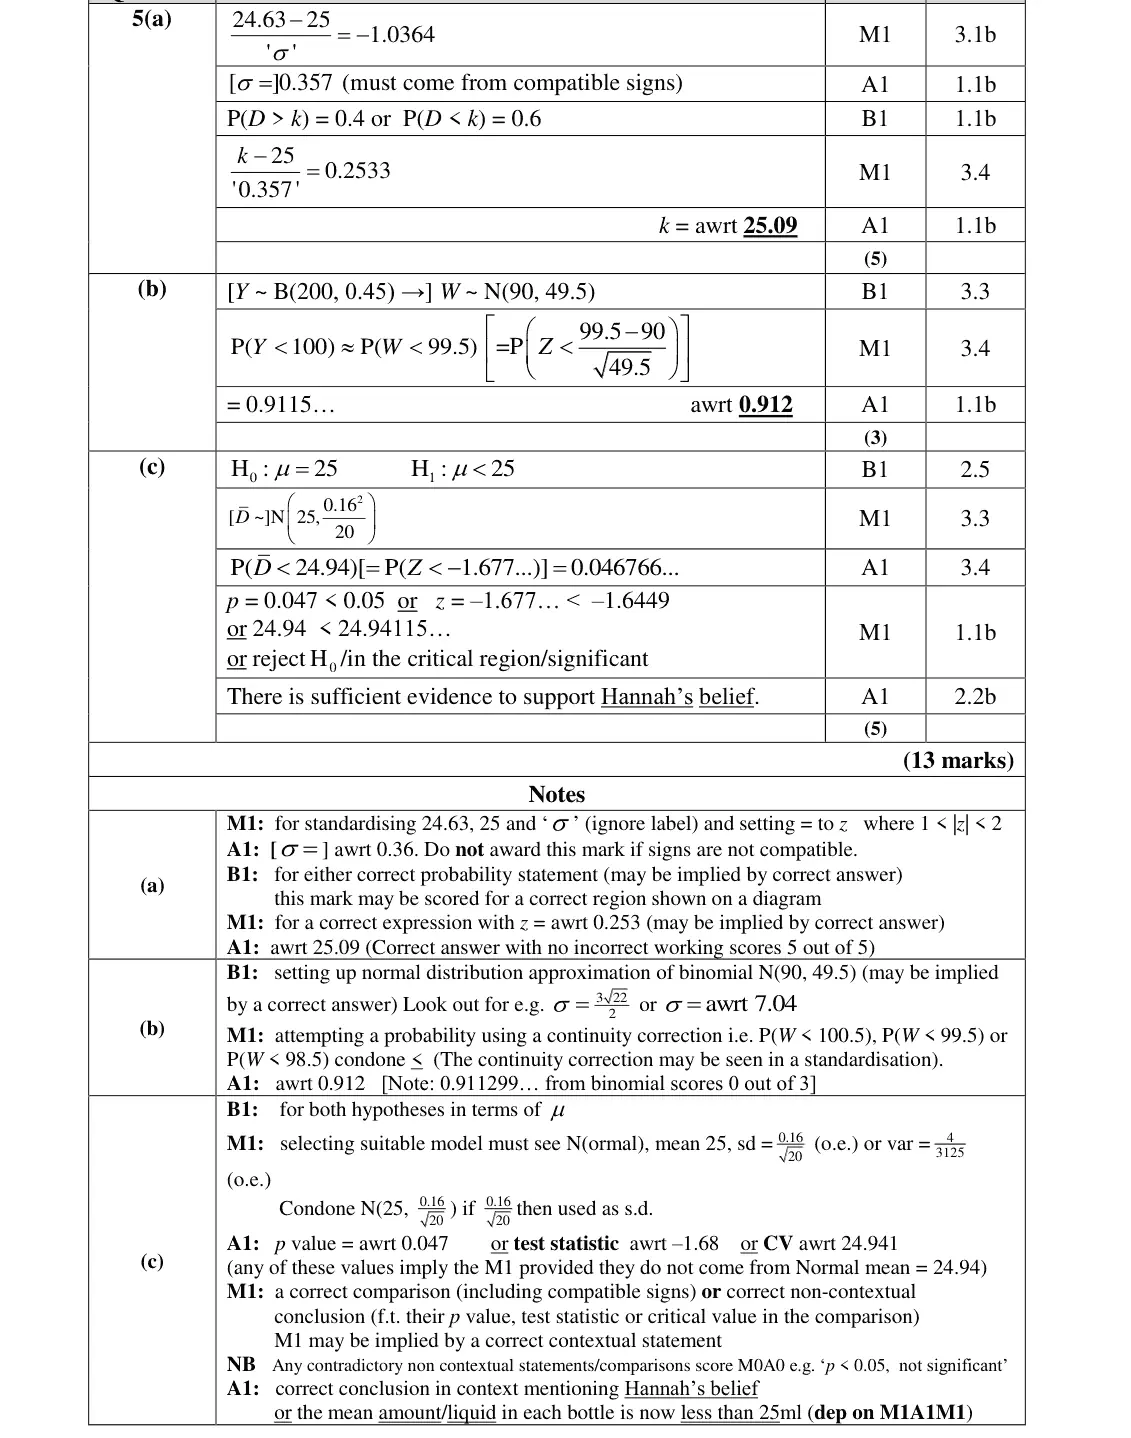
This question as whole proved to be one of the more challenging questions on the paper with many candidates unable to make any meaningful attempt at any part of the question. Part (b) was one of the most discriminating parts of the entire paper. There were a range of errors seen. Many failed to set up the correct Normal approximation and many tried to use the model found in part (a). Some appeared to struggle with the phrase ‘fewer than half’. It was also quite common to see candidates ignore the request for an approximation and complete the question using the binomial distribution given in the question. Candidates need to be aware that they will not be awarded marks for using the binomial distribution to calculate a probability if they have been asked to use an approximation. Candidates who did manage to set up the correct Normal distribution often made errors with the continuity correction, either they made no attempt to use one or they used one in the wrong direction.
Common mistakes
Y ~ B(200, 0.45) approximated by N(90, 49.5)
fewer than half: P(W < 99.5) = 0.912 with continuity correction
an exact binomial answer scores 0
do not reuse the model from (a)
June 2018 · AS Paper 2 · Q3(a)3 marks
Mark scheme (whole question; this part is marked with the orange bar)
Examiner's comment
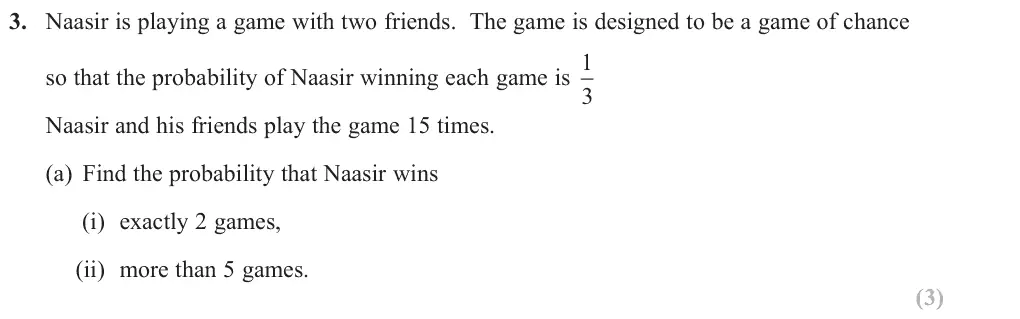
In the new specification, students are required to evaluate binomial probabilities using their calculators. Some students seemed to be unaware of this and although they could answer part (a)(i) using a formula, part (ii) was not feasible that way . In the hypothesis test in part (b), the hypotheses
Common mistakes
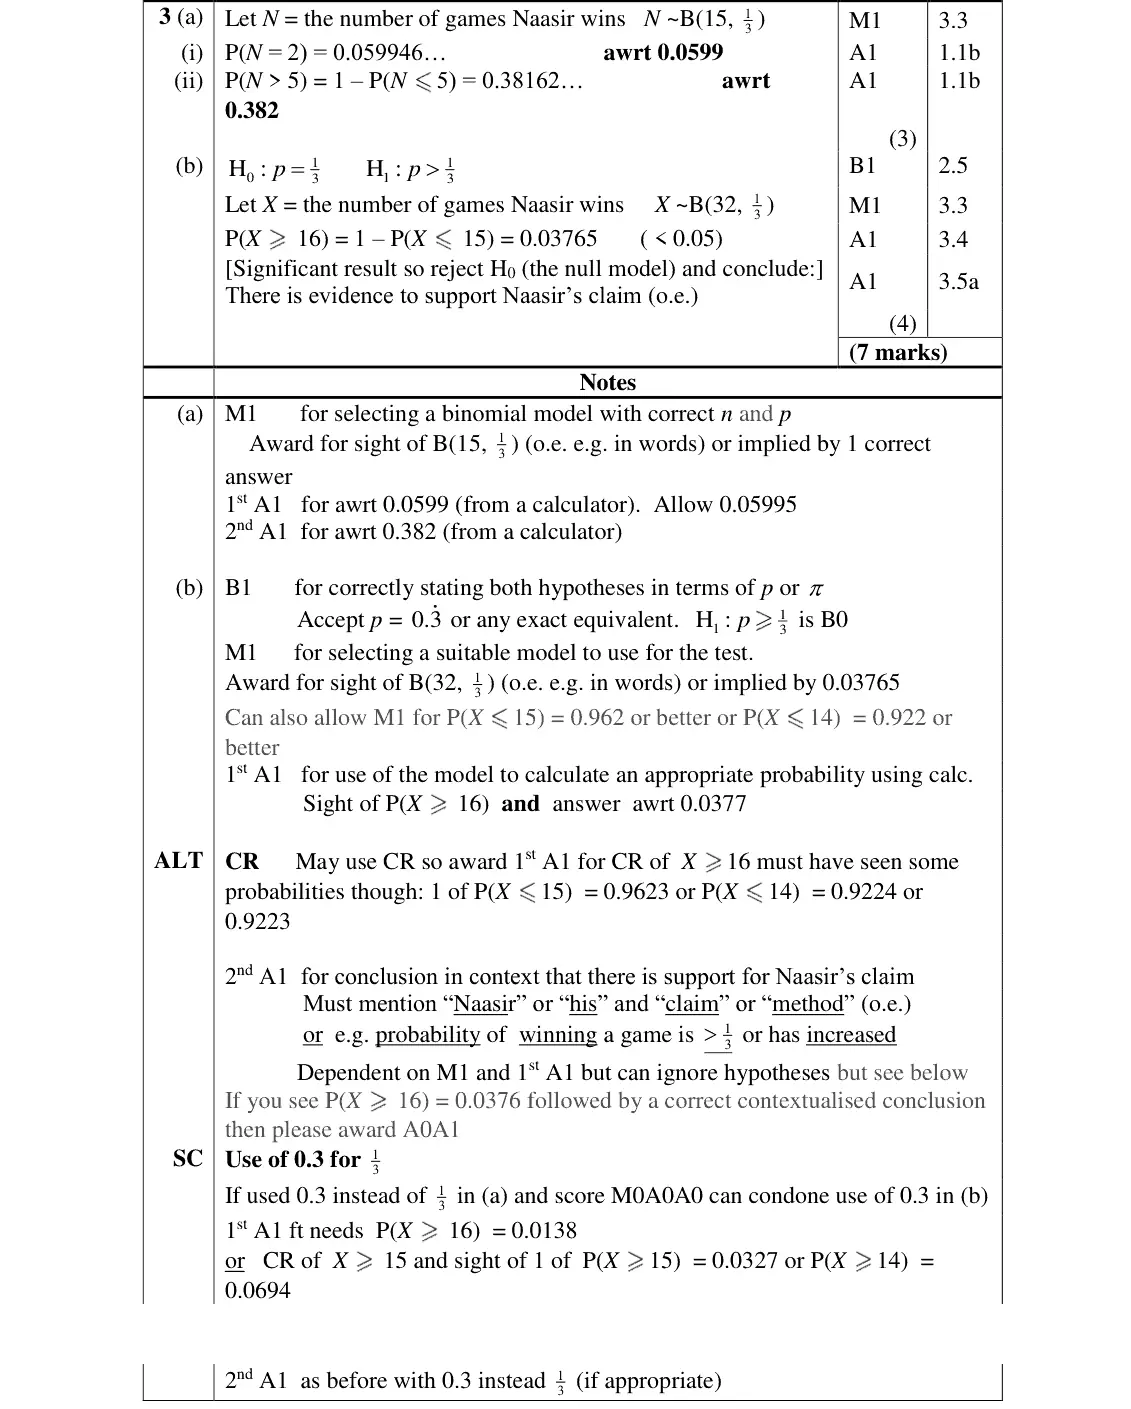
N ~ B(15, 1/3)
P(N = 2) = 0.0599
P(N > 5) = 1 − P(N ≤ 5) = 0.382
use the calculator's binomial functions (part (ii) is not feasible by formula)
June 2018 · AS Paper 2 · Q3(b)4 marks
Mark scheme (whole question; this part is marked with the orange bar)
Examiner's comment
In the new specification, students are required to evaluate binomial probabilities using their using a formula, part (ii) was not feasible that way . In the hypothesis test in part (b), the hypotheses were usually given in terms of p and most identified the correct model to use B(32, 1 3 ). A correct probability calculation did not always follow: some found P(X = 16) instead of P(X … 16) and we would usually expect values to be given to 3 significant figures, but some students gave no value at all simply stating that the probability was < 0.05. In order to award the mark we do need sufficient evidence that the correct value has been obtained. The final mark of a hypotheses test will always require a correct conclusion in context: in this case a statement saying there is evidence to support Naasir’s claim is all that we expected.
Common mistakes
H0: p = 1/3, H1: p > 1/3 (not p ≥ 1/3)
X ~ B(32, 1/3)
P(X ≥ 16) = 0.0377 < 0.05, not P(X = 16)
give the probability value, not just "< 0.05"
conclusion in context: evidence to support Naasir's claim
June 2018 · AS Paper 2 · Q5(a)2 marks
Mark scheme (whole question; this part is marked with the orange bar)
Examiner's comment
There were a number of blank responses here which may have been due to a shortage of time as students wanted to make sure they had time to complete the mechanics section of the paper. Those who did attempt the question sometimes struggled with interpreting the meaning of P(X = r) = P(X = r + 2) and this would often lead them to an incorrect probability distribution. Many did realise that P(X = 2) = P(X = 4) = 0.35 and were then able to find the other two probabilities = 0.15
Common mistakes
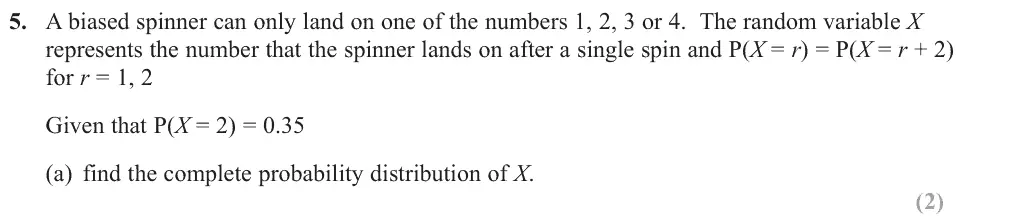
P(X = 4) = P(X = 2) = 0.35, then P(X = 1) = P(X = 3) = 0.15 so the probabilities sum to 1
misreading P(X = r) = P(X = r + 2)
June 2018 · AS Paper 2 · Q5(b)3 marks
Mark scheme (whole question; this part is marked with the orange bar)
Examiner's comment
In part (b) they needed to use their calculators again to calculate a cumulative binomial probability and also needed to appreciate the discrete nature of the distribution to find 1 – P(A „ 30) and once again we expect answers to be given to 3 significant figures. The final part required students to either
Common mistakes
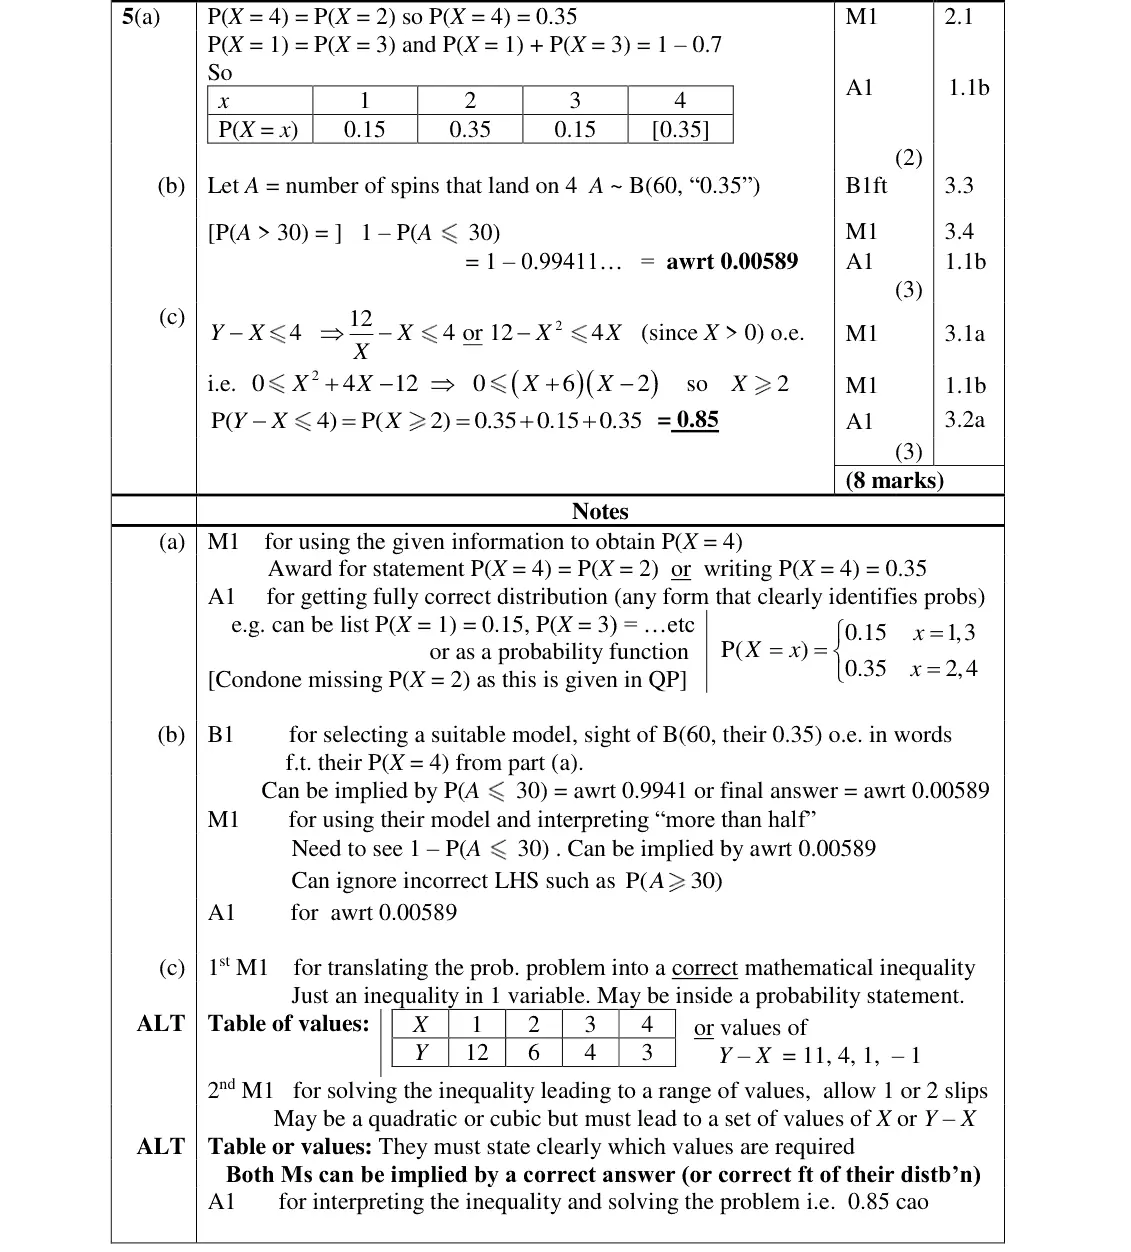
A ~ B(60, 0.35)
more than half means P(A > 30) = 1 − P(A ≤ 30) = 0.00589 (3 s.f.)
June 2018 · AS Paper 2 · Q5(c)3 marksMedium
Mark scheme (whole question; this part is marked with the orange bar)
Examiner's comment
again we expect answers to be given to 3 significant figures. The final part required students to either form a list of values for Y , or even Y – X, or solve an inequality to realise that they needed P(X …2). Some were able to do this and this proved to be a good discriminator on this section. SECTION B: MECHANICS Introduction A significant proportion of the students were poorly prepared and showed little understanding of basic mechanics and displayed poor algebraic/numerical skills. There were a number of blank or incomplete responses to question 9 but it was difficult to determine whether this was due to a lack of time or a lack of knoeledge. Question 7 was by far the most successfully answered with just under a third of students scoring 6 out of 7 but the last two questions worked well as discriminator questions for the more able students. Just under 30% of the students scored nothing on question 8 and about a quarter failed to score on question 9. In calculations the numerical value of g which should be used is 9.8, unless otherwise stated. Final answers should then be given usually to 3 significant figures (unless otherwise stated) – more accurate answers will be penalised, including fractions but exact multiples of g are usually accepted. If there is a printed answer to show then students need to ensure that they show sufficient detail in their working to warrant being awarded all of the marks available. In all cases, as stated on the front of the question paper, students should show sufficient working to make their methods clear to the examiner and correct answers without working may not score all, or indeed, any of the marks available. If a student runs out of space in which to give his/her answer than he/she is advised to use a supplementary sheet.
Common mistakes
12/X − X ≤ 4 gives X² + 4X − 12 ≥ 0, so X ≥ 2 since X > 0 (or tabulate Y − X = 11, 4, 1, −1)
P(X ≥ 2) = 0.85
a good discriminator
June 2018 · Paper 3 · Q1(a)2 marks
Mark scheme (whole question; this part is marked with the orange bar)
Examiner's comment
This question was supposed to be a gentle starter, making use of the student’s knowledge of the large data set. Unfortunately many did not seem to be familiar with this and certainly were not aware that cloud cover was measure in oktas and subsequently there were a number who left the question blank. Those who did know about the cloud cover variable were able to give a discrete uniform distribution but many forgot to include 0. Those who did try and engage with the question could often score in
Common mistakes
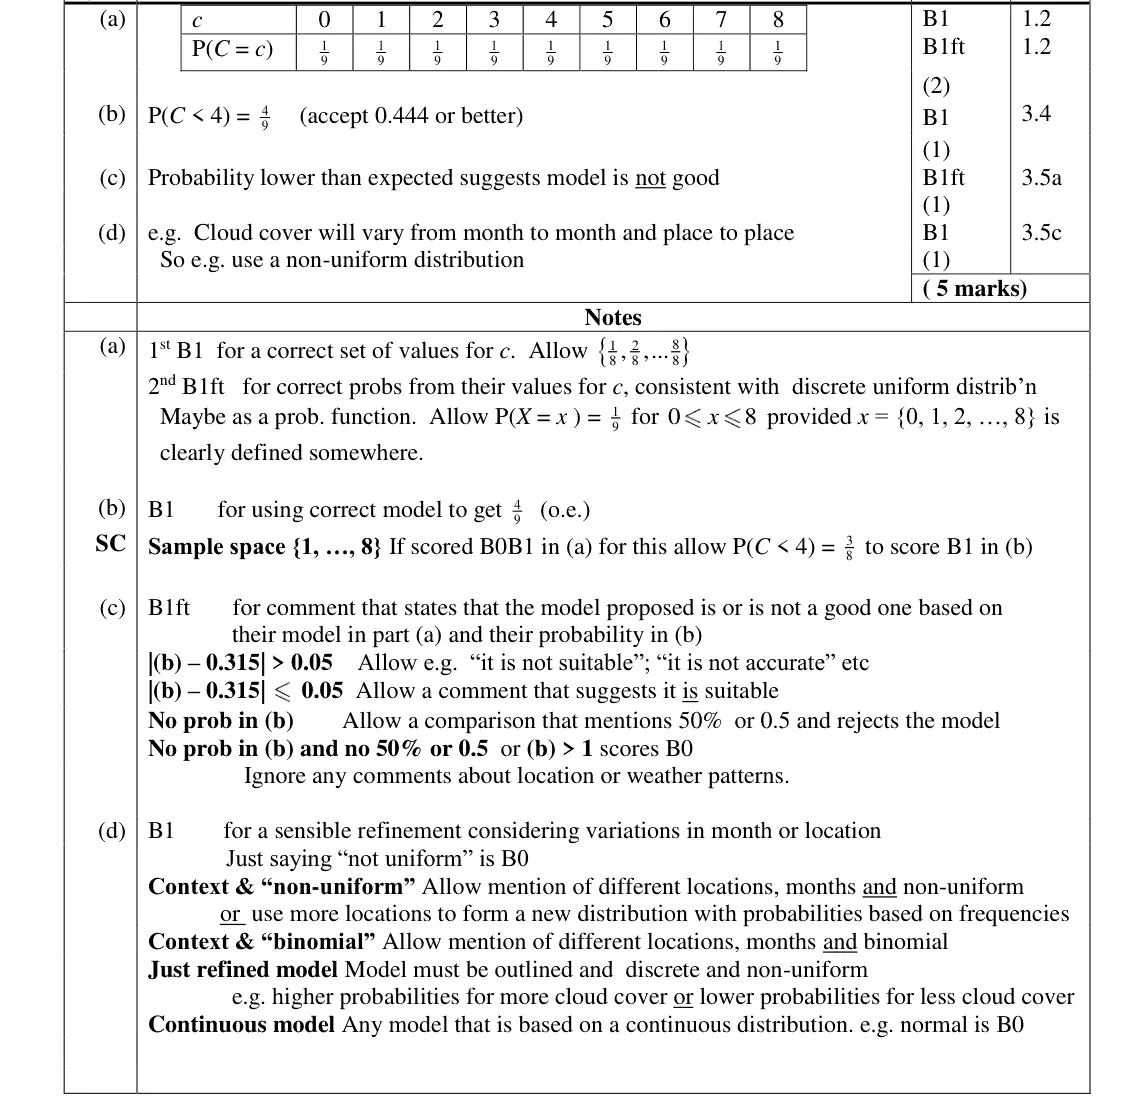
cloud cover is measured in oktas 0 to 8, so 9 values each with probability 1/9
many forgot to include 0
many unfamiliar with the variable and left it blank
June 2018 · Paper 3 · Q1(b)1 mark
Mark scheme (whole question; this part is marked with the orange bar)
Examiner's comment
This question was supposed to be a gentle starter, making use of the student’s knowledge of the large data set. Unfortunately many did not seem to be familiar with this and certainly were not aware that cloud cover was measure in oktas and subsequently there were a number who left the question blank. Those who did know about the cloud cover variable were able to give a discrete uniform distribution but many forgot to include 0. Those who did try and engage with the question could often score in
Common mistakes
less than 50% means fewer than 4 oktas, so P(C < 4) = 4/9 (0.444)
June 2018 · Paper 3 · Q1(c)1 mark
Mark scheme (whole question; this part is marked with the orange bar)
Examiner's comment
part (c) but responses to part (d) were poor. This question required students to suggest a refinement to Helen’s model and most answers lacked the detail required for the mark.
Common mistakes
compare 0.315 with 4/9: observed proportion is lower, so the uniform model is not good
comment must be based on their (b)
June 2018 · Paper 3 · Q1(d)1 mark
Mark scheme (whole question; this part is marked with the orange bar)
Examiner's comment
part (c) but responses to part (d) were poor. This question required students to suggest a refinement to Helen’s model and most answers lacked the detail required for the mark.
Common mistakes
just saying "not uniform" is B0
refinement must use variation by month or location (e.g. a non-uniform distribution with probabilities from frequencies)
a continuous model such as normal is B0
most answers lacked detail
June 2018 · Paper 3 · Q3(a)2 marks
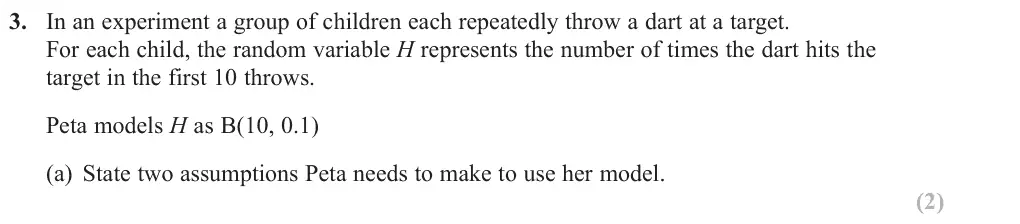
Mark scheme (whole question; this part is marked with the orange bar)
Examiner's comment
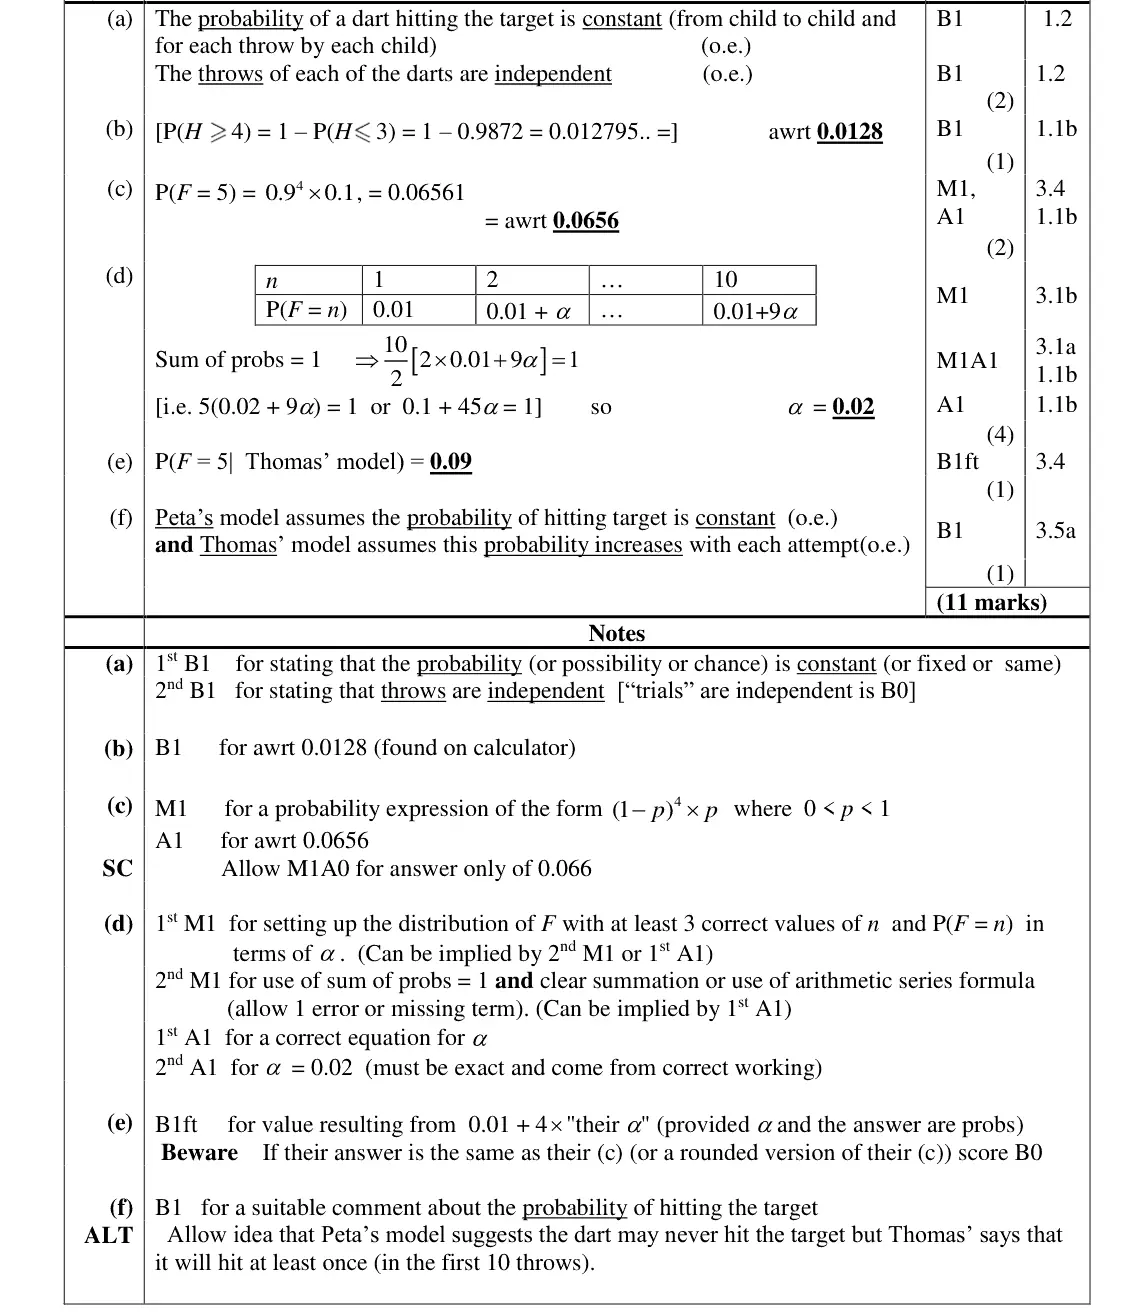
In part (a), we would expect answers to use the context and although many stated that Peta assumes that the probability of hitting the target is constant most did not mention that the throws of the dart had to be independent too, many simply referring to just “trials”.
Common mistakes
probability of hitting is constant and throws are independent, in context
"trials are independent" is B0
many omitted independence
June 2018 · Paper 3 · Q3(b)1 mark
Mark scheme (whole question; this part is marked with the orange bar)
Examiner's comment
Part (b) was answered fairly well, but in part (c) many carried on using the B(10, 0.1) model finding P(H = 5) rather than P(F = 5). Part (d) proved more challenging; those who carefully started to list
Common mistakes
P(H ≥ 4) = 1 − P(H ≤ 3) = 0.0128 by calculator
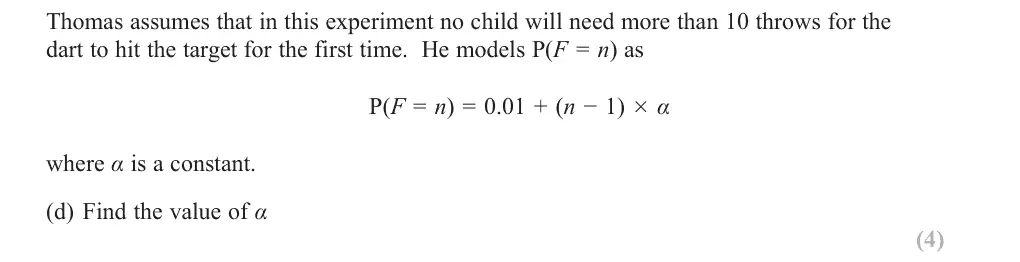
June 2018 · Paper 3 · Q3(d)4 marks
Mark scheme (whole question; this part is marked with the orange bar)
Examiner's comment
P(H = 5) rather than P(F = 5). Part (d) proved more challenging; those who carefully started to list the probabilities were often able to add these manually (few identified the arithmetic series as intended) and those who realised that the sum of the probabilities was equal to 1 usually went on to score all the marks and the mark in part (e). However, many thought that P(F = 10) = 1 or even that P(F = 5) had to equal their answer to part (c) and made little progress in (d) but could often collect the mark in (e). Part (f) was not answered well; the question clearly steered students to comment on the
Common mistakes
list P(F = n) for n = 1 to 10 and use sum of probabilities = 1 (arithmetic series 5(0.02 + 9α) = 1) giving α = 0.02
errors: assuming P(F = 10) = 1 or P(F = 5) equals answer to (c)
June 2018 · Paper 3 · Q3(e)1 mark
Mark scheme (whole question; this part is marked with the orange bar)
Examiner's comment
score all the marks and the mark in part (e). However, many thought that P(F = 10) = 1 or even that P(F = 5) had to equal their answer to part (c) and made little progress in (d) but could often collect the mark in (e). Part (f) was not answered well; the question clearly steered students to comment on the probability of a dart hitting the target using these two models. There were some good descriptions of what was happening with Thomas’ model but often these were not compared to Peta’s model.
Common mistakes
0.01 + 4α = 0.09
answer equal to their (c) scores B0
Find an Edexcel maths tutor
Stuck on this? Book a trial session with an Edexcel specialist.