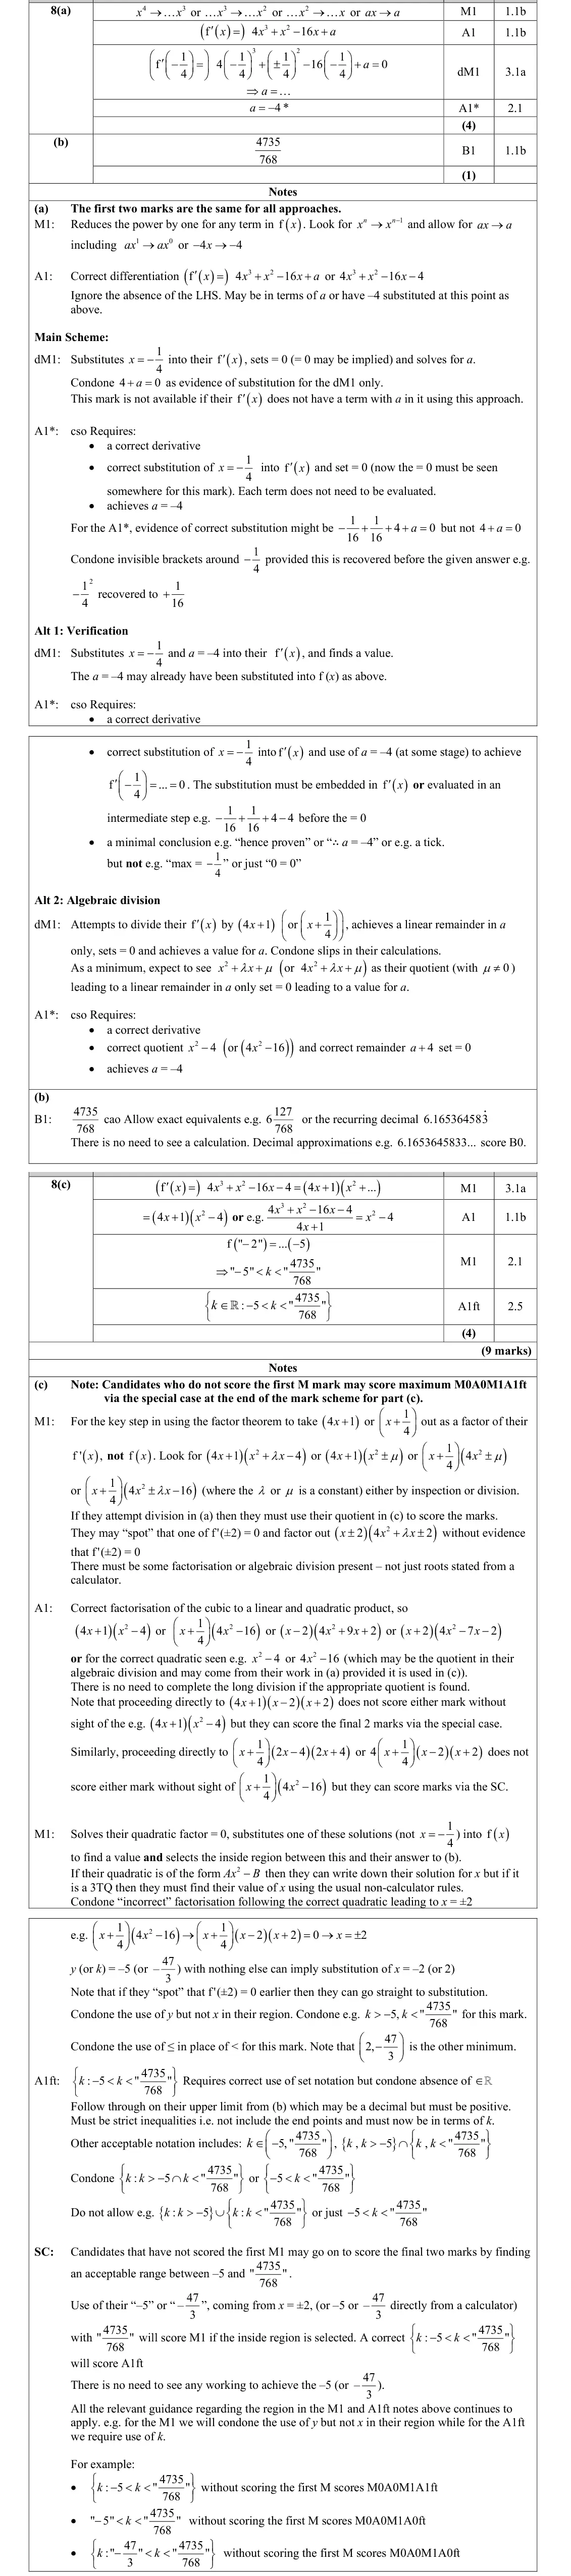
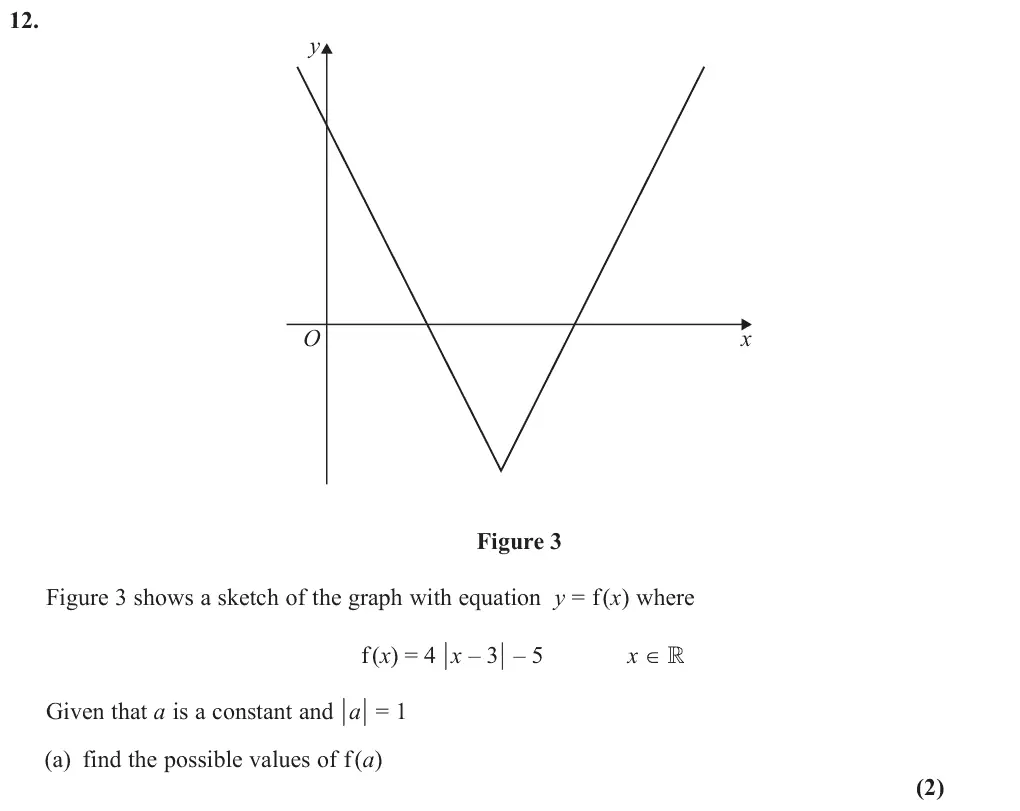
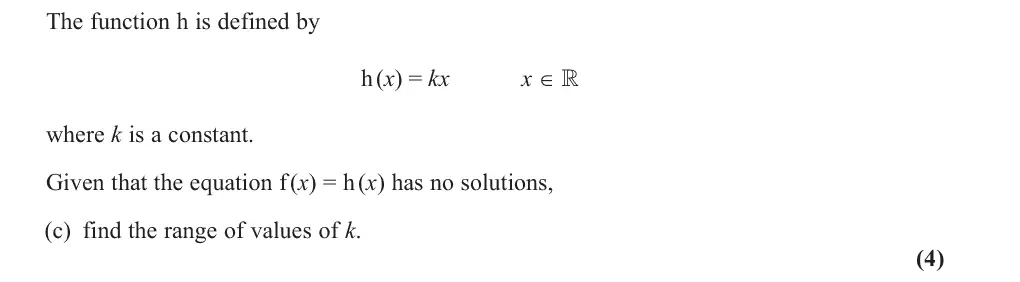
Understand and use graphs of functions; sketch curves defined by simple equations including polynomials, the modulus of a linear function, y = a/x and y = a/x² (including their vertical and horizontal asymptotes). Interpret algebraic solution of equations graphically; use intersection points of graphs to solve equations. Understand and use proportional relationships and their graphs.
Guidance
Graphs to include simple cubic and quartic functions, e.g. sketch the graph with equation y = x²(2x − 1)². Students should be able to sketch the graph of y = |ax + b| and use it, e.g. sketch y = |2x − 1| and use the graph to solve |2x − 1| = x or |2x − 1| > x. The asymptotes will be parallel to the axes, e.g. the asymptotes of y = 2/(x + a) + b are y = b and x = −a. Express a relationship between two variables using the proportion symbol ∝ or an equation involving a constant, e.g. the circumference of a semicircle is directly proportional to its diameter, so C ∝ d or C = kd, and the graph of C against d is a straight line through the origin with gradient k.
Mark scheme (whole question; this part is marked with the orange bar)
Examiner's comment
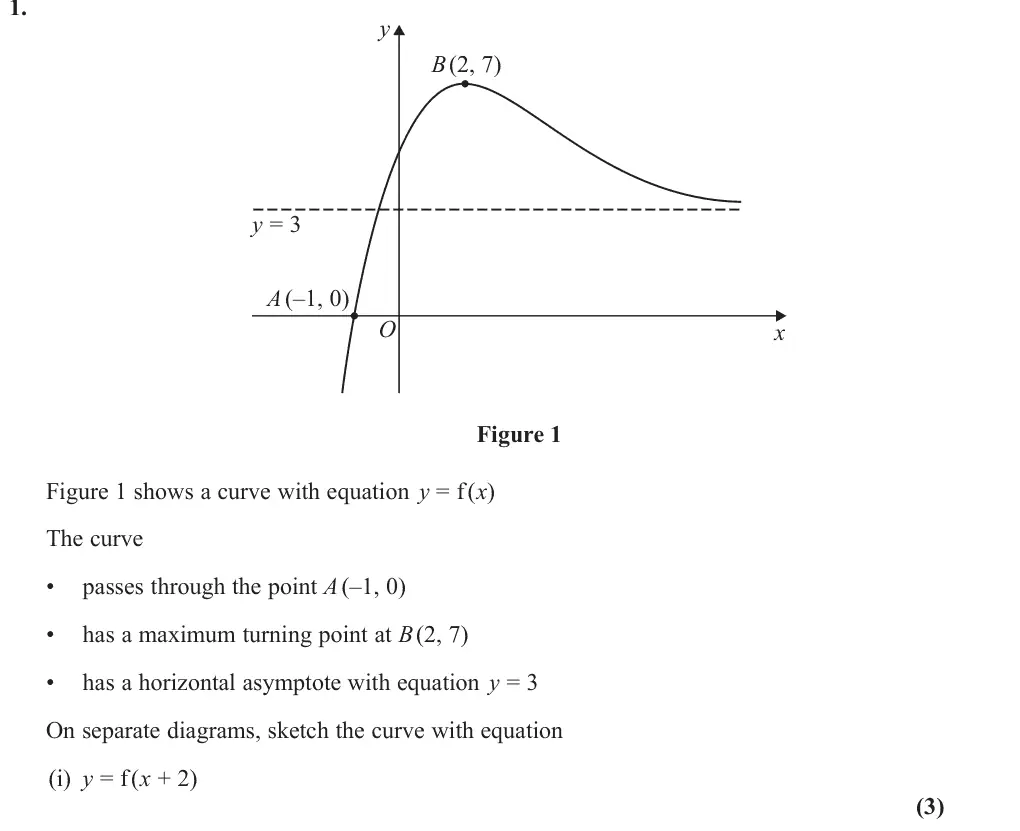
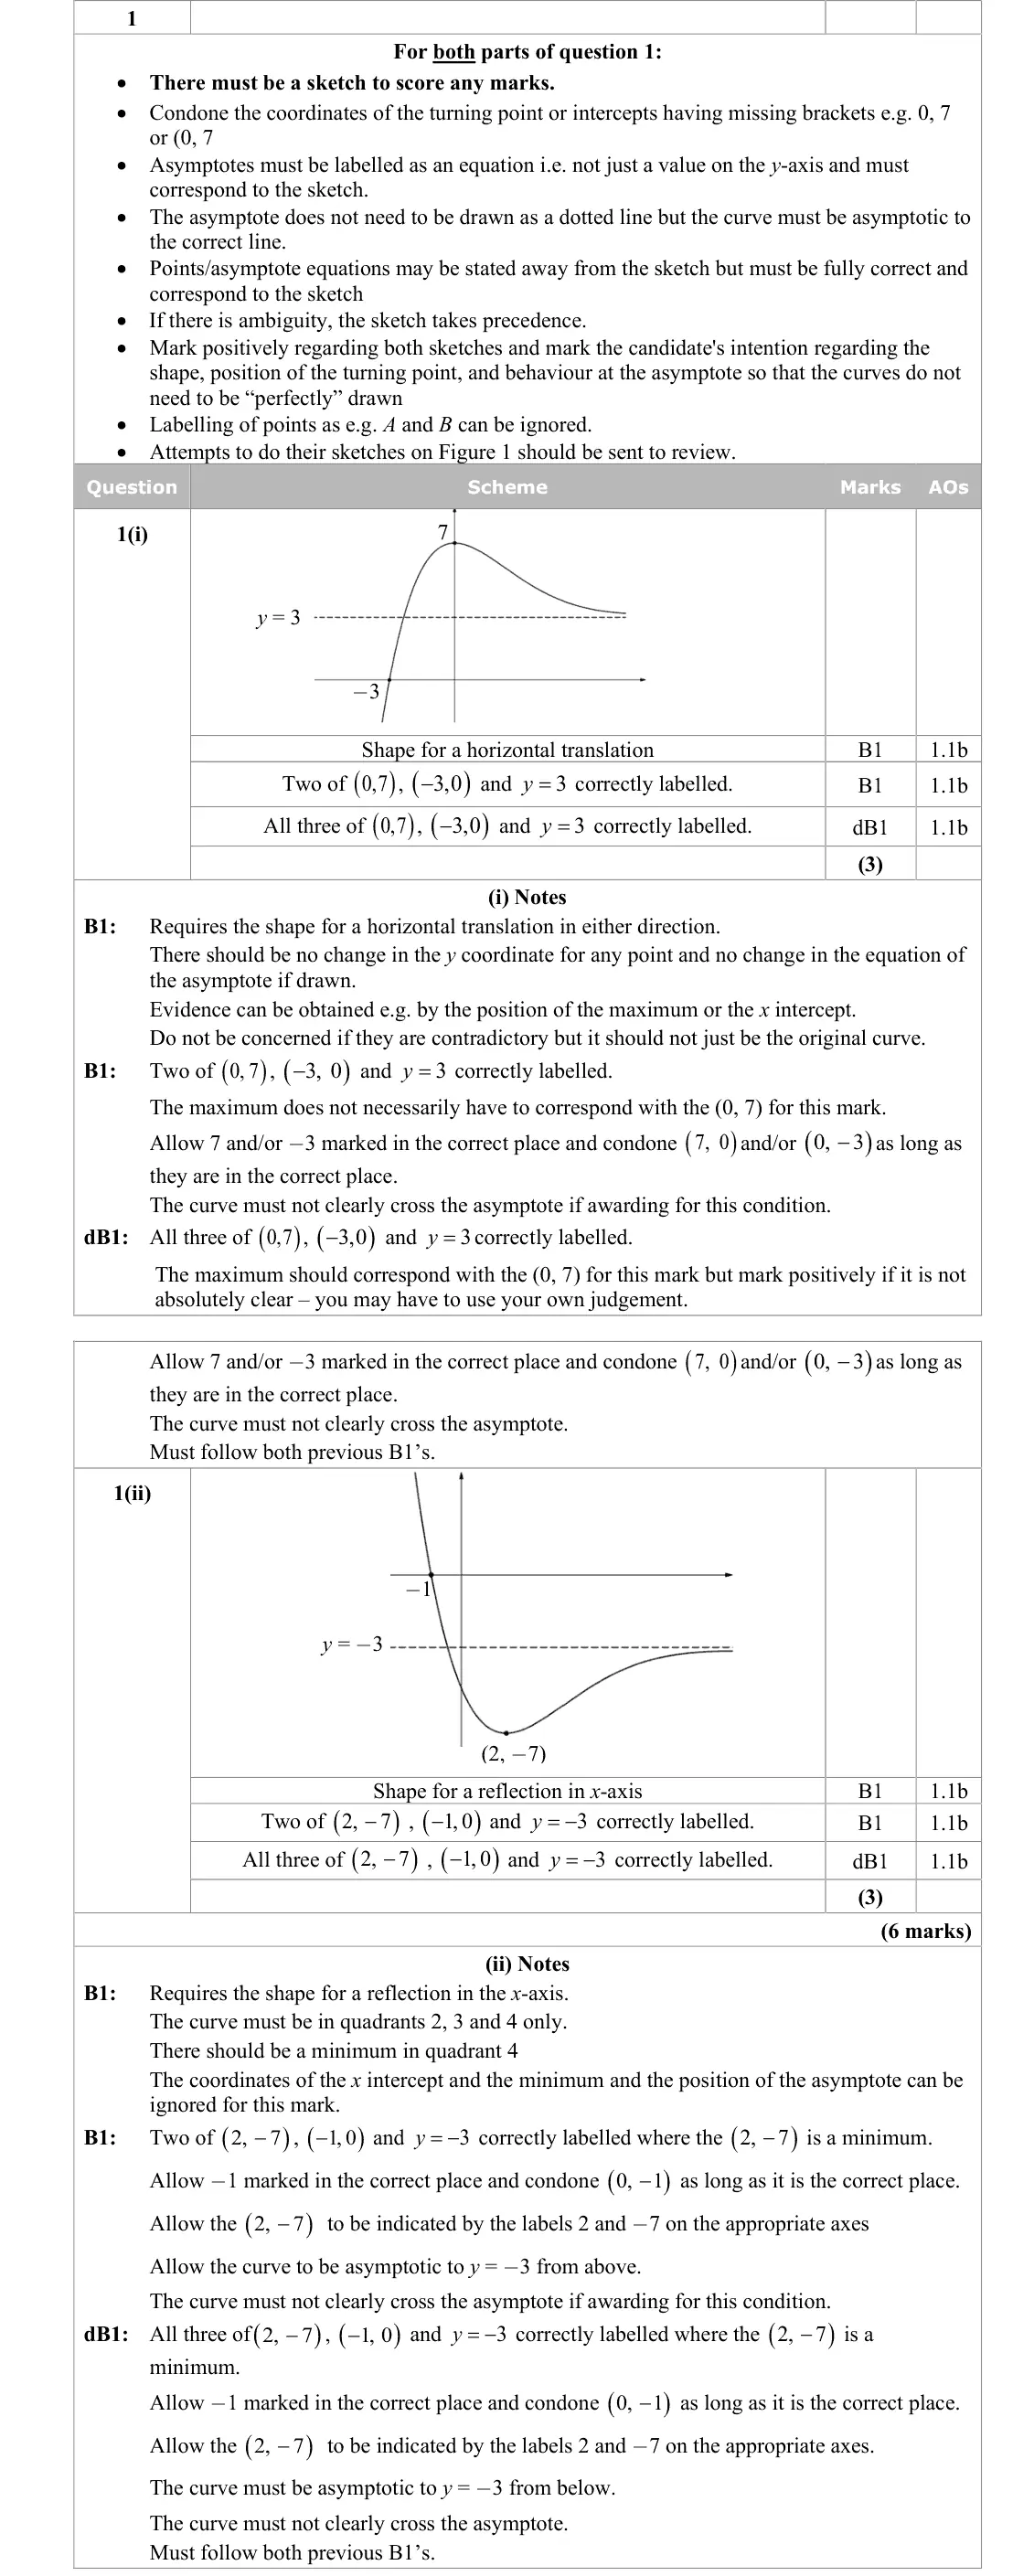
For part (i), y = f (x + 2) was generally drawn well, with most candidates achieving the correct horizontal translation with correct points and the correct asymptote labelled. The most common mistake was to translate the curve to the right, and therefore only scoring the first mark. A few students added 2 to the y-coordinates of each point, attempting an upwards translation. While there were many good sketches with many candidates scoring full marks on this part of the question, there were also a lot of careless sketches with the maximum not clearly being on the y-axis and curves crossing or curving away from the asymptote. Most wrote their coordinates and the equation of the asymptote correctly. Part (ii) was not answered as well as part (i) with a variety of different mistakes for the curve y = -f (x), the most common being to reflect the curve in the y-axis. Some candidates correctly reflected the curve in the x-axis but did not change the asymptote from y = 3 to y = -3. Sometimes this mistake lost all 3 marks because the curve was partly drawn in quadrant 1. Others translated the curve or found incorrect coordinates. Again, some curves were drawn poorly, so that the main features were not clearly identifiable and the coordinates unclear. The point (2,-7) was often not at the minimum point and frequently the curve did not tend towards the asymptote.
Common mistakes
f(x + 2) is a translation 2 to the LEFT: maximum at (0, 7), x-intercept (−3, 0), asymptote still y = 3
translating right or adding 2 to y
maximum not clearly on the y-axis
curve crossing or curving away from the asymptote
asymptote must be labelled as an equation
June 2025 · AS Paper 1 · Q1(ii)3 marks
Mark scheme (whole question; this part is marked with the orange bar)
Examiner's comment
For part (i), y = f (x + 2) was generally drawn well, with most candidates achieving the correct horizontal translation with correct points and the correct asymptote labelled. The most common mistake was to translate the curve to the right, and therefore only scoring the first mark. A few students added 2 to the y-coordinates of each point, attempting an upwards translation. While there were many good sketches with many candidates scoring full marks on this part of the question, there were also a lot of careless sketches with the maximum not clearly being on the y-axis and curves crossing or curving away from the asymptote. Most wrote their coordinates and the equation of the asymptote correctly. Part (ii) was not answered as well as part (i) with a variety of different mistakes for the curve y = -f (x), the most common being to reflect the curve in the y-axis. Some candidates correctly reflected the curve in the x-axis but did not change the asymptote from y = 3 to y = -3. Sometimes this mistake lost all 3 marks because the curve was partly drawn in quadrant 1. Others translated the curve or found incorrect coordinates. Again, some curves were drawn poorly, so that the main features were not clearly identifiable and the coordinates unclear. The point (2,-7) was often not at the minimum point and frequently the curve did not tend towards the asymptote.
Common mistakes
−f(x) is a reflection in the x-axis: minimum (2, −7), intercept (−1, 0), asymptote y = −3
reflecting in the y-axis is the commonest error
June 2025 · AS Paper 1 · Q12(b)2 marks
Mark scheme (whole question; this part is marked with the orange bar)
Examiner's comment
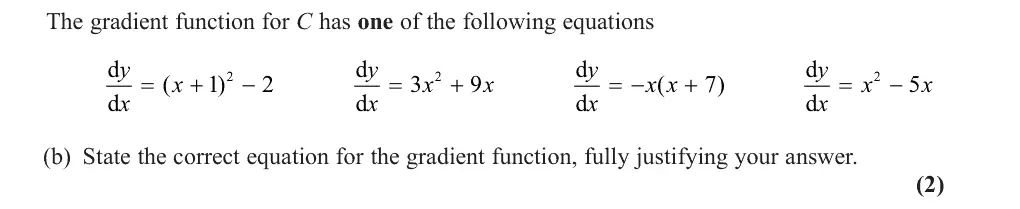
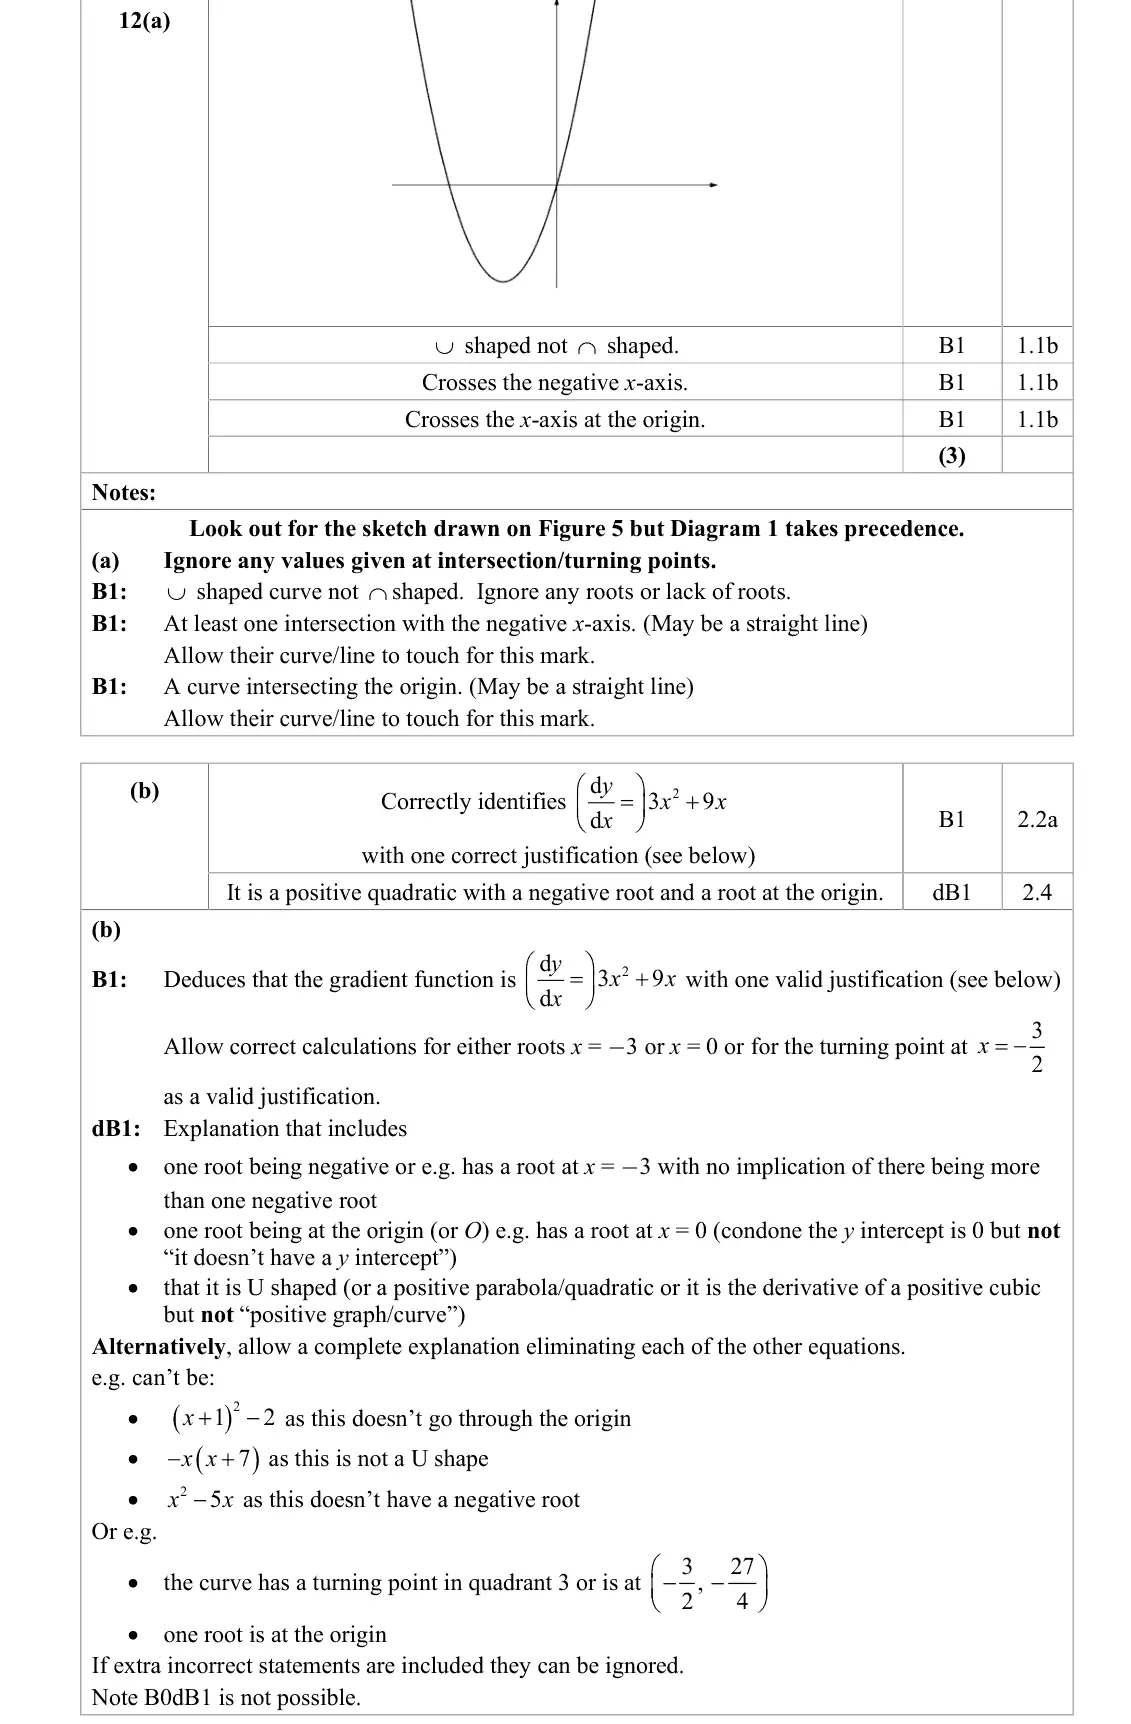
This question was met with mixed success. Whilst many candidates made a reasonable attempt at sketching the quadratic graph in part (a), part (b) proved more challenging, particularly in selecting the correct gradient function and providing adequate justification. Part (b) was less well answered. While some identified the correct function, many failed to justify their choice clearly or accurately. Common issues included: • no justification or vague explanations such as "it’s a cubic" (which applies to all the given options) • stating that it was correct because of the roots, but without explaining the link between the function and its derivative • attempting to integrate each option instead of recognising it as a derivative • incorrectly assuming a connection between the coefficient of 2x being 3 and the original curve being cubic Some selected the correct function but gave ambiguous or incorrect reasons, which prevented them from accessing full marks. A wide range of incorrect gradient choices were also seen. Stronger responses either correctly linked all the required aspects or ruled out the incorrect options through logical reasoning, demonstrating good understanding. Overall, this question differentiated well between candidates.
Common mistakes
dy/dx = 3x² + 9x: positive quadratic with a root at 0 and a negative root (−3)
"it's a cubic" or vague root comments are not a justification
integrating each option
June 2025 · Paper 1 · Q7(b)3 marks
Mark scheme (whole question; this part is marked with the orange bar)
Examiner's comment
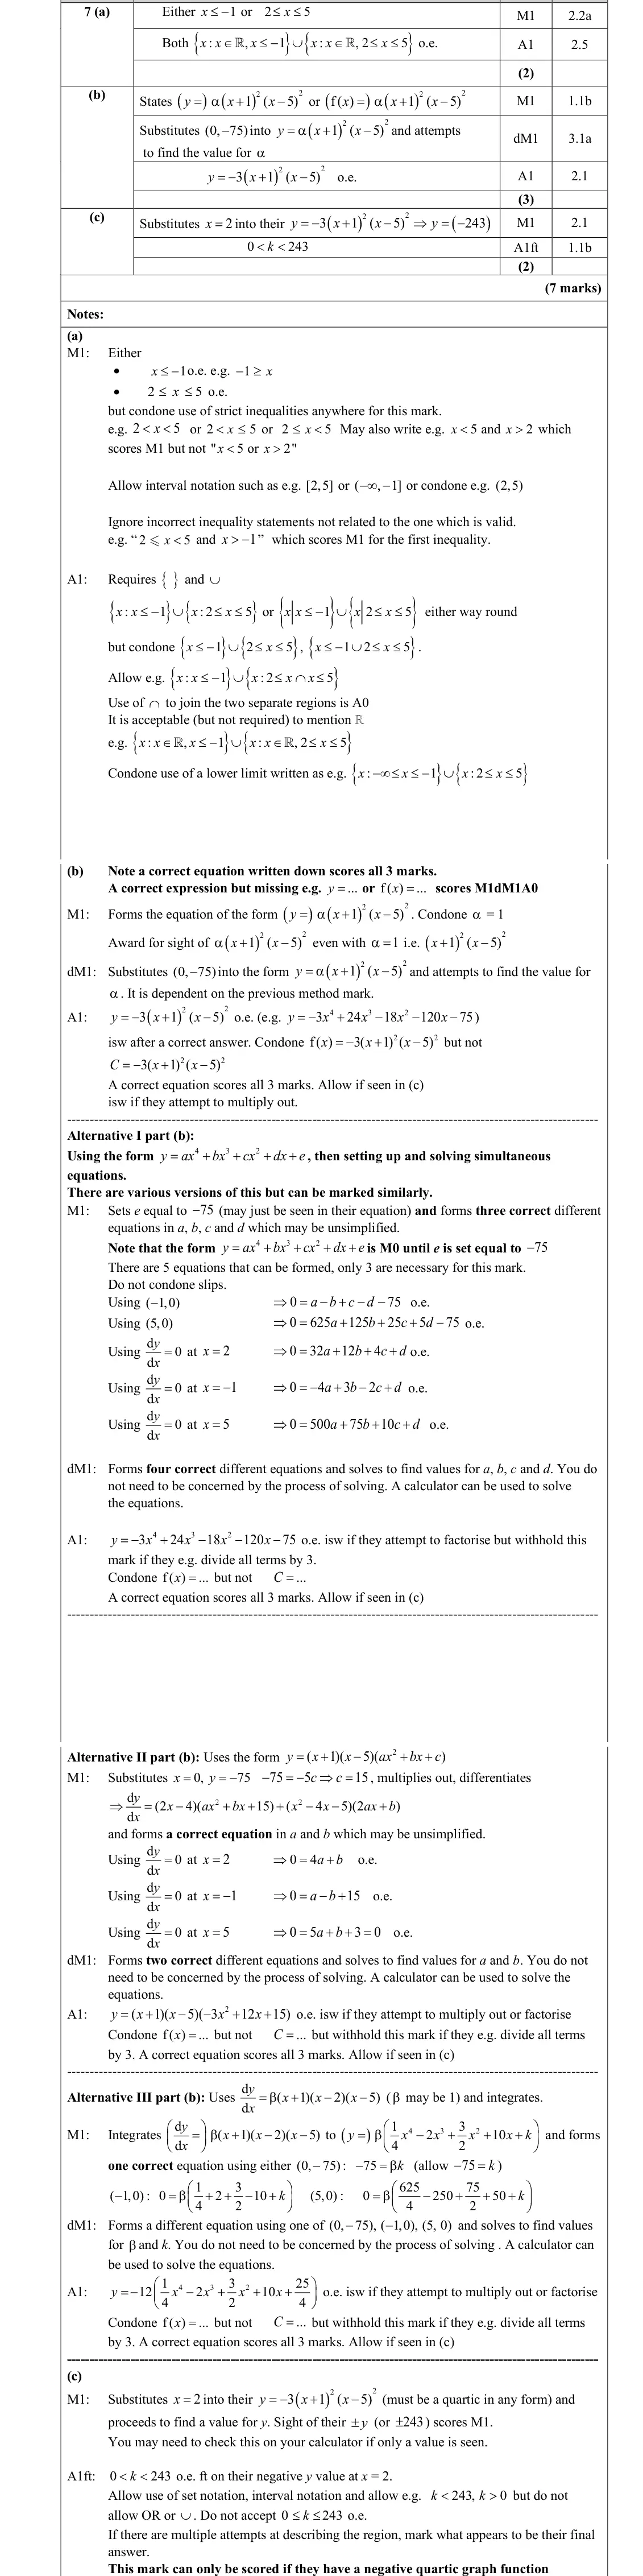
This was the first question on the paper where there was wide discrimination between the marks of responses, and many struggled with knowing how to handle a quartic function. Part (b) required using the given information and the figure to find the equation of the quartic. Many started with an appropriate form of a quartic however there were a few learners who considered quadratic or cubic functions. Finding the equation of the quartic curve could be done very efficiently or with a lot of algebra. The most efficient method was to consider the factorised form based on the repeated roots of curve. Those who recognised this form were the most successful. The coordinates of the y-intercept could then be used to establish the equation of the curve. This stage was generally correctly done to obtain a negative quartic, however sign errors did lead to some positive quartics being generated. A common error was to assume that there was an additive constant translating the curve rather than a multiplicative scaling constant. Those who took other approaches had a lot more to do to ascertain the coefficients of the terms within the quartic. With these methods algebraic mistakes were often seen. Common methods involved considering the general form of a quartic with the x-intercepts and the x coordinates of the stationary points, or recognising the factors from the single roots of the quartic combined with an unknown quadratic factor or considering the cubic form of the derivative and integrating or combining with the general form of the quartic. Many learners were able to arrive at some of the equations linking the coefficients with appropriate substitution of values, however, not all response found all the equations and accurately proceed to a correct equation for the curve. It was common to see algebraic errors in the formation and solution of the equations. 11 A common mistake with all of the methods was to present an expression rather than an equation of the curve. There was a wide variety of responses to this question, with some not attempting it and others having multiple attempts to find the equation of the curve generating solutions which was at times difficult to follow.
Common mistakes
double roots at −1 and 5: y = α(x + 1)²(x − 5)², and (0, −75) gives α = −3
must be an equation (y = ...), not an expression
adding a constant instead of scaling
long general-quartic methods led to algebraic errors
June 2025 · Paper 1 · Q7(c)2 marks
Mark scheme (whole question; this part is marked with the orange bar)
Examiner's comment
This was the first question on the paper where there was wide discrimination between the marks of responses, and many struggled with knowing how to handle a quartic function. Part (c) involved assuming that the quartic intersects the x-axis at exactly four places with the aim to find the range of possible translation factors of the curve. Many responses found the y coordinate of the local minimum. Those who found a quartic in part (b) were often successful at this. Common errors were not appropriately using the y coordinate to describe the translation factor or not considering the minimum value. Those with positive quartic functions could not score the final mark as the figure provided already showed that this was not the case. 12
Common mistakes
minimum at x = 2 has y = −243, so shift up by between 0 and 243: 0 < k < 243 (strict)
needs a negative quartic from (b)
June 2025 · Paper 1 · Q12(a)2 marks
Mark scheme (whole question; this part is marked with the orange bar)
Examiner's comment
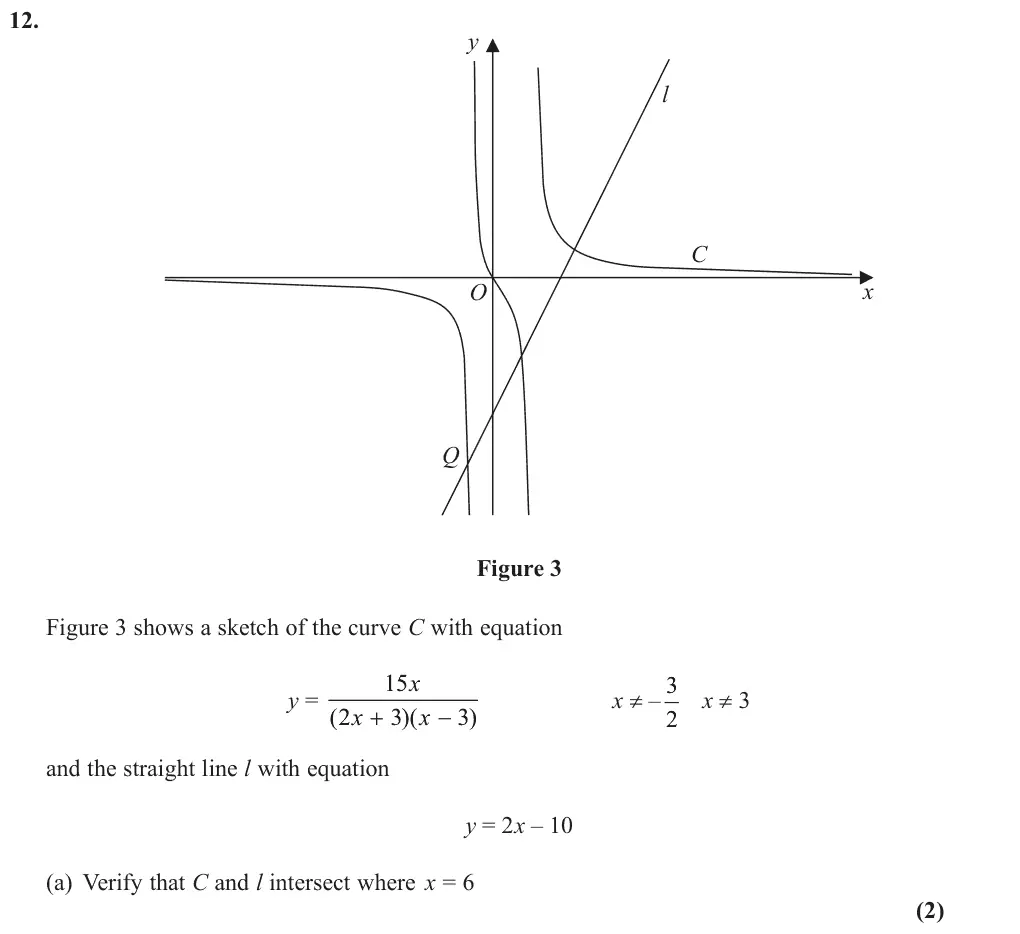
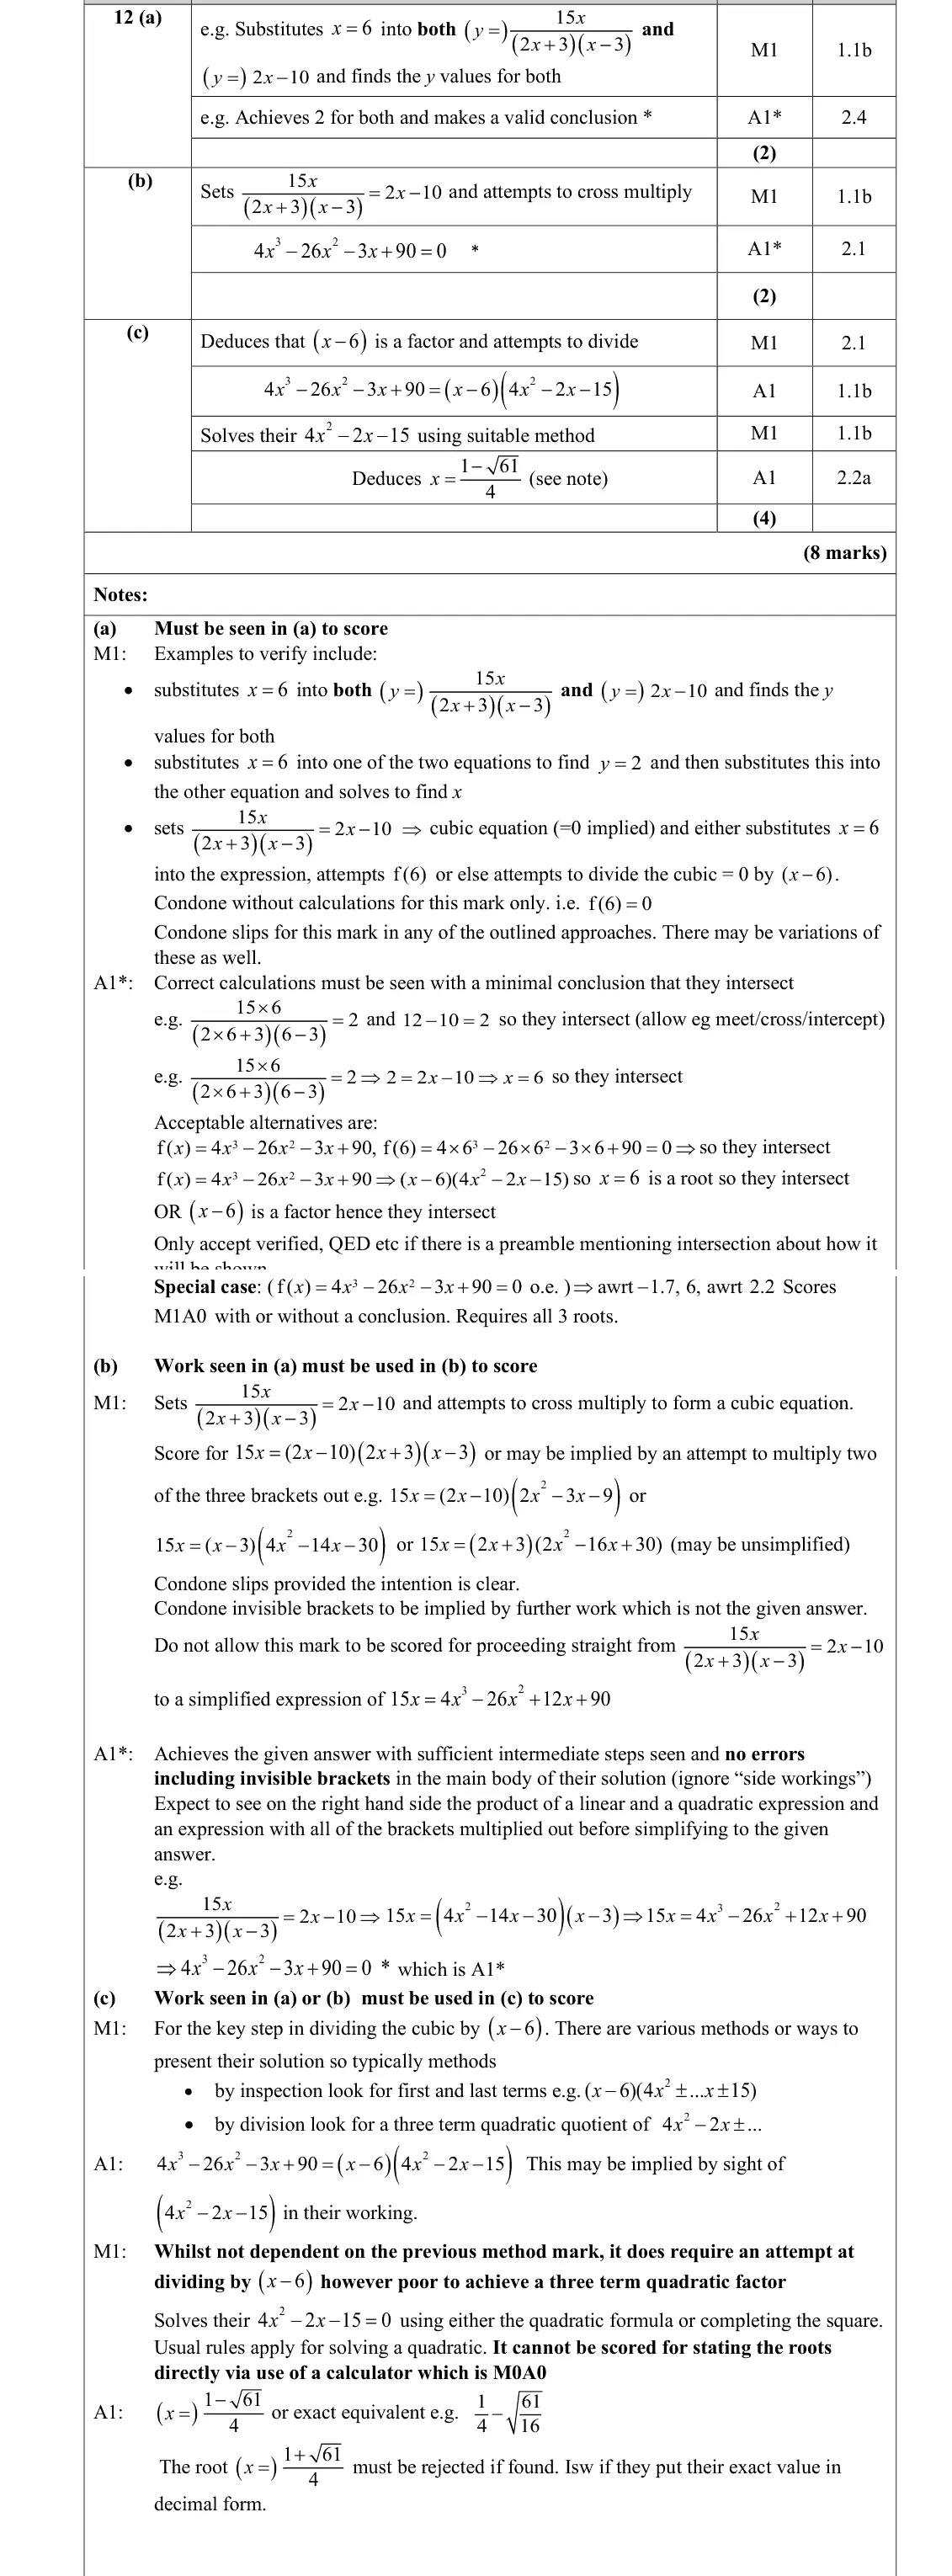
This question tested knowledge of the intersection of lines and curves. The majority of learners found this question accessible, but some learners did not gain marks due to work particularly for part (b) appearing in part (a) and then no reference made that this should also be for part (b). For others it was for just generally not labelling the question parts and not being clear which part it belonged to, if not attempted in order. Learners should be reminded of the importance of clearly labelling and identifying each part of a question. Generally, part (a) was answered well. Many of the responses, in demonstrating the verification, substituted 6 x = into both equations to show that both y values were the same although a significant minority then forgot to write a conclusion or to say that the lines intersect where 6. x = A less popular approach was to cross multiply to achieve a cubic followed by substituting 6 x = to show the equation = 0, stating 6 x = is a root so they intersect. Similarly, the long division approach was less popular however, learners who used this approach were often successful. A significant number of responses did not include an appropriate conclusion. In show/verify/prove-type questions, learners should be advised to always finish with a statement which reiterates whatever they were being asked to show/verify/prove – usually, the wording can be lifted directly from the question. A few learners used their scientific calculators to find the three roots, one of which was ( 6 x = ), thereby gaining only the mark for the special case.
Common mistakes
substitute x = 6 into both: y = 90/(15 × 3) = 2 and 2 × 6 − 10 = 2, then conclude they intersect
calculator roots of the cubic only score the special case
June 2025 · Paper 1 · Q12(b)2 marks
Mark scheme (whole question; this part is marked with the orange bar)
Examiner's comment
This question tested knowledge of the intersection of lines and curves. The majority of learners found this question accessible, but some learners did not gain marks due to work particularly for part (b) appearing in part (a) and then no reference made that this should also be for part (b). For others it was for just generally not labelling the question parts and not being clear which part it belonged to, if not attempted in order. Learners should be reminded of the importance of clearly labelling and identifying each part of a question. In part (b), the majority of responses equated the equations of C and L and then arranged to obtain a cubic equation. Missing or invisible brackets and a lack of working were the common errors seen here but, overall, there was a high level of accuracy shown in this part of the question. Learners should be advised to take extra care on questions such as this to ensure their working ‘flows’ from one line to the next, with every step shown and no errors in the algebra. Some responses did not gain the marks in (b) because they had expanded the brackets in (a) and did not use it in (b).
Mark scheme (whole question; this part is marked with the orange bar)
Examiner's comment
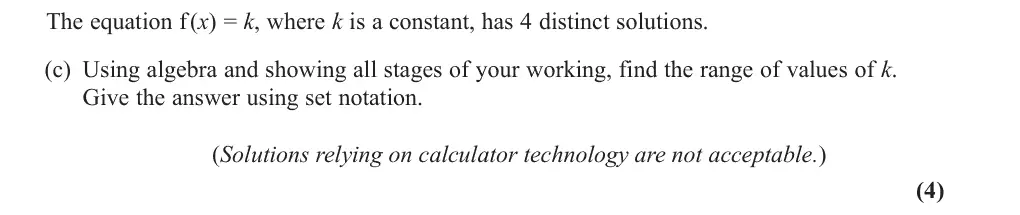
This question, involving the factor theorem and differentiation, was attempted by the vast majority of learners, with nearly all engaging with all three parts. Parts (a) and (b) were generally well-answered. Part (c), however, proved more challenging, with a significant proportion of learners relying on calculator-based methods despite the question clearly stating that these were not acceptable. Part (c) was the most challenging part of the question but was well supported by a clear diagram that helped to improve learners’ ability to solve the problem. A good range of marks were seen for this part of the question, and it differentiated well between the varying understanding of learners across the cohort. While many learners correctly identified that the number of real solutions to the equation f(x) = k depended on the location of k relative to the turning points of the curve, a substantial number relied on calculator methods to find the critical values of k, rather than using written methods as instructed. There were many responses where the required quadratic of x2 – 4 (or maybe 4x2 – 16) was never seen, the cubic was either followed directly by x = 1 4 - , 2, –2, or (4x + 1)(x – 2)(x + 2). These responses scored M0A0 and could only receive limited credit under the special case. Those who did attempt the algebra often reached the correct values but struggled with set notation. A common error when writing the final answer was using the union of two intervals instead of an intersection, while some used inclusive inequalities instead of strict inequalities and others made no attempt to use set notation. Despite this, many understood the underlying concept and were able to identify the correct range for k, even if it was not expressed with the required detail.
Common mistakes
use the factor theorem on f′(x): (4x + 1)(x² − 4) must be seen, not roots from a calculator
lower minimum f(−2) = −5
four solutions between the lower minimum and the local maximum: {k : −5 < k < 4735/768}
intersection not union
strict inequalities
must use set notation
June 2025 · Paper 2 · Q12(a)2 marks
Mark scheme (whole question; this part is marked with the orange bar)
Examiner's comment
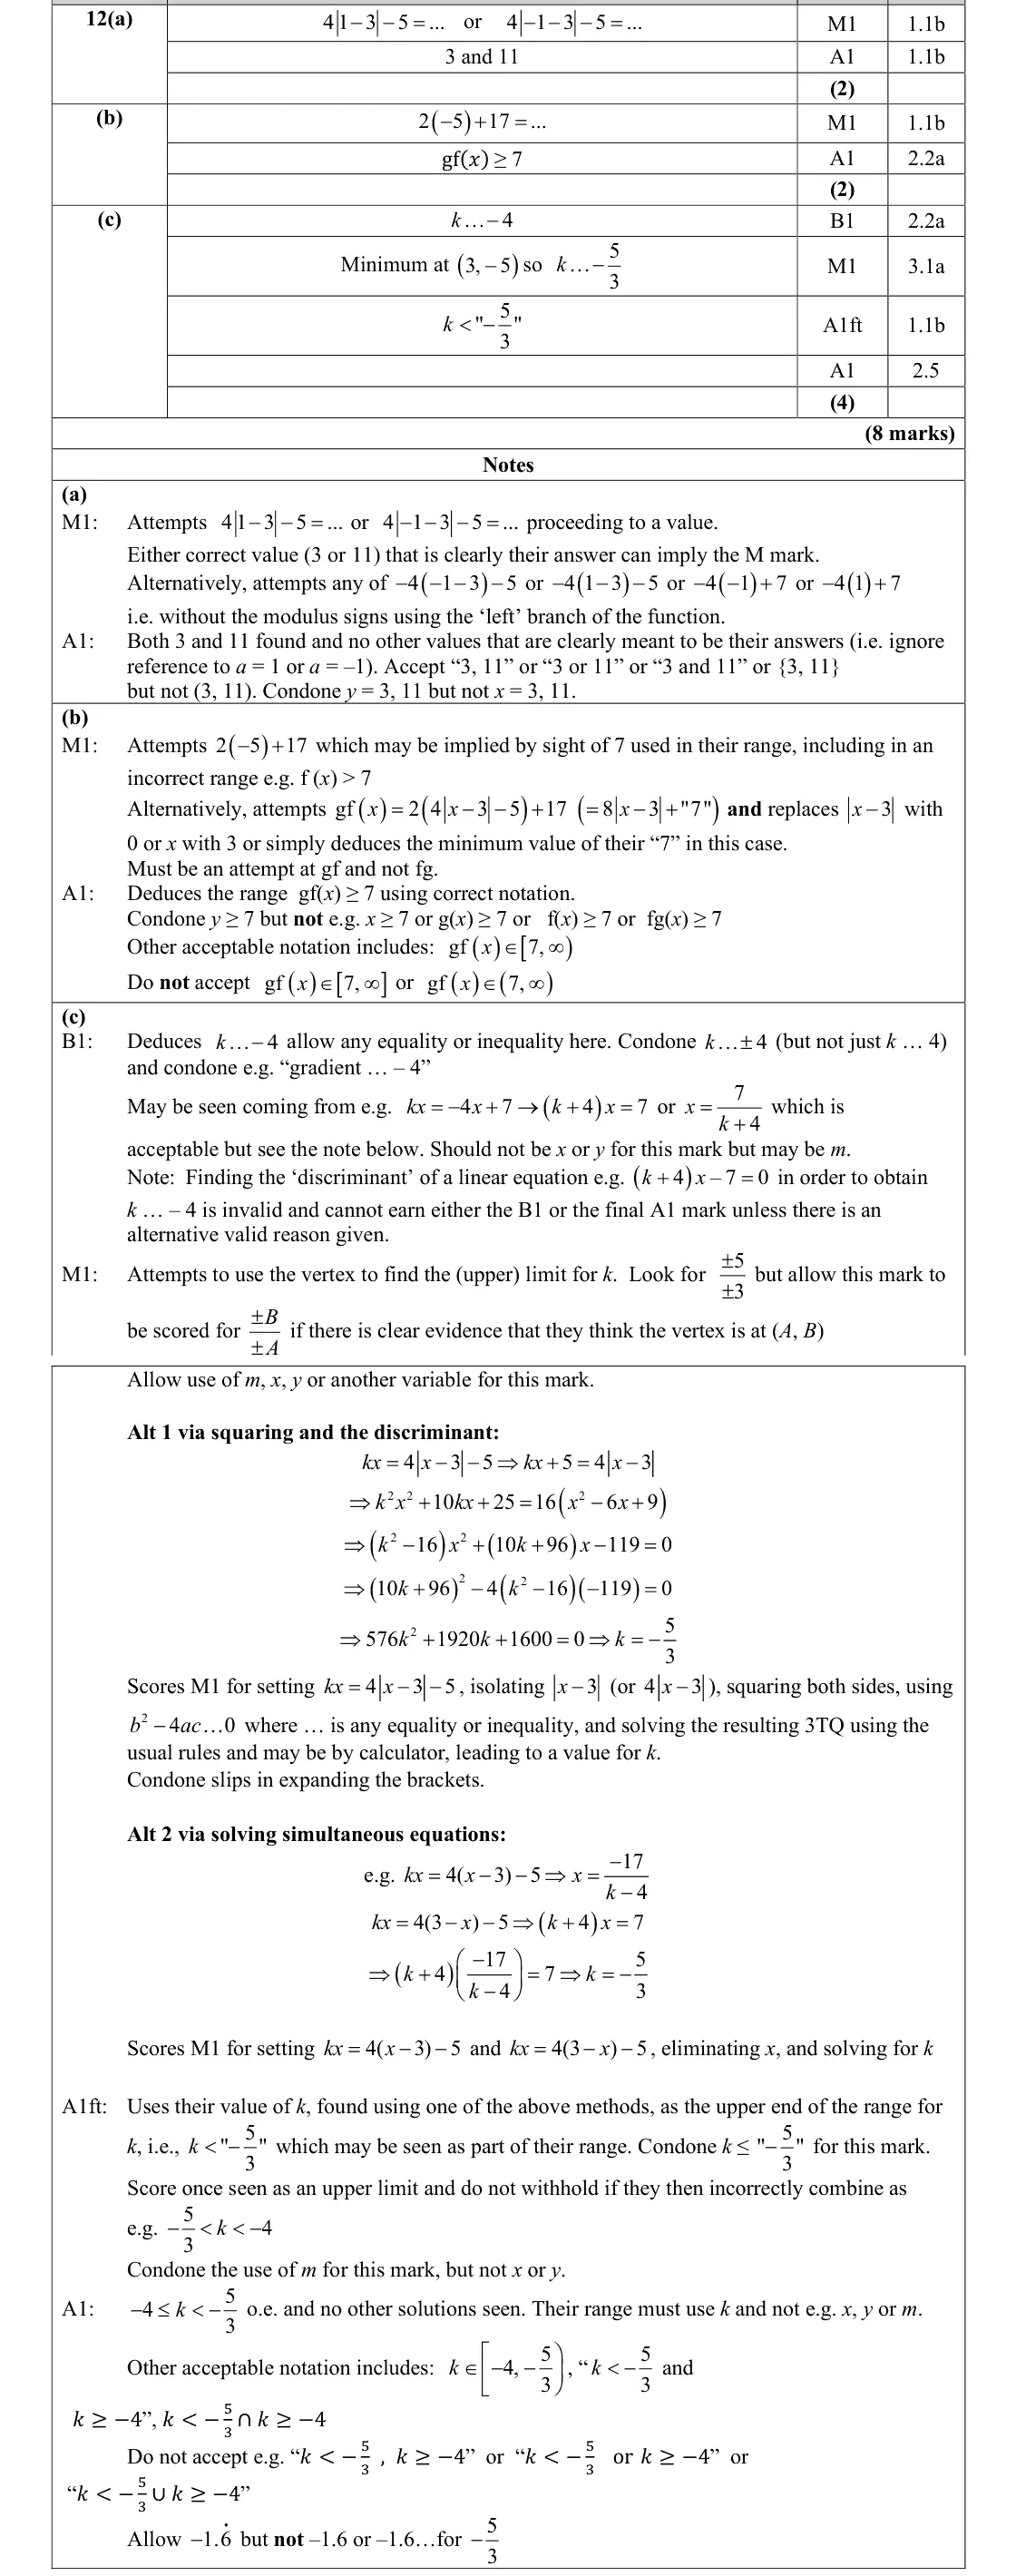
This question, assessing understanding of modulus functions, composite functions and the range, was accessible to almost all learners. Generally, responses scored well on the first two parts but did not find a simple strategy for the last part. In part (a), the modulus idea was understood by most learners who knew to substitute 1 x = and 1 x = - into f(x) achieving the correct answers 3 and 11. A number of responses did not gain the accuracy mark by either stating that 3, 11 a = or 3, 11 x = . Some found incorrect additional solutions, often –13 and –21 (thinking that 3 x - could be positive or negative), or giving a range of values such as 3 < f(a) < 11 and as a result did not gain the accuracy mark. A number of responses found values of a by solving a variety of equations. Many overlooked the modulus signs and treated the function as f(x) = 4(x – 3) – 5.
Common mistakes
a = ±1 so f(1) = 3 and f(−1) = 11
not a = 3, 11 or x = 3, 11
−13 and −21 or a range are wrong
do not ignore the modulus
June 2025 · Paper 2 · Q12(b)2 marks
Mark scheme (whole question; this part is marked with the orange bar)
Examiner's comment
This question, assessing understanding of modulus functions, composite functions and the range, was accessible to almost all learners. Generally, responses scored well on the first two parts but did not find a simple strategy for the last part. In part (b), some responses found the minimum value of the function directly from ( ) 2 5 17 - + but a significant number found an expression for gf(x) first ( ) 2 4 3 5 17 x - - + . Of these, some knew to either replace ( ) 3 x - with 0, or x with 3 leading to a minimum value of 7, but a significant number did not know how to proceed from the function gf(x). Having found the correct minimum value, many learners gave the correct answer gf(x) >= 7, but a number incorrectly gave the answer as x >= 7 or f(x) >= 7. A few learners gave their answer in ‘set’ notation and these learners generally scored both marks for this part. Some learners used graphical transformations to arrive at their range, the majority of which got to the final answer, scoring full marks.
Common mistakes
minimum of f is −5 so gf(x) ≥ 2(−5) + 17 = 7
range in terms of gf(x), not x ≥ 7 or f(x) ≥ 7
June 2025 · Paper 2 · Q12(c)4 marks
Mark scheme (whole question; this part is marked with the orange bar)
Examiner's comment
This question, assessing understanding of modulus functions, composite functions and the range, was accessible to almost all learners. Generally, responses scored well on the first two parts but did not find a simple strategy for the last part. Learners found part (c) difficult, and many scored few marks as a result. This part is not dissimilar to questions from previous series but the idea of there being no solutions clearly caused greater difficulties for some. Those who were most successful approached the question thinking graphically, drawing on the given graph a line from the origin to the vertex, finding the gradient, then realising the gradient was between this value and –4 (inclusive of –4). Often the strict inequality for –4 was given and did not gain the final mark, but on the whole this approach was quick and successful. Other responses showed one of the more difficult routes to finding the upper limit for k and invariably had processing errors at some stage. Finally, many responses considered that a discriminant had to be involved because the question mentioned there being “no solutions”, however for most this ended up with them trying to find the discriminant of expressions that were not quadratic.
Common mistakes
lines y = kx through O: parallel to the left branch at k = −4 (no solutions, included) up to the line through the vertex (3, −5), k = −5/3
−4 ≤ k < −5/3 (strict −4 loses the final mark)
discriminant of a linear equation is invalid
June 2024 · AS Paper 1 · Q2(c)2 marks
Mark scheme (whole question; this part is marked with the orange bar)
Examiner's comment
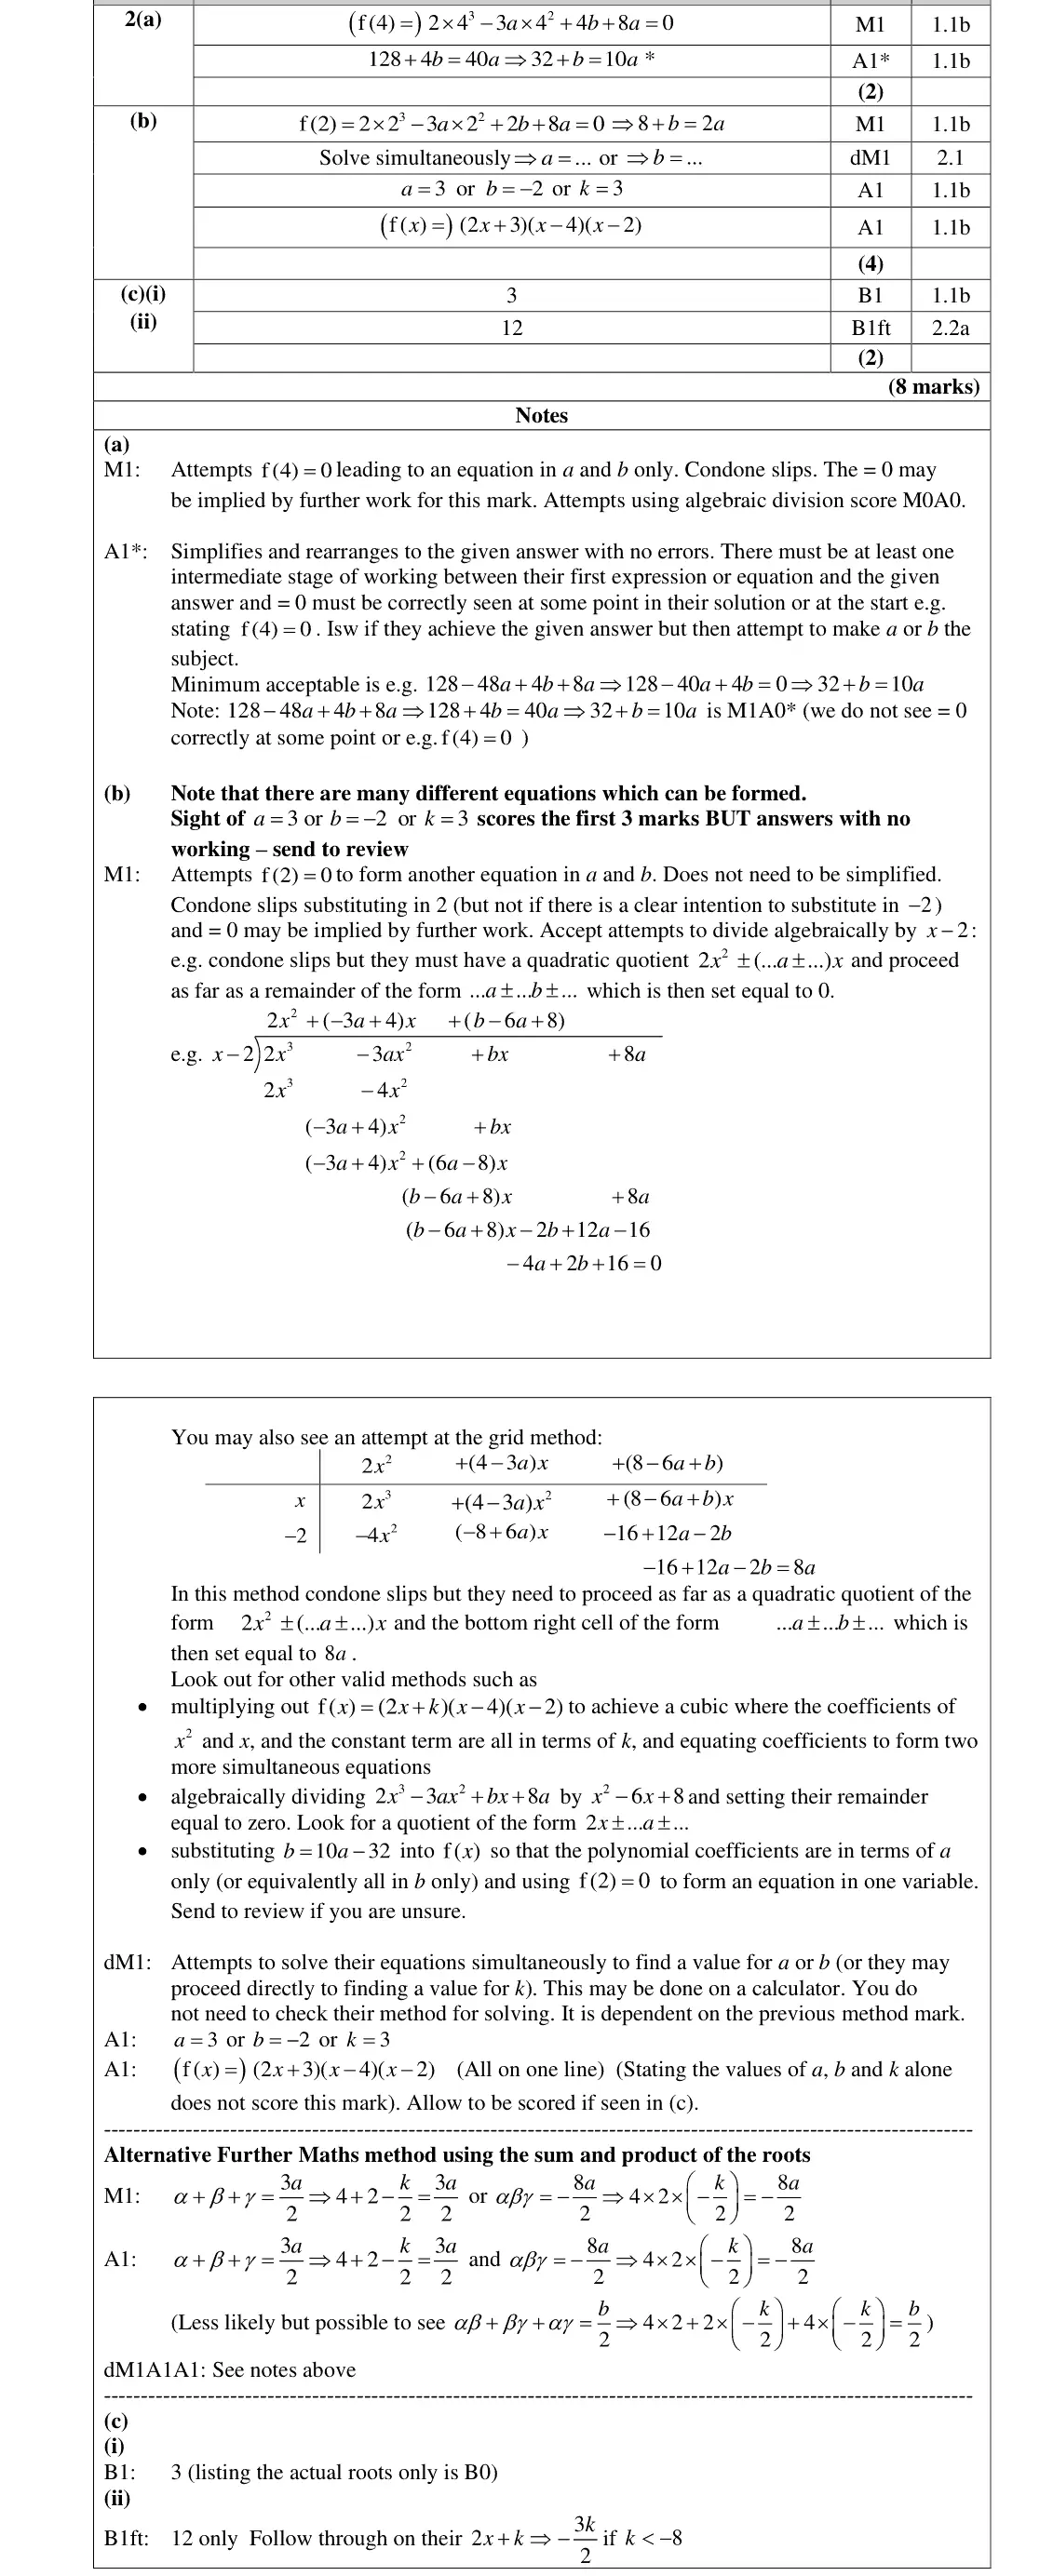
This question which required use of the factor theorem and solving simultaneous equations provided an opportunity to score a good number of marks. Some candidates found this question to be accessible and scored full marks or nearly full marks. Others however, encountered difficulties, particularly with part (b) and dropped marks accordingly. Some candidates lost marks because they did not pay heed to the instruction to show all stages of their working. Part (c) was answered quite well, even by those who had made little or no progress in part (a) or part (b). In part (i) many identified that there were three real roots, although stating that there were two real roots was a common incorrect answer. Some also lost the mark because they listed the roots without stating how many there were. In part (ii) many realised that the largest root was 12, although 4 3 was a common incorrect answer.
Common mistakes
(i) state "3", listing the roots alone scores 0
2 is a common wrong answer
(ii) f(x/3) = 0 is a stretch scale factor 3 so largest root 3 × 4 = 12 (4/3 is a common wrong answer)
June 2024 · AS Paper 1 · Q5(a)3 marks
Mark scheme (whole question; this part is marked with the orange bar)
Examiner's comment
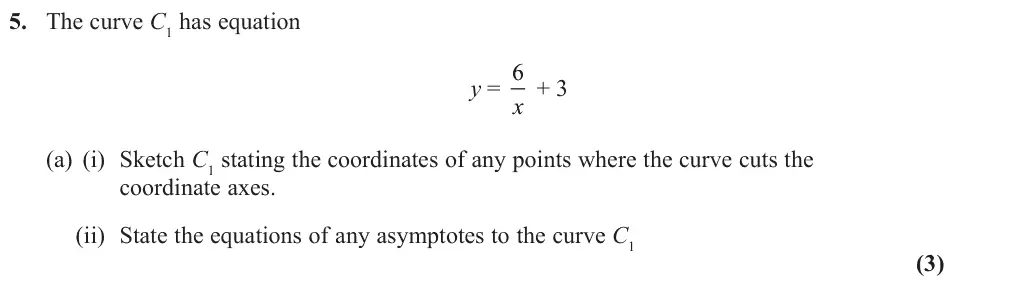
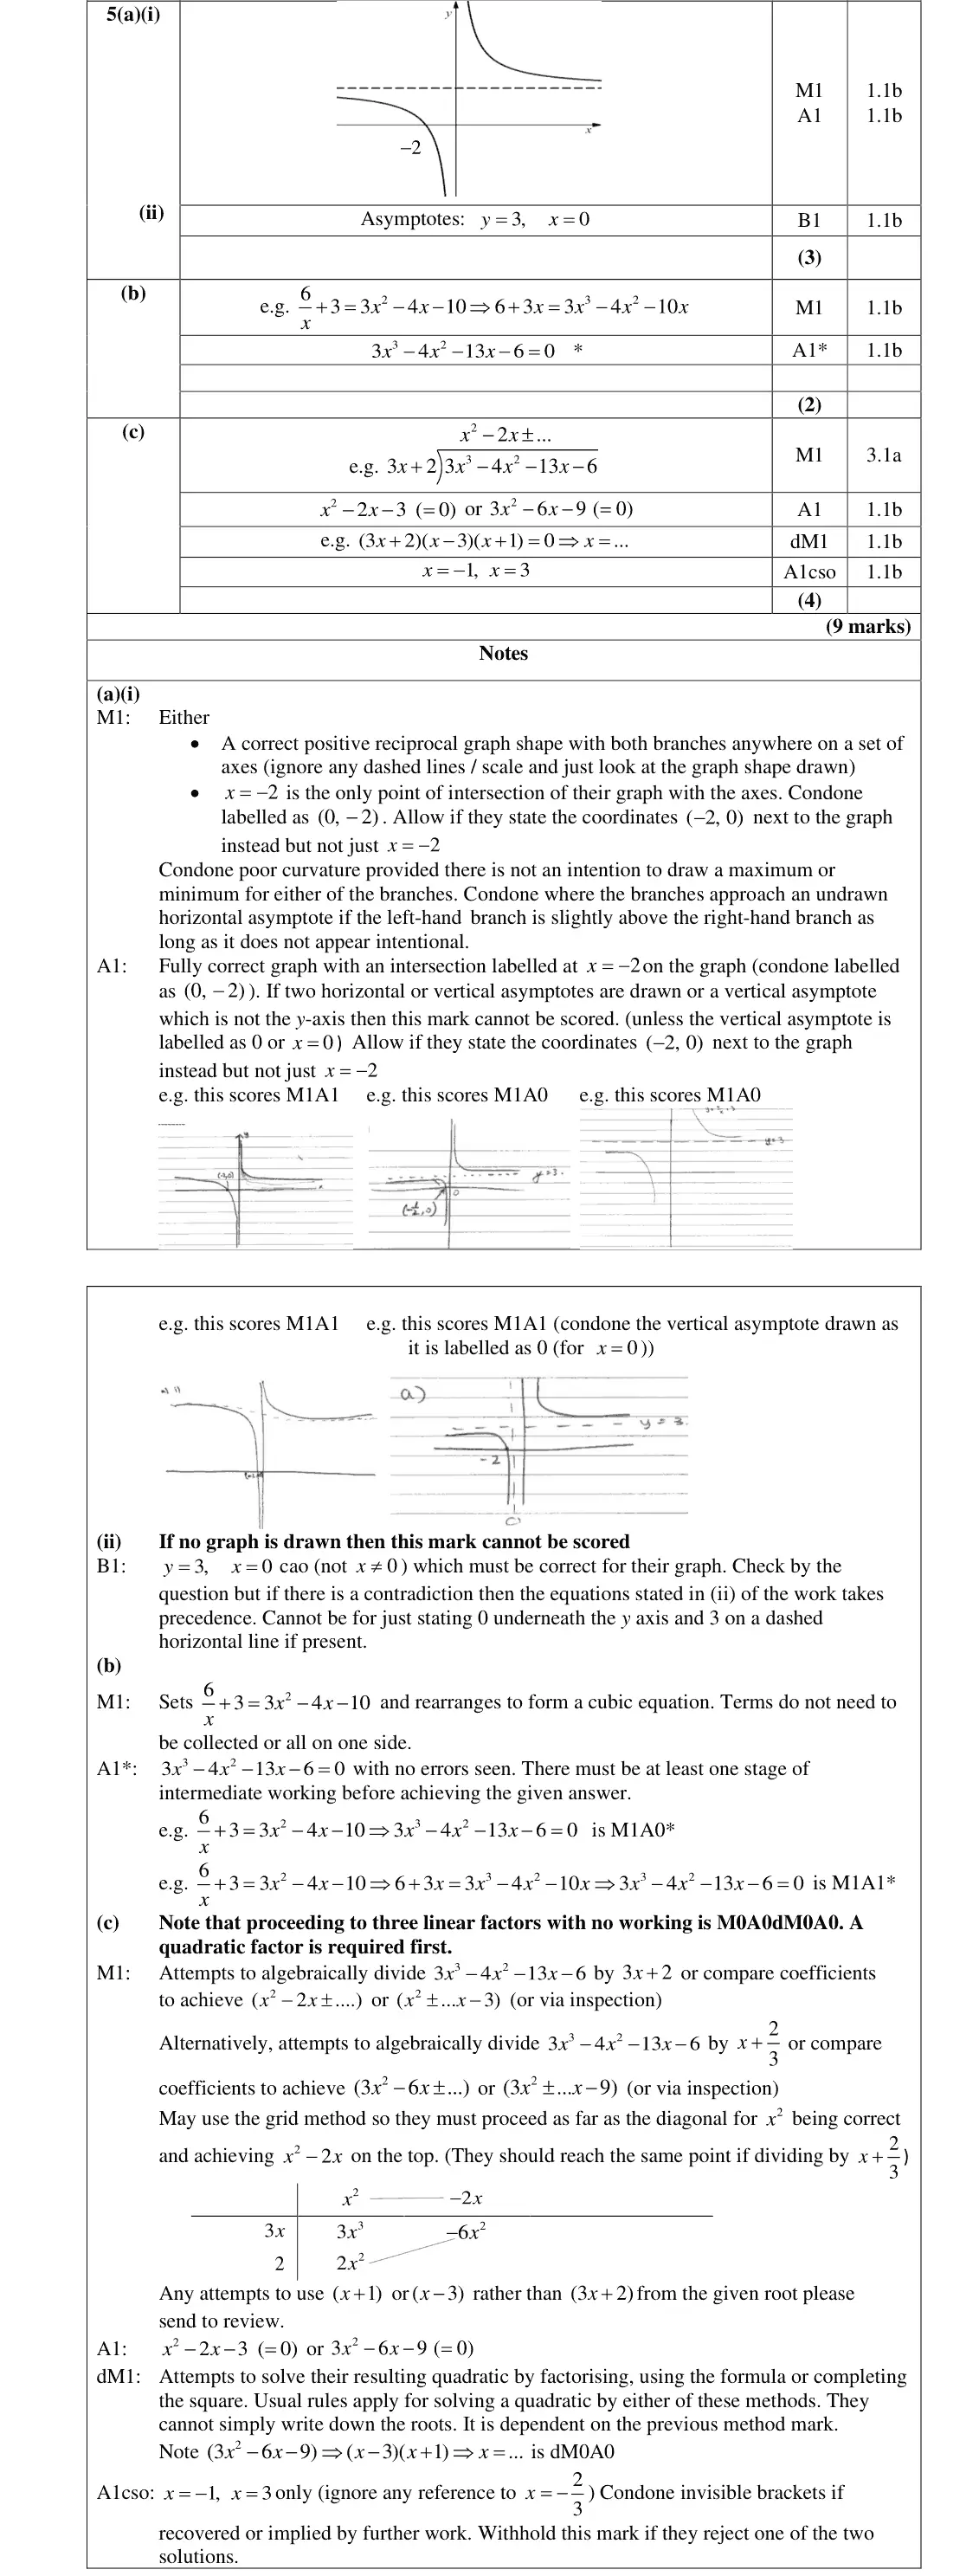
This question tested candidates’ ability to sketch graphs and to be able to divide polynomials. Part (a) required the sketching of a reciprocal graph. A significant proportion of candidates did not even attempt to sketch the graph; those that did often produced a good positive reciprocal graph with both branches, scoring the first mark. The second mark proved harder with many graphs being in the wrong place, with an extra asymptote and the x intercept not labelled. The y- axis with a dashed line next to it also resulted in losing the second mark as candidates were not aware that this was implying that their asymptote was not the y-axis. Part (a)(ii) required both the y = x = 3 0 equations of both asymptotes: was common but was not seen as often.
Common mistakes
y = 6/x translated up 3: both branches, crossing the x-axis only at (−2, 0)
asymptotes y = 3 and x = 0 (the y-axis, not a separate dashed line)
x ≠ 0 is not an equation
June 2024 · AS Paper 1 · Q5(b)2 marks
Mark scheme (whole question; this part is marked with the orange bar)
Examiner's comment
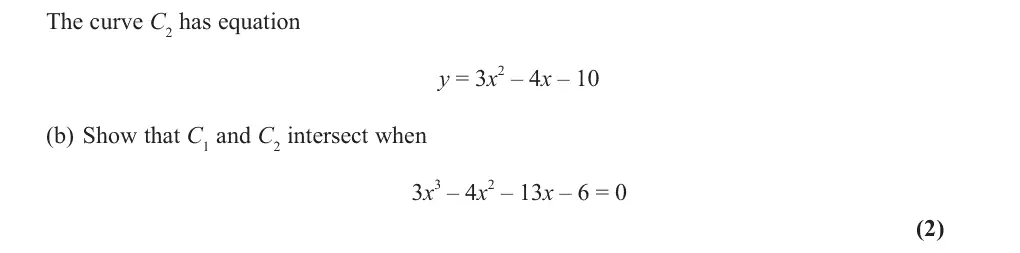
This question tested candidates’ ability to sketch graphs and to be able to divide polynomials. In part (b), candidates were required to equate both curves and rearrange to obtain a given answer. This was very well answered with the most common error being slips on the indices and not equating the final answer to zero. Those who were unsure what was being asked just proceeded to solve the cubic on their calculator.
Common mistakes
equate 6/x + 3 = 3x² − 4x − 10 and multiply through by x
at least one intermediate line
"= 0" needed
June 2024 · AS Paper 1 · Q8(b)2 marks
Mark scheme (whole question; this part is marked with the orange bar)
Examiner's comment
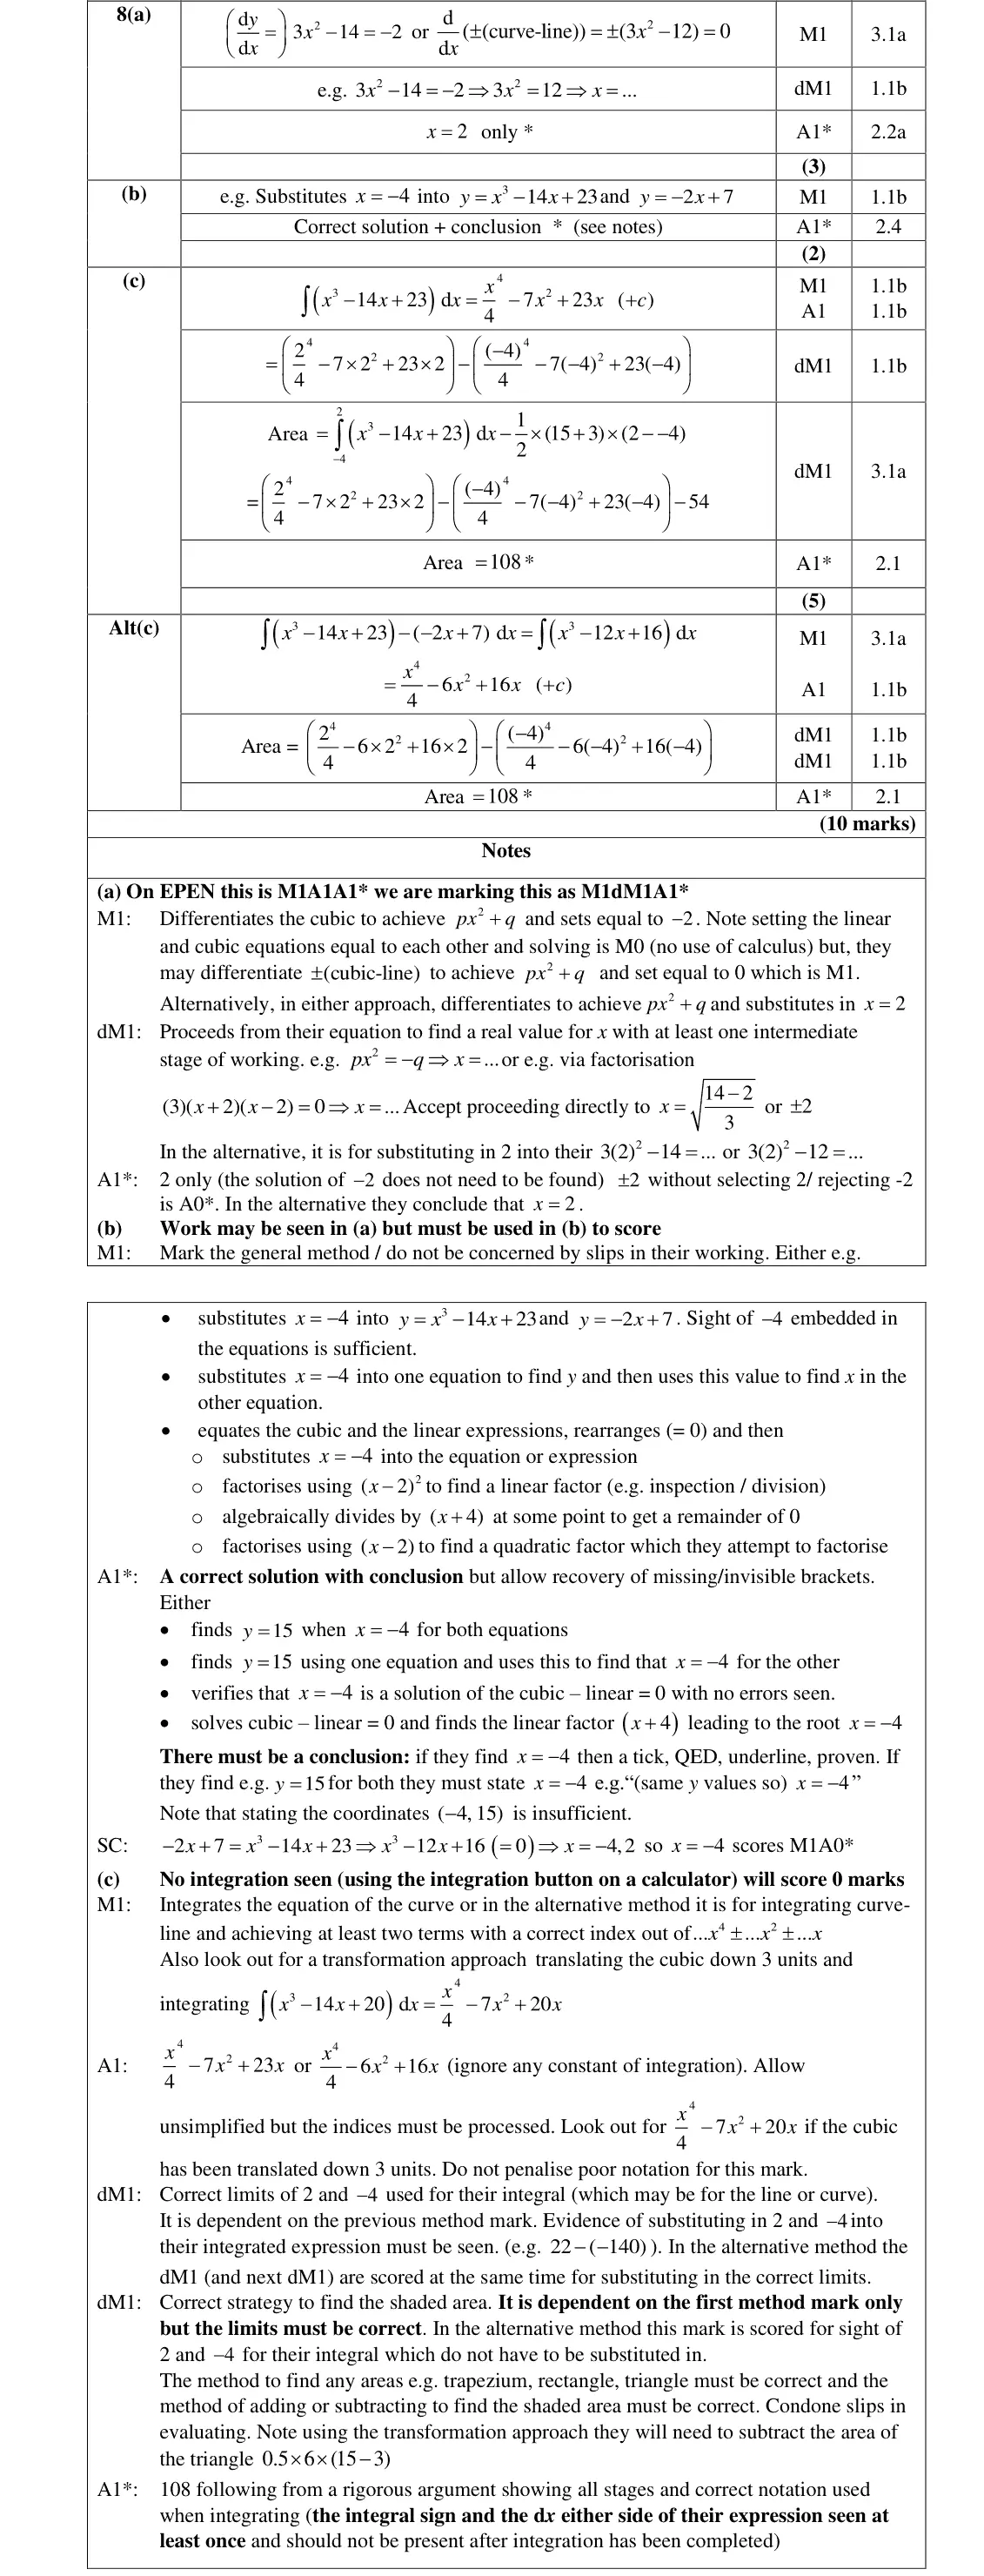
Marks awarded in this question were generally quite varied. Often candidates made progress in (c) only, by attempting some integration with little correct work seen in (a) or (b). Each part of this question presented a given answer, and candidates who failed to observe the warning in the question about showing all stages of their working, or relying entirely on calculator technology, often lost marks. Those who attempted part (b) employed many varied methods. The easiest approach was to simply to verify that both the line and the curve passed through the point ( 4, 15) - showing sufficient working. Many though, subtracted the equations of the line and the curve again to obtain 3 12 16 y x x = - + . Candidates then either verified that 4 x = - was a solution of 3 12 16 0 x x - + = , or attempted to solve this equation. Those who reached 4 x = - by factorising via 2 ( 4)( 2) 0 x x + - = were in a position to score both marks, but a number relied on their calculator equation solver, and could only be awarded the first mark in part (b). Candidates often lost the final mark for not writing a full conclusion. To score full marks, candidates needed to reach 4 x = - showing sufficient working using a valid method, and also indicate that they had completed the proof.
Common mistakes
substitute x = −4 into both equations to get y = 15 and conclude
or factorise x³ − 12x + 16 = (x − 2)²(x + 4)
stating (−4, 15) alone is insufficient
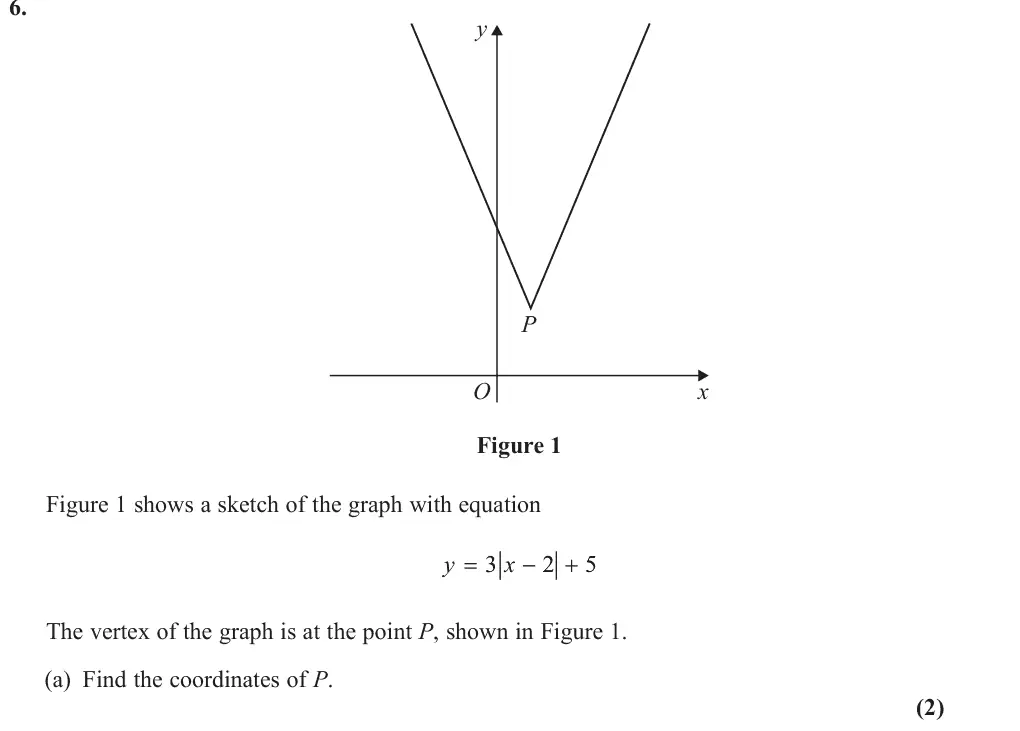
June 2024 · Paper 1 · Q6(a)2 marks
Mark scheme (whole question; this part is marked with the orange bar)
Examiner's comment
This question on the modulus function provided plenty of access and there were very few blank responses to any part, although many found part (c) challenging. The overwhelming majority of candidates answered part (a) correctly, demonstrating a strong understanding that the minimum y value must occur when 2 0 x - = . The answer was often written down without working. Those candidates that did not gain full marks often achieved the method mark for one correct coordinate. The majority of candidates who scored no marks found the y intercept of the modulus curve instead.
Common mistakes
vertex where x − 2 = 0, so P(2, 5)
giving the y-intercept is the common wrong answer
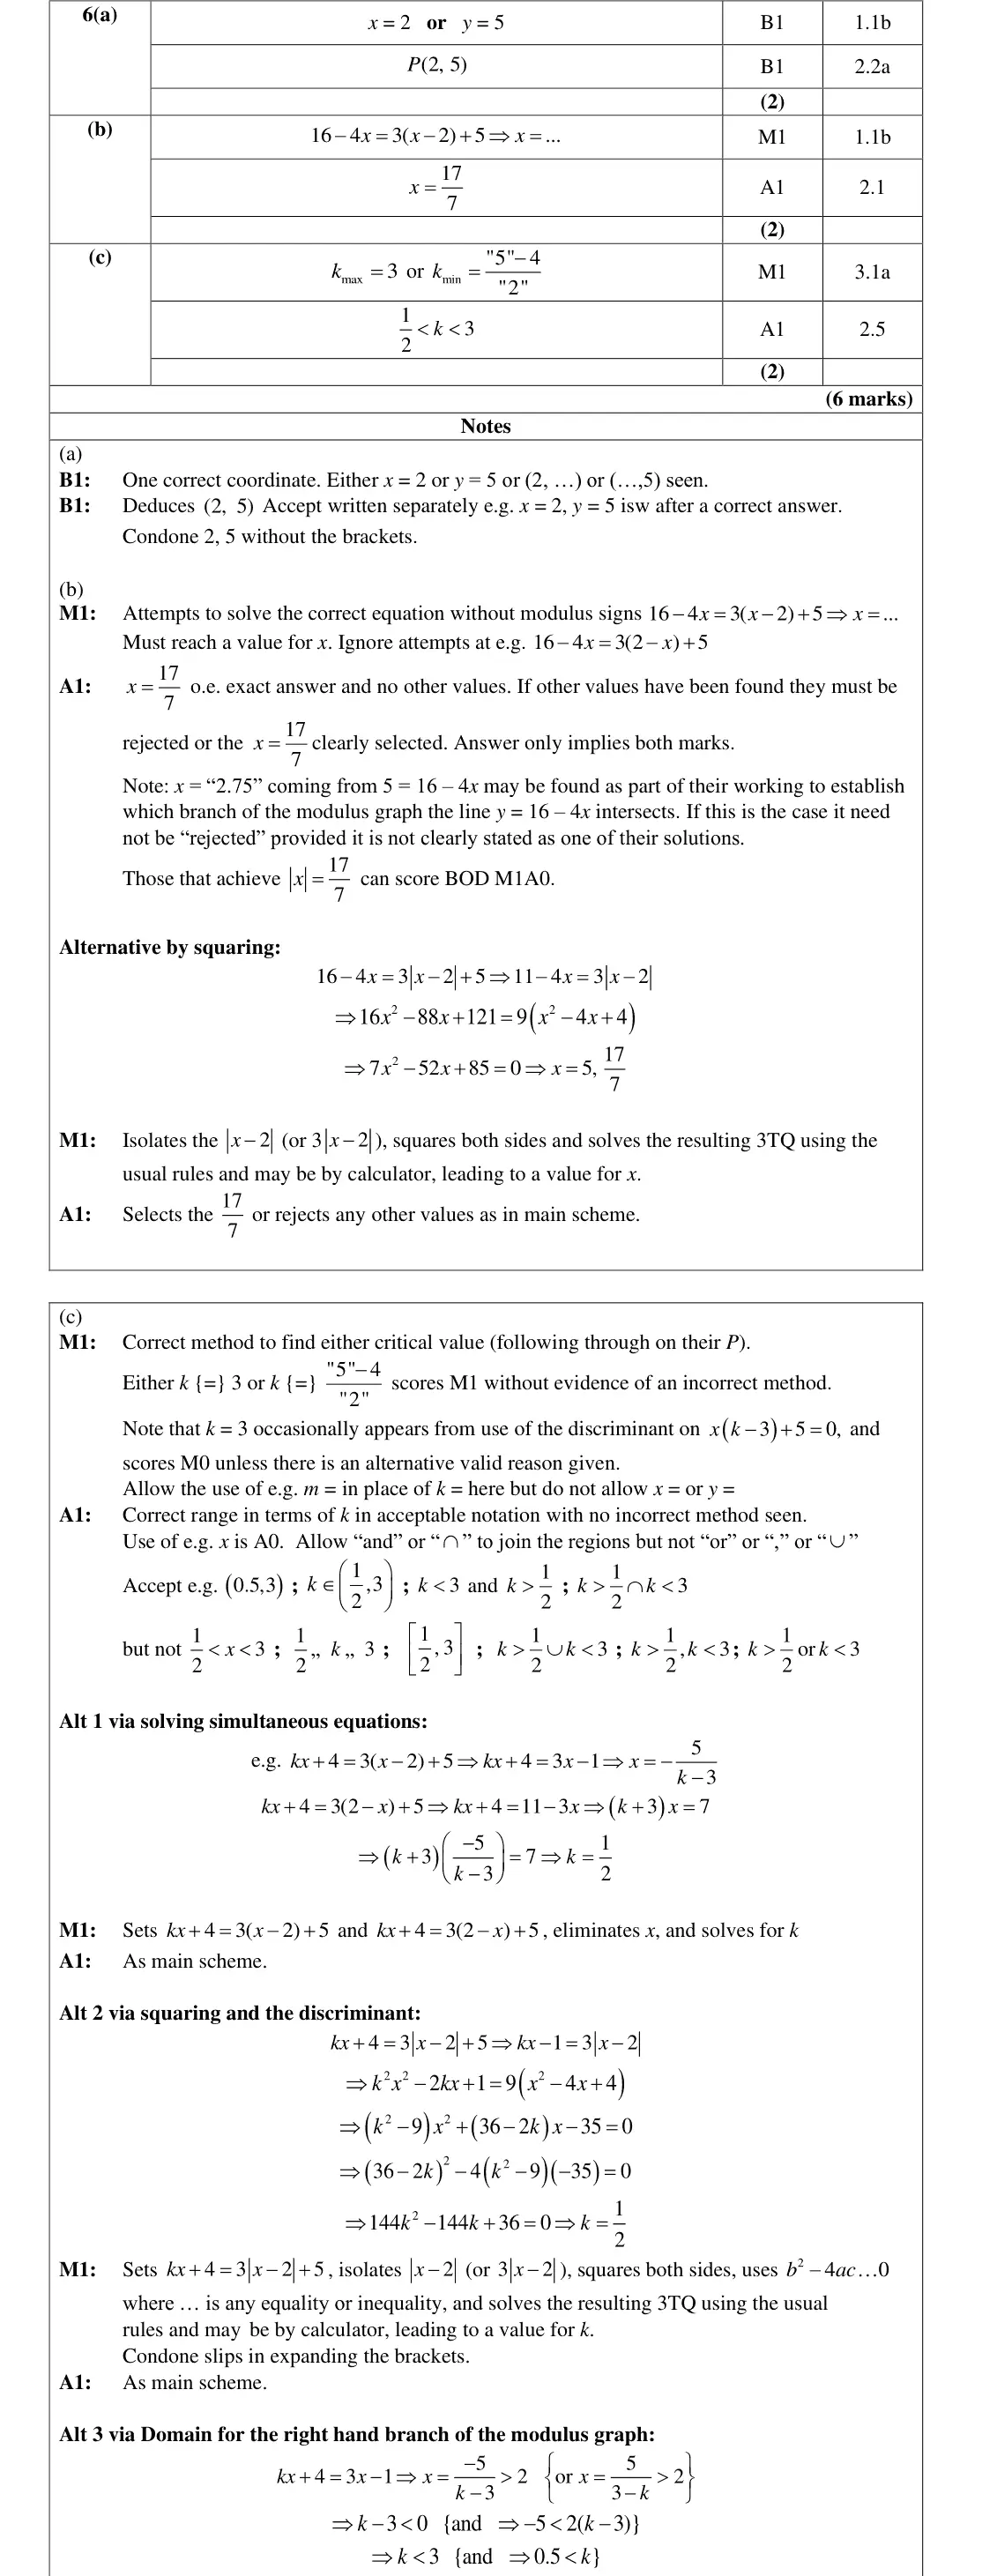
June 2024 · Paper 1 · Q6(b)2 marks
Mark scheme (whole question; this part is marked with the orange bar)
Examiner's comment
This question on the modulus function provided plenty of access and there were very few blank responses to any part, although many found part (c) challenging. In part (b), the most common approach was to remove the modulus signs and to attempt to solve two equations, usually ( ) 16 4 3 2 5 x x - = - + and ( ) 16 4 3 2 5 x x - = - - + . The more confident candidates had already established that the line would only intersect the right-hand branch of the modulus graph. The most common error in processing was thinking that 3 2 x - was equivalent to 3 6 x + , but, pleasingly, this was less common than in previous series. Some candidates kept the modulus signs in their equation throughout which made the equation difficult to manipulate. Disappointingly, a surprisingly large number of candidates rearranged their equations poorly by not performing inverse operations correctly. For those that lost the accuracy mark in part (b), the most frequent reason was because they failed to reject the solution 5 x = . Those using the diagram to aid visualisation of the problem were generally more successful in rejecting this extra “solution”. Some strong candidates demonstrated an excellent understanding of the relevant domains for each branch of the modulus graph and rejected x = 5 as they had established that an intersection with this branch required x < 2.
Common mistakes
line meets only the right-hand branch: 16 − 4x = 3(x − 2) + 5 gives x = 17/7
reject x = 5 from the other branch
3(x − 2) is not 3x + 6
June 2024 · Paper 1 · Q6(c)2 marks
Mark scheme (whole question; this part is marked with the orange bar)
Examiner's comment
This question on the modulus function provided plenty of access and there were very few blank responses to any part, although many found part (c) challenging. Part (c) was found to be less accessible with few candidates scoring full marks for a correct range for k. The candidates that were the most successful in this part of the question were generally those who had adopted a visual approach in the earlier parts of the question and understood how to find the minimum and maximum value of k using their knowledge of gradients. There was more success in finding the correct lower critical value of 0.5 with the most efficient solutions using the coordinates of P with y = kx + 4, but many candidates failed to realise that there was an upper limit for k. There was a reluctance to use diagrammatic reasoning and most resorted to complicated algebra. Many set up simultaneous equations in x and k but did not appear to understand what they were attempting to achieve, failing to solve for k and therefore these attempts did not gain any marks. There were many erroneous attempts that fortuitously achieved k = 3 through an attempt to use a discriminant (despite starting with a non-quadratic equation), and these invalid approaches scored no marks on their own. A few attempted squaring both sides of the equation to form a quadratic equation and then using the discriminant, but this approach often failed due to not isolating an appropriate term (such as 2 x - ) before squaring. Relatively few candidates considered the gradient of the modulus graph and hence failed to obtain an upper bound for k, which meant many only achieved the method mark in this part. Overall, candidates' use of inequality notation was good and although set notation was not required, the vast majority of those that used it did so correctly.
Common mistakes
line through (0, 4): critical gradients through P (k = ½) and parallel to the right branch (k = 3)
many miss the upper limit
½ < k < 3 joined with "and"/∩, not "or"
discriminant on a non-quadratic is invalid
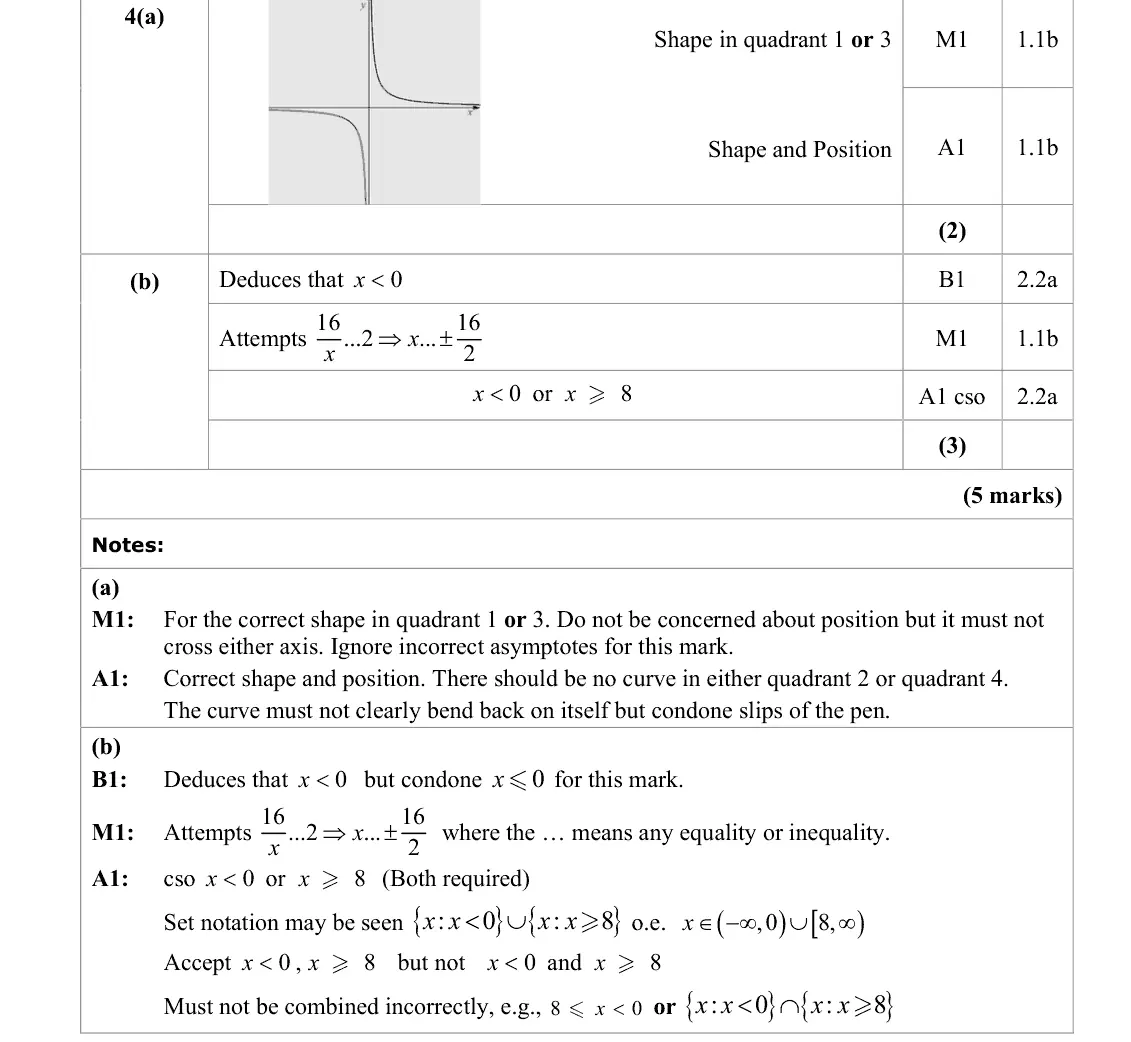
June 2023 · AS Paper 1 · Q4(a)2 marks
Mark scheme (whole question; this part is marked with the orange bar)
Examiner's comment
In part (a), most candidates appeared to know what the reciprocal graph should look like, and the majority positioned it in the correct quadrants. There were a few, though in the minority, who only sketched the section of the graph in the first quadrant. Some candidates actually worked out values and plotted the graph. Often the two asymptotes appeared to be quite adrift of the two axes and occasionally the ends of the curves drifted away from the axes, but it was usually apparent what the candidate’s intention was. There were many candidates who ignored the blank space and sketched their graphs on the lined page.
Common mistakes
y = k/x with k > 0: two branches in quadrants 1 and 3 only, approaching but not crossing either axis
sketching only the first-quadrant branch
June 2023 · AS Paper 1 · Q4(b)3 marks
Mark scheme (whole question; this part is marked with the orange bar)
Examiner's comment
In part (b), most candidates only scored 1 mark out of 3 as they did not consider the section of the graph where x was negative. Those who sketched the line y = 2 on the graph were far more likely to identify the region x < 0, although this was often given as x 0 despite the curve being undefined at x = 0. As such, fully correct answers were few and far between.
Common mistakes
x < 0 also satisfies the inequality (negative branch)
x ⩽ 0 is wrong as the curve is undefined at x = 0
answer x < 0 or x ⩾ 8, not "and" or ∩
most found only x ⩾ 8
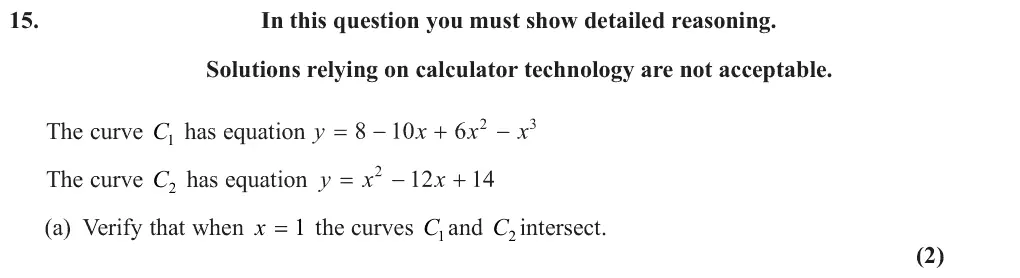
June 2023 · AS Paper 1 · Q15(a)2 marks
Mark scheme (whole question; this part is marked with the orange bar)
Examiner's comment
This question began with the familiar calculator warning which was unfortunately ignored by a significant proportion of candidates. As mentioned previously, candidates must be clear on what is allowed when these warnings are stated, or they risk losing a number or marks. In part (a), the majority of the candidates were able to gain the first mark by either substituting 1 into the two equations separately (and almost always achieving 3 y = in both cases) or by setting the two equations equal to each other and then substituting in 1 as required. The majority of candidates, having achieved the point of intersection, drew the correct conclusion but there were many candidates who did not make any suitable comment.
Common mistakes
substitute x = 1 into both: y = 3 for each
a conclusion that (1, 3) lies on both curves is needed
June 2023 · AS Paper 1 · Q15(b)5 marks
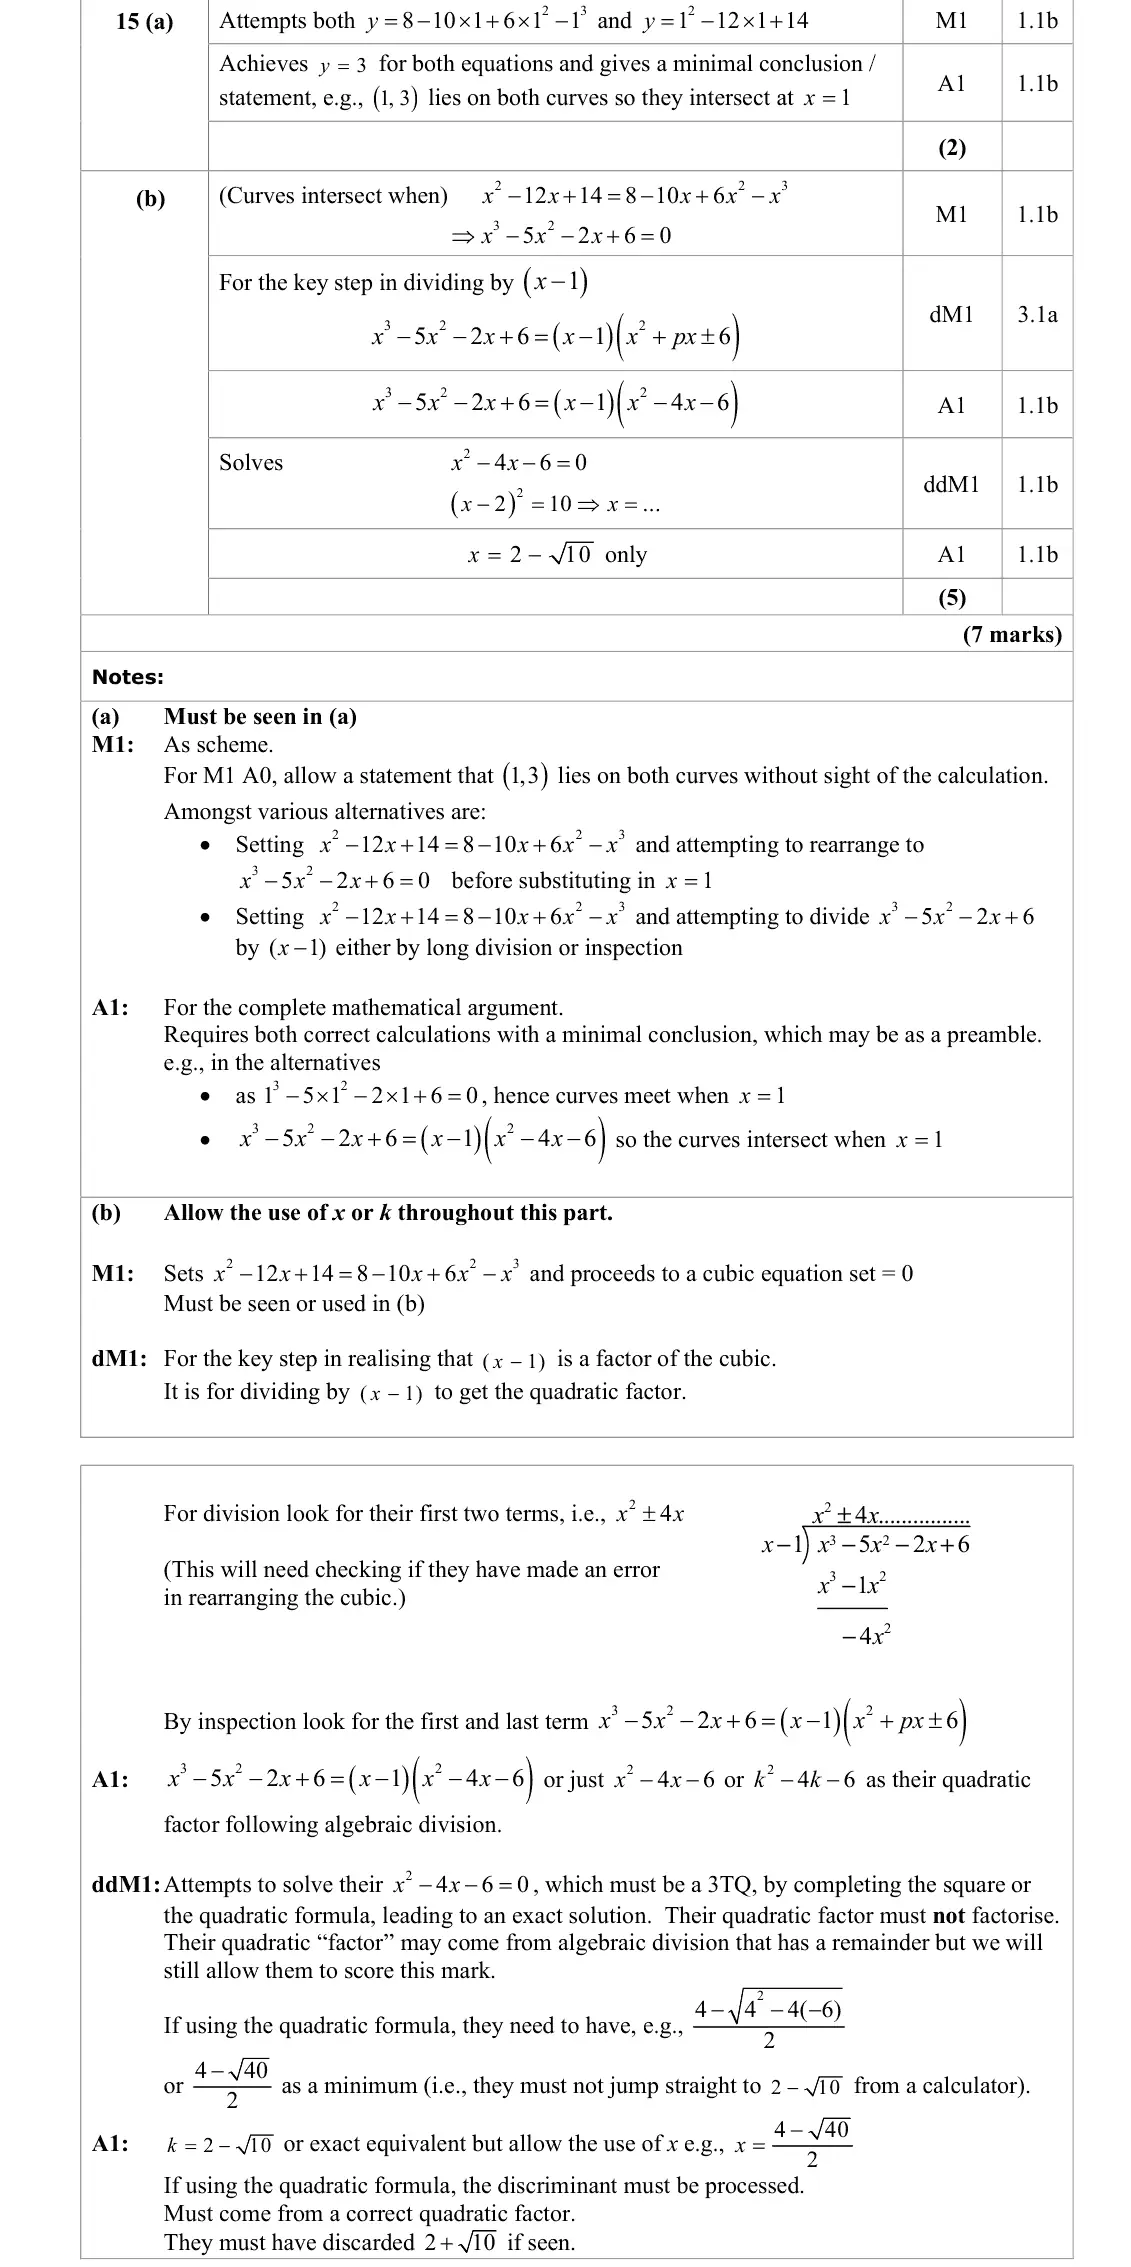
Mark scheme (whole question; this part is marked with the orange bar)
Examiner's comment
This question began with the familiar calculator warning which was unfortunately ignored by a significant proportion of candidates. As mentioned previously, candidates must be clear on what is allowed when these warnings are stated, or they risk losing a number or marks. In part (b), the vast majority of candidates achieved the cubic equation required by equating the two given equations and rearranging to set equal to 0, but a significant proportion ignored the guidance at the top of the question and proceeded to solve the question directly on their calculator, resulting in a maximum mark of 1 out of 5. For those that proceeded further, many used inspection to factorise the cubic using the given factor ( ) 1 x - , while others attempted algebraic division, generally very successfully, achieving the correct quadratic 2 4 6 x x - -. Occasionally, the rearrangements that candidates used resulted in a negative cubic, but despite making the division more challenging it was pleasing that candidates were still generally able to complete this part successfully. However, having arrived at a suitable quadratic, another significant proportion relied on their calculator to solve the resulting equation (set equal to 0) and forfeited the final two marks. For those that showed full working, many assumed that 0 k and chose the incorrect solution, despite often writing 0 k as their justification for rejecting (the correct) 2 10 - . As a result, there were very few candidates who achieved full marks for this question.
Common mistakes
equate to get x³ − 5x² − 2x + 6 = 0
(x − 1) is a factor from (a): divide to get x² − 4x − 6
solve exactly by completing the square or formula, not calculator
k < 0 so k = 2 − √10 (2 + √10 is positive)
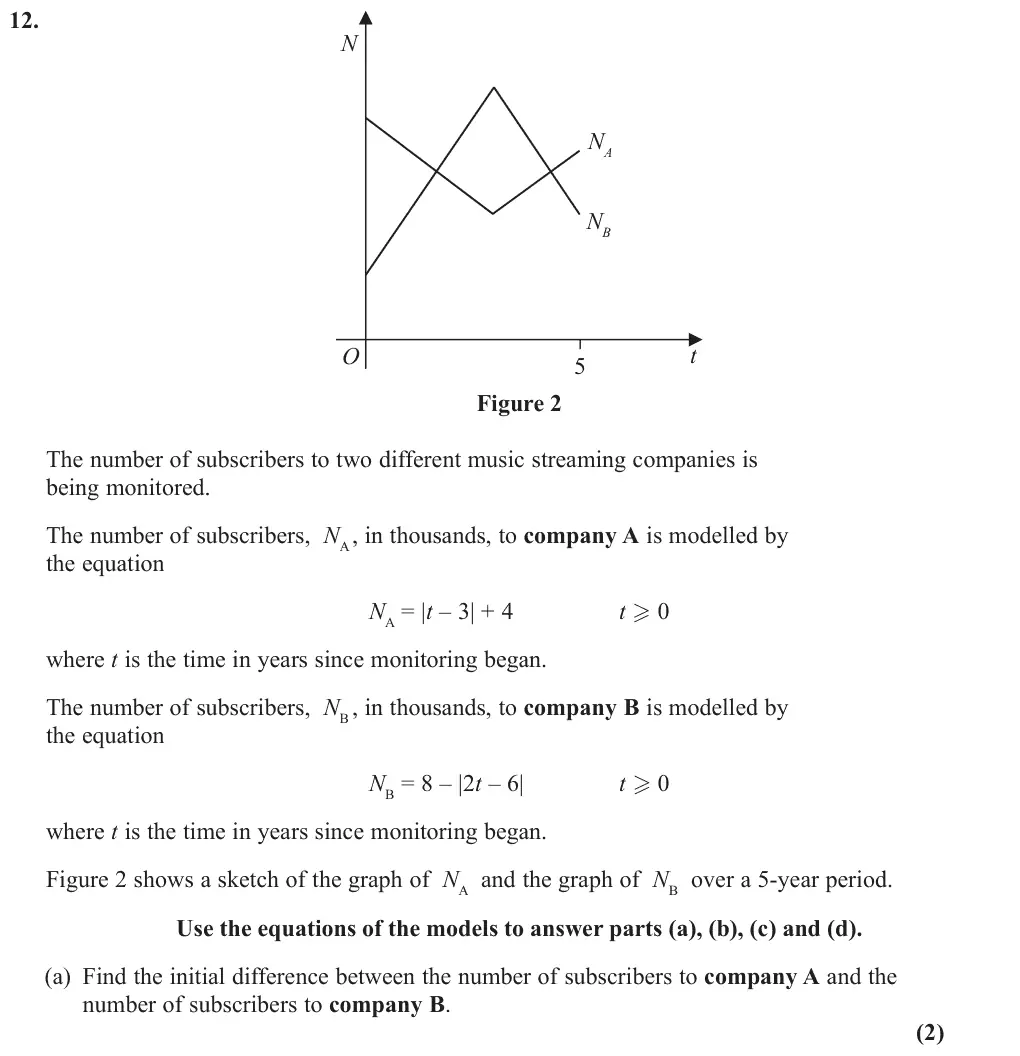
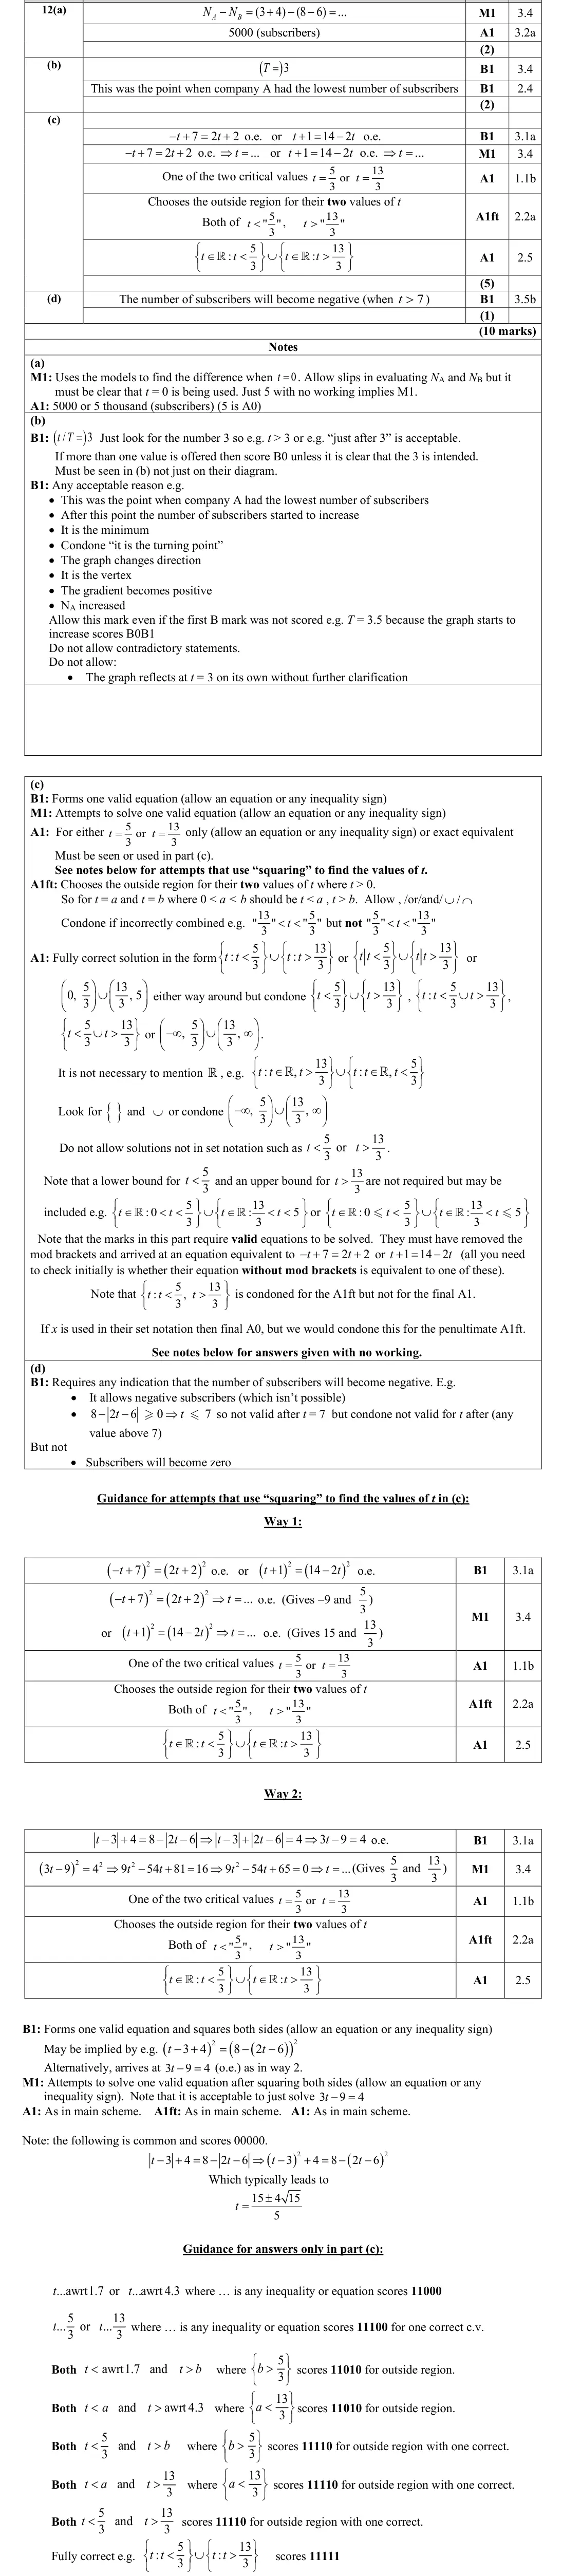
June 2023 · Paper 2 · Q12(a)2 marks
Mark scheme (whole question; this part is marked with the orange bar)
Examiner's comment
In part (a), most candidates were successful in understanding the requirement to substitute zero into NA and NB. There were some processing errors resulting in incorrect values for NA and NB. A significant number failed to score the method mark by not subtracting their values. There were a few candidates that did not recognise the question was scaled in thousands and left a final answer of 5.
Common mistakes
substitute t = 0: N_A − N_B = 7 − 2 = 5 thousand = 5000 subscribers (5 alone loses the A mark)
must subtract
June 2023 · Paper 2 · Q12(b)2 marks
Mark scheme (whole question; this part is marked with the orange bar)
Examiner's comment
In part (b), a large majority of candidates were able to deduce that T = 3 and most explanations were around the idea of the values increasing after this point. The next most common explanation centred on the graph being a minimum or having “turning point” at this location. There were also candidates who stated the gradient has increased or was positive.
Common mistakes
T = 3, when N_A is at its minimum and starts to increase (vertex of the modulus graph)
June 2023 · Paper 2 · Q12(c)5 marks
Mark scheme (whole question; this part is marked with the orange bar)
Examiner's comment
In part (c), a significant number of candidates failed to identify either of the correct equations. Many were able to identify and solve correctly at least one equation to find one critical value for t. A common error often followed their correct equation of 5 = 3t when they wrote the value of t as 3/5 and similarly, but less common, 13 = 3t leading to 3 13 t = . Some students kept the modulus signs within their equations and ignored them at various stages in their working which often led to incorrect equations. There was an array of methods seen trying to negotiate the modulus signs, and A B A B + = + was seen a few times and 2 2 2 A B k A B k + = + = was also seen. Those who found two values for t were generally able to score the 2nd follow through accuracy mark for choosing the outside region for their critical values. The biggest challenge was the final accuracy mark as quite a few candidates did not write the inequalities using set notation. Those who attempted set notation usually were unable to write their answer correctly in that form, some confusing with . A common answer was 5 13 3 3 t t which was condoned for this final mark. Those who attempted the squaring method in this part had minimal success depending on when they chose to square.
Common mistakes
from the graph form the two valid linear equations without modulus: −t + 7 = 2t + 2 (t = 5/3) and t + 1 = 14 − 2t (t = 13/3)
outside region
answer in set notation {t : t < 5/3} ∪ {t : t > 13/3}
5 = 3t written as t = 3/5
squaring incorrectly
ignoring modulus signs
June 2022 · AS Paper 1 · Q7(b)2 marks
Mark scheme (whole question; this part is marked with the orange bar)
Examiner's comment
Generally, candidates scored well in the first two parts of this question, by factorising the cubic expression and drawing a graph. The final part, however, where the candidates were required to find a range, was very poorly answered, with few gaining any marks and very few reaching the correct final answer. Part (b) proved to be accessible to most candidates and there were many fully correct responses seen. Candidates who had made a sign error in part (a), were often able to recover and went on to draw a completely correct graph. Axes were labelled with a scale in almost all diagrams. However, a minority of candidates dropped one mark by sketching the graph of a positive cubic (with the correct roots), whilst a few candidates did not have their negative cubic curve going through the required roots.
Common mistakes
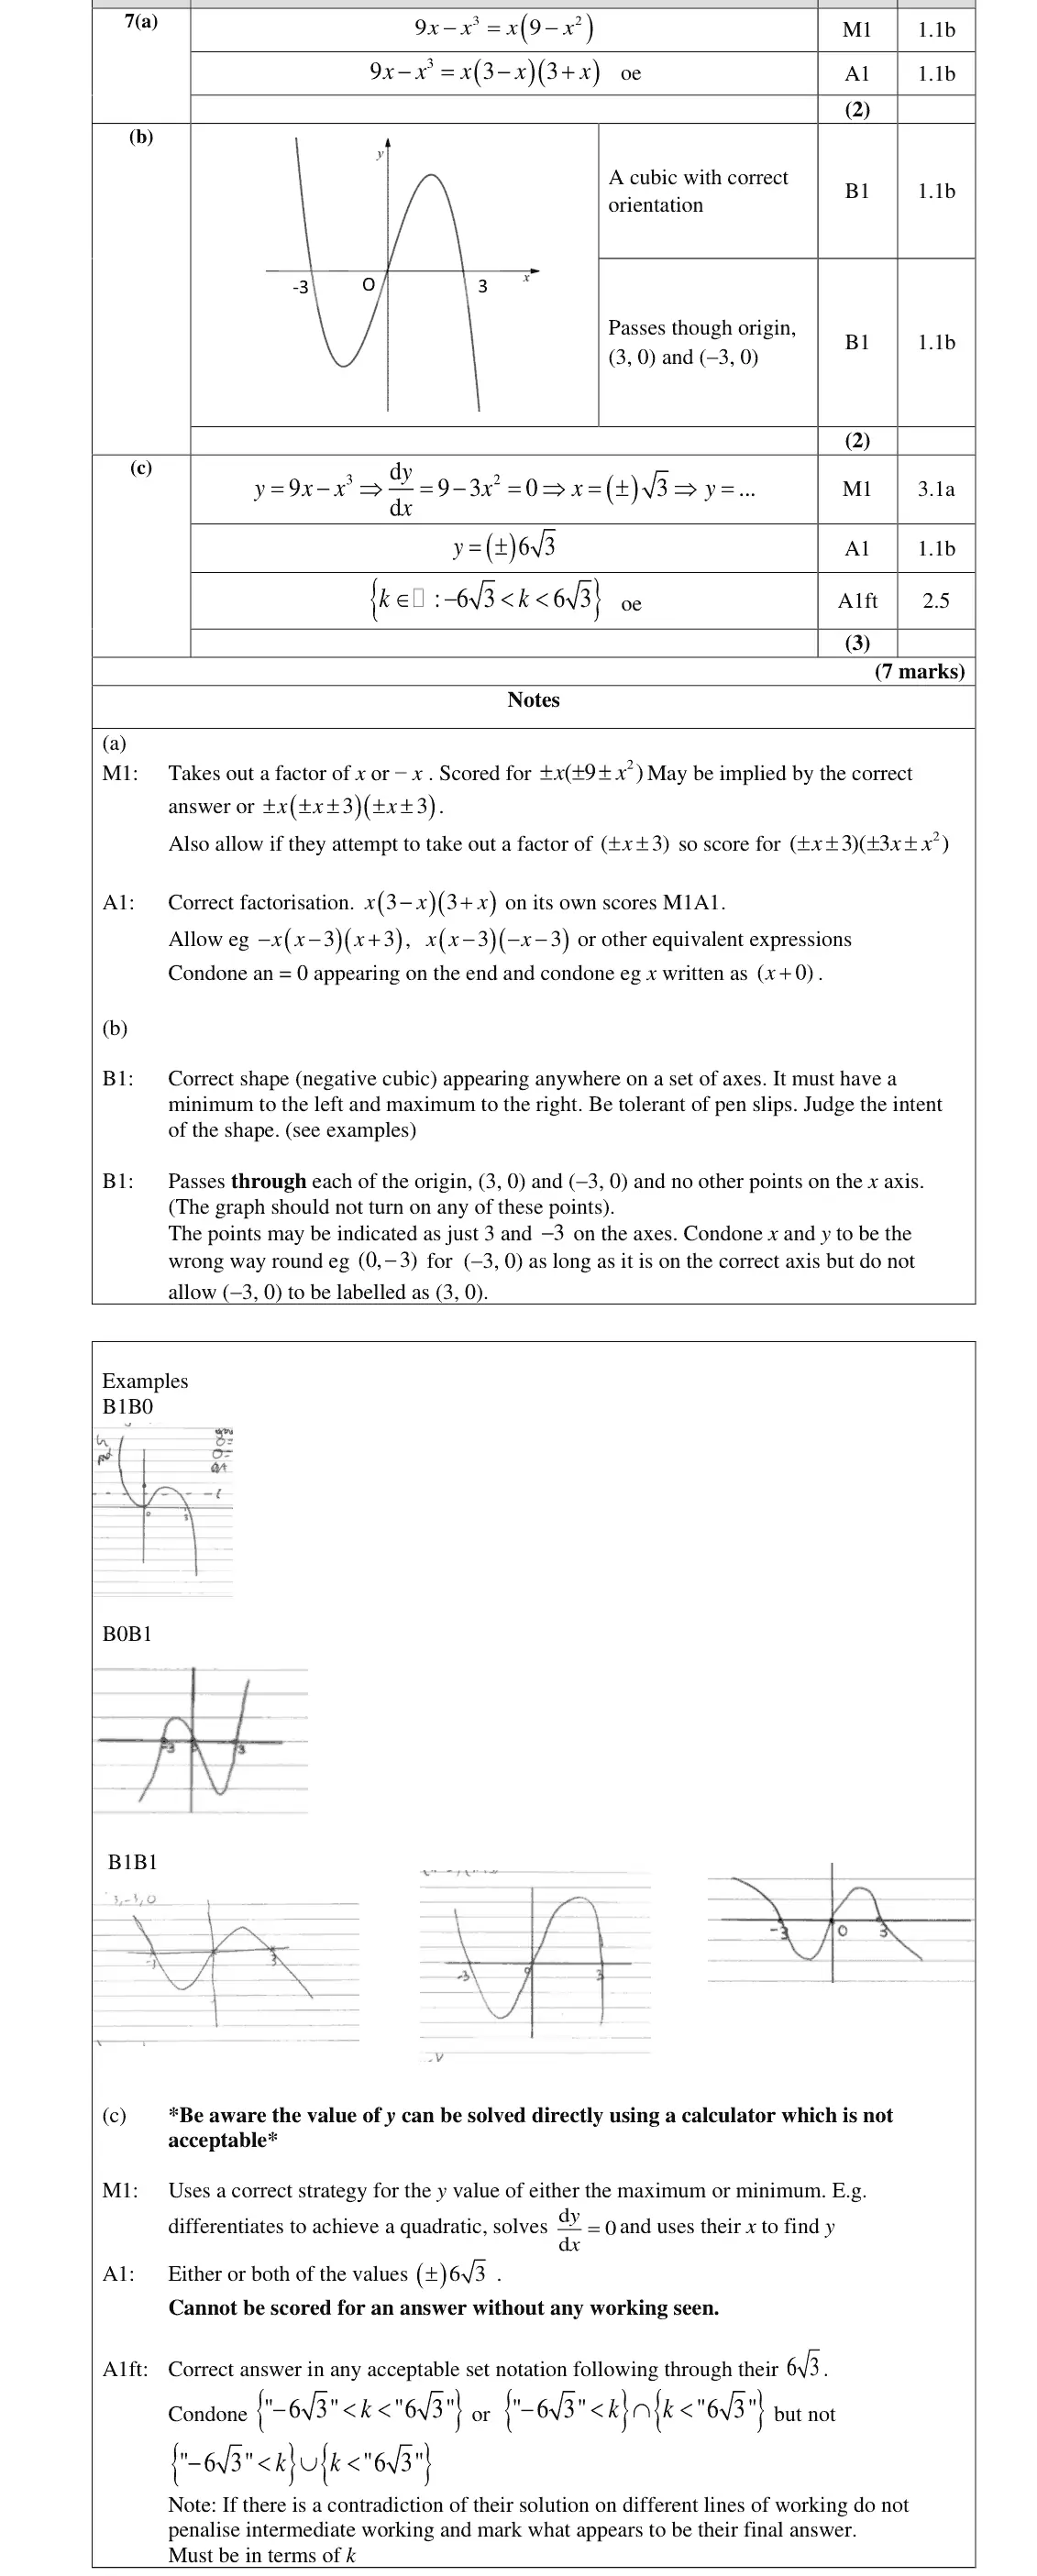
negative cubic (minimum on the left, maximum on the right) through (−3, 0), O and (3, 0)
a positive cubic loses a mark
June 2022 · AS Paper 1 · Q7(c)3 marks
Mark scheme (whole question; this part is marked with the orange bar)
Examiner's comment
Generally, candidates scored well in the first two parts of this question, by factorising the cubic expression and drawing a graph. The final part, however, where the candidates were required to find a range, was very poorly answered, with few gaining any marks and very few reaching the correct final answer. Part (c) proved to be very challenging. Candidates were unable to identify the need to differentiate with many of them treating the equation as if it were quadratic and attempting to find the discriminant. Candidates who recognised the need to differentiate generally went on to find the x coordinates successfully, however, it was common for these candidates to write an inequality in terms of x rather than moving forward to find the associated y coordinates. It appears many candidates are not truly confident in the specific meaning of the terms “domain” and “range”. Of the relatively few candidates who did correctly calculate the y coordinate of the turning points, some still lost the final mark by failing to use correct set notation. A few responses were seen where decimal approximations to 6 3 had clearly been obtained from calculator technology alone and these gained no credit.
Common mistakes
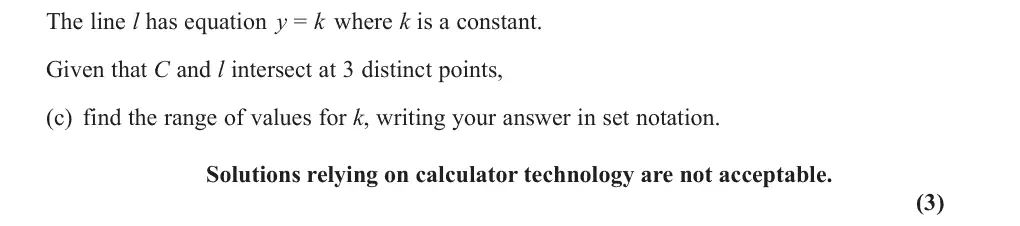
three intersections means k lies between the turning values: dy/dx = 9 − 3x² = 0, x = ±√3, y = ±6√3
using a discriminant is wrong (cubic)
answer in k, not x
set notation {k : −6√3 < k < 6√3} (union is wrong)
calculator decimals score nothing
June 2022 · Paper 1 · Q6(b)2 marksMedium
Mark scheme (whole question; this part is marked with the orange bar)
Examiner's comment
There was a very mixed response to this question on a cubic function with only one in eight candidates scoring all 6 marks. In part (b) the request to give the answer in set notation proved a challenge for many candidates, with many only gaining the M mark for correctly identifying at least one of the correct inequalities. A minority of candidates gained both marks by giving their answer in acceptable . set notation but there was widespread misapplication of ∩ rather than ∪
Common mistakes
horizontal line meets C once if k > 8 or k < 0
set notation {k : k > 8} ∪ {k : k < 0}
∩ instead of ∪ is common
June 2022 · Paper 1 · Q6(c)3 marksMedium
Mark scheme (whole question; this part is marked with the orange bar)
Examiner's comment
There was a very mixed response to this question on a cubic function with only one in eight candidates scoring all 6 marks. Part (c) required the candidates to find the equation of the curve. A very common response, which 2 without any appreciation of gained only the first mark, was to give their answer as ( 6) y x x = - 2 ( 6) y ax x = - the stretch factor. Candidates who did appreciate that it could be could easily use the coordinate (2, 8) to find the value of a and hence the equation of the curve. A sizeable minority of otherwise good candidates lost the final mark by incorrectly writing down the 1 ( 2 equation of the curve as . There were many more time consuming and long winded 6) C x x = - 4 methods seen here. A significant number of candidates formed the equation of a cubic, i.e. 3 2 y ax bx cx d = + + + and then attempted to use the points on the curve to find the values of a, b, c and d. This approach was rarely fully correct with many failing to identify that d = 0 or being able to form only 2 equations. A small minority of candidates did attempt to use the turning points at x = 2 and x = 6 to form the equation d y without again, an appreciation of the ( 2)( 6) x x x = - - d need for a stretch factor. It was disappointing to see how many candidates got bogged down in pages of algebraic working without noticing that this part of the question was only worth 3 marks.
Common mistakes
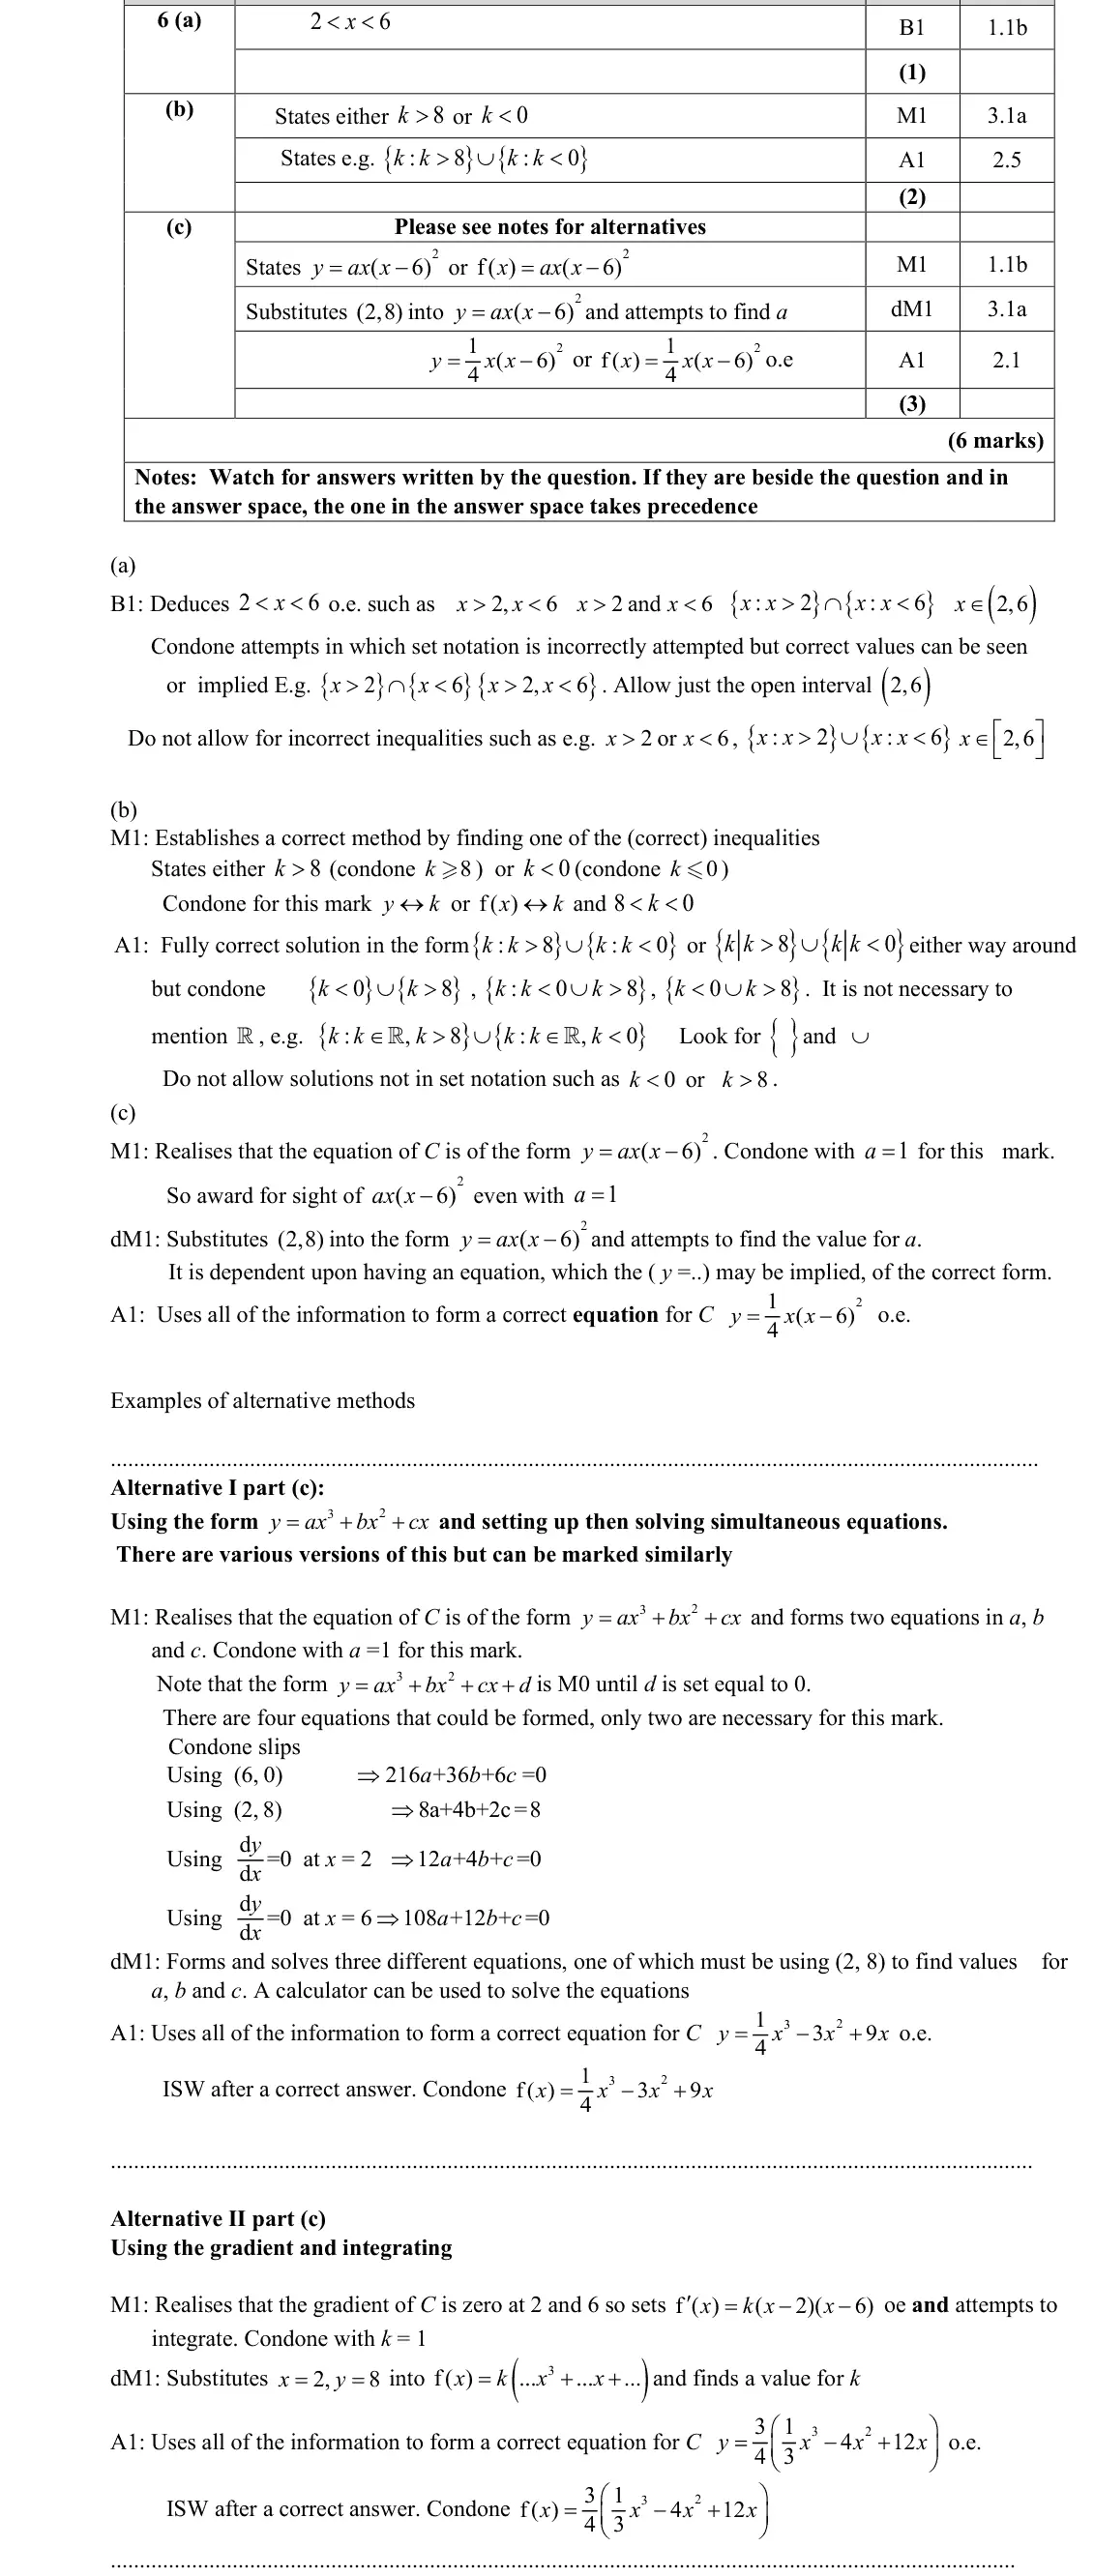
repeated root at 6: y = ax(x − 6)²
substitute (2, 8) to get a = ¼
y = x(x − 6)² without a scores only M1
general cubic ax³ + bx² + cx + d is long
June 2022 · Paper 1 · Q11(a)2 marksMedium
Mark scheme (whole question; this part is marked with the orange bar)
Examiner's comment
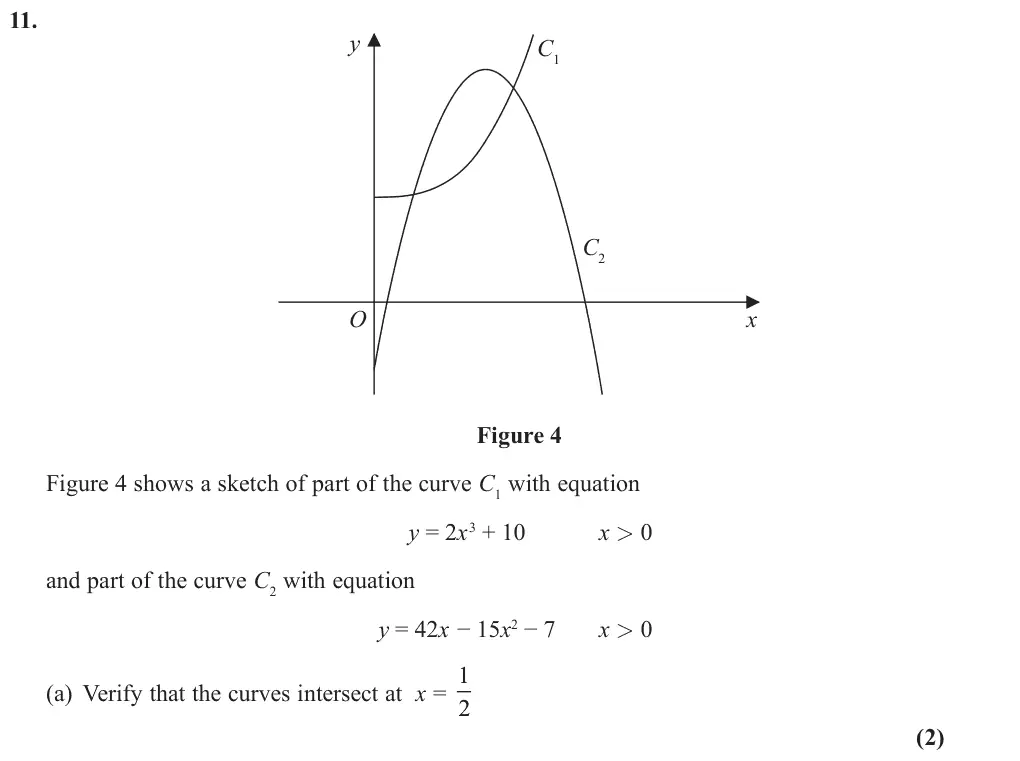
This question was based around the intersection of a cubic and a quadratic equation. It proved to be very accessible with many candidates able to make progress in both parts. In fact 30% of all candidates scored full marks on this question. Part (a) asked candidates to verify that the curves intersect at 1 . 2 x = The easiest and most common approach was to substitute 1 2 x = into both equations, obtain y values of 41 4 in each and then conclude that the curves did intersect. Candidates using this approach generally scored the method mark, but some lost the accuracy mark either from failing to show full details of the calculations, or from failing to state the conclusion that the curves intersect. Other methods seen included • setting the equations of the curves equal, rearranging to form a cubic, and then showing that 1 2 x = satisfied the resulting equation. Again, most gained the method mark, but again some lost the accuracy mark due to a lack of a conclusion. • setting the equations of the curves equal, rearranging to form a cubic, using the calculator to solve the cubic equation and then writing down the three solutions, indicating that one of the solutions was 1 . 2 x = This approach could only achieve the method mark here.
Common mistakes
substitute x = ½ into both: y = 41/4 for each, then conclude the curves intersect
June 2022 · Paper 1 · Q11(b)5 marksMedium
Mark scheme (whole question; this part is marked with the orange bar)
Examiner's comment
This question was based around the intersection of a cubic and a quadratic equation. It proved to be very accessible with many candidates able to make progress in both parts. In fact 30% of all candidates scored full marks on this question. In part (b) most candidates made some progress with weaker students scoring only the first mark for setting up the cubic equation. The majority were then able to divide by either 1 2 x - or ( ) 2 1 x - to form a quadratic factor and then equation which could then be solved to find the positive root. Marks lost were usually as a result of • slips in establishing the cubic equation or else errors in the division • not giving the exact answer of 4 33 -+ but instead its decimal equivalent • using a calculator to solve the cubic equation 2 3 2 15 42 17 0 x x x + - + =
Common mistakes
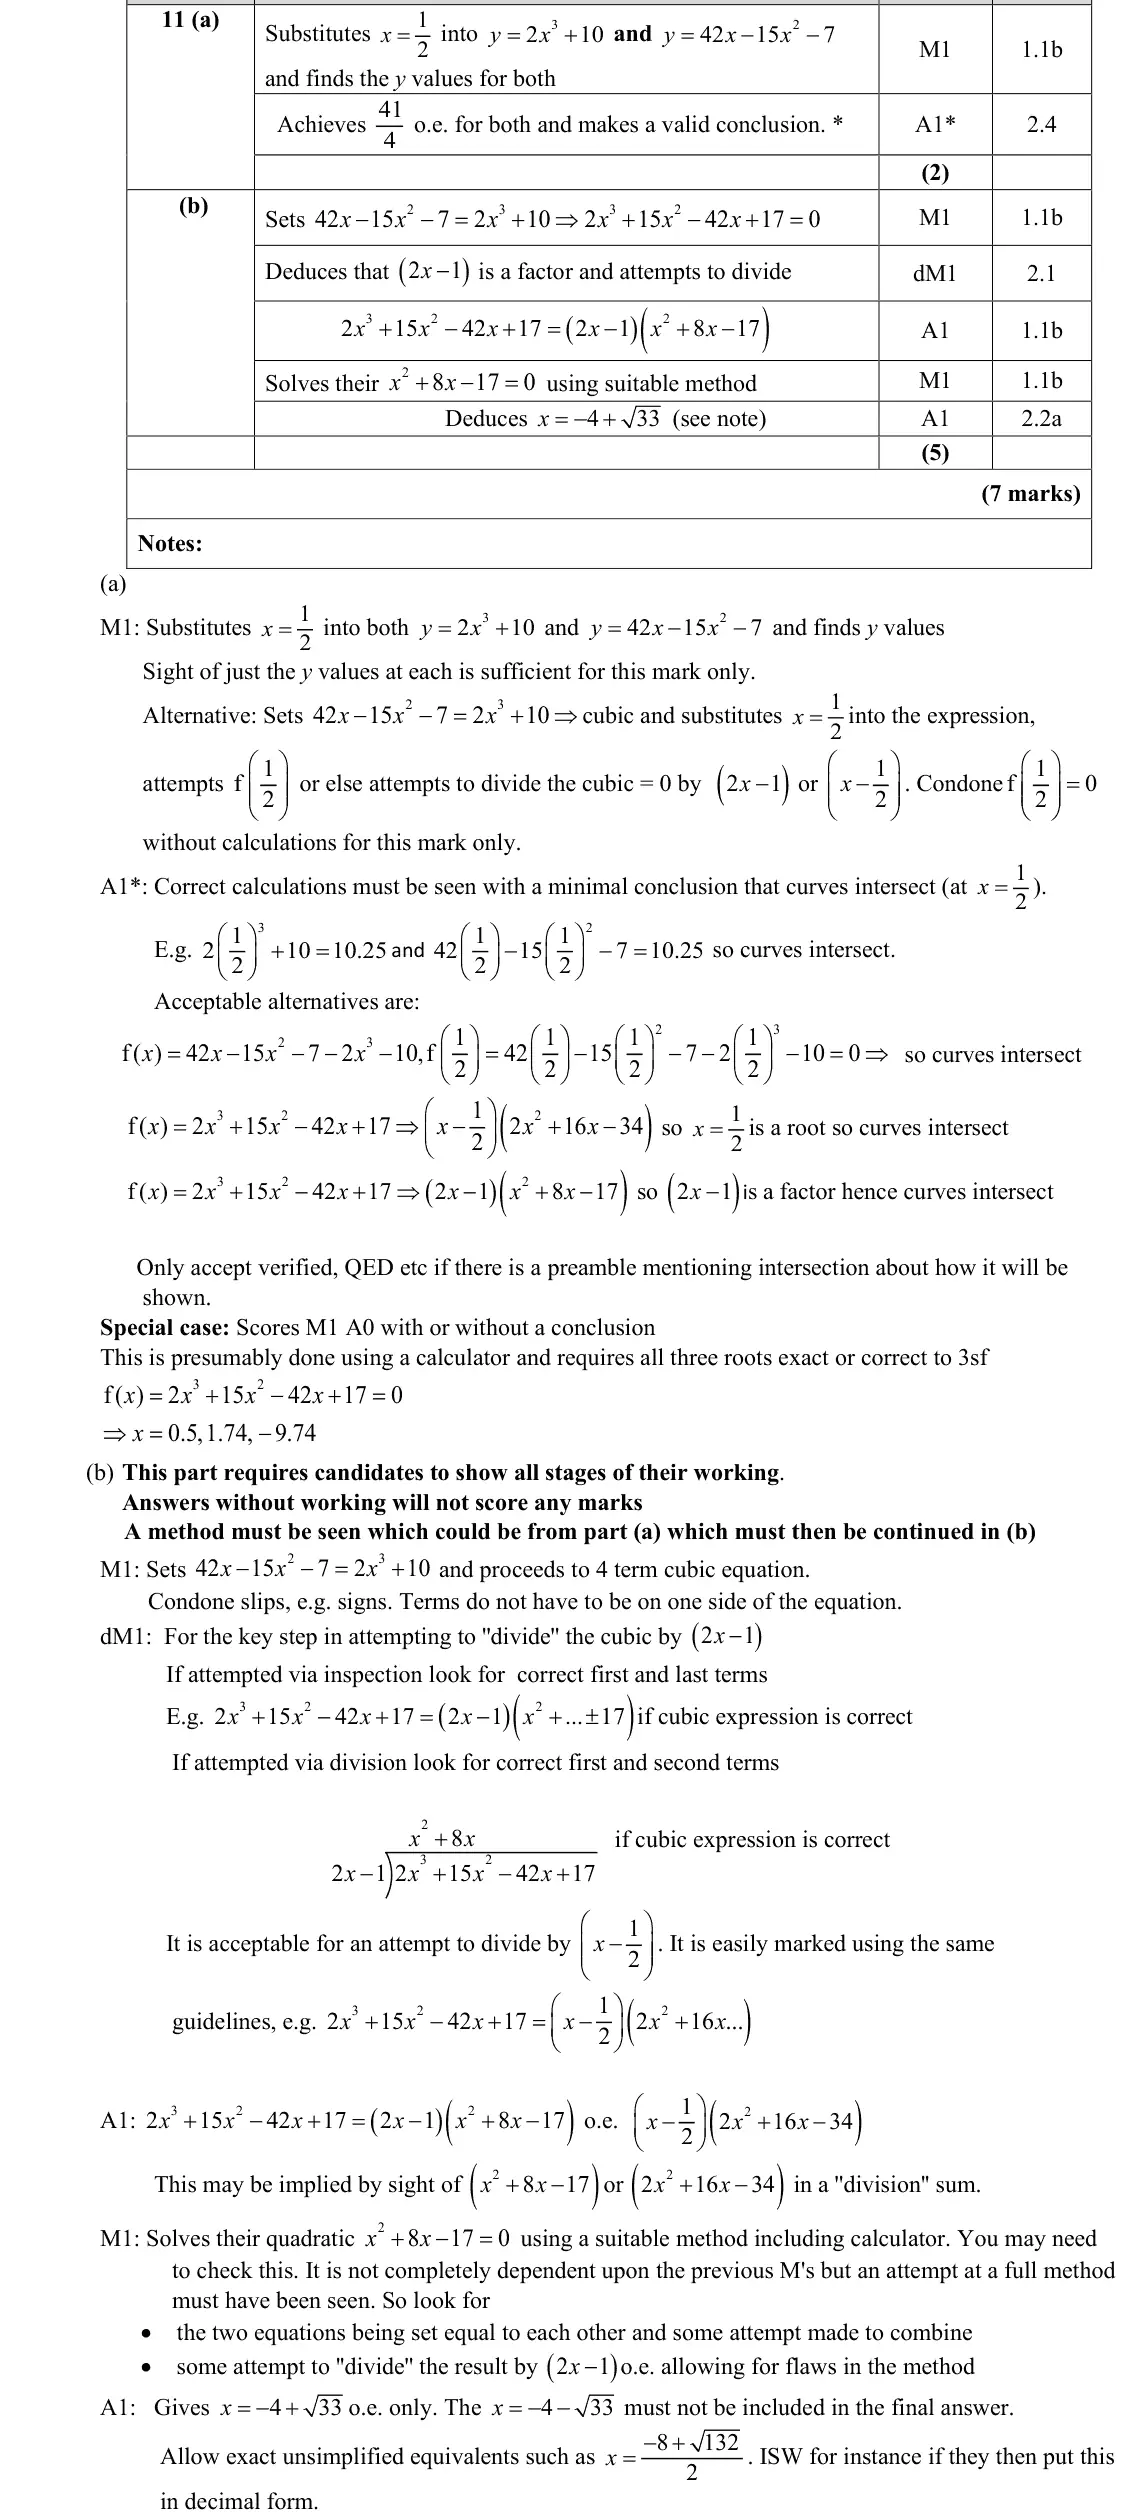
2x³ + 15x² − 42x + 17 = 0
divide by (2x − 1) to get x² + 8x − 17
x = −4 + √33 only (x > 0, reject −4 − √33)
exact not decimal
calculator cubic solving scores little
June 2022 · Paper 2 · Q14 marks
Mark scheme (whole question; this part is marked with the orange bar)
Examiner's comment
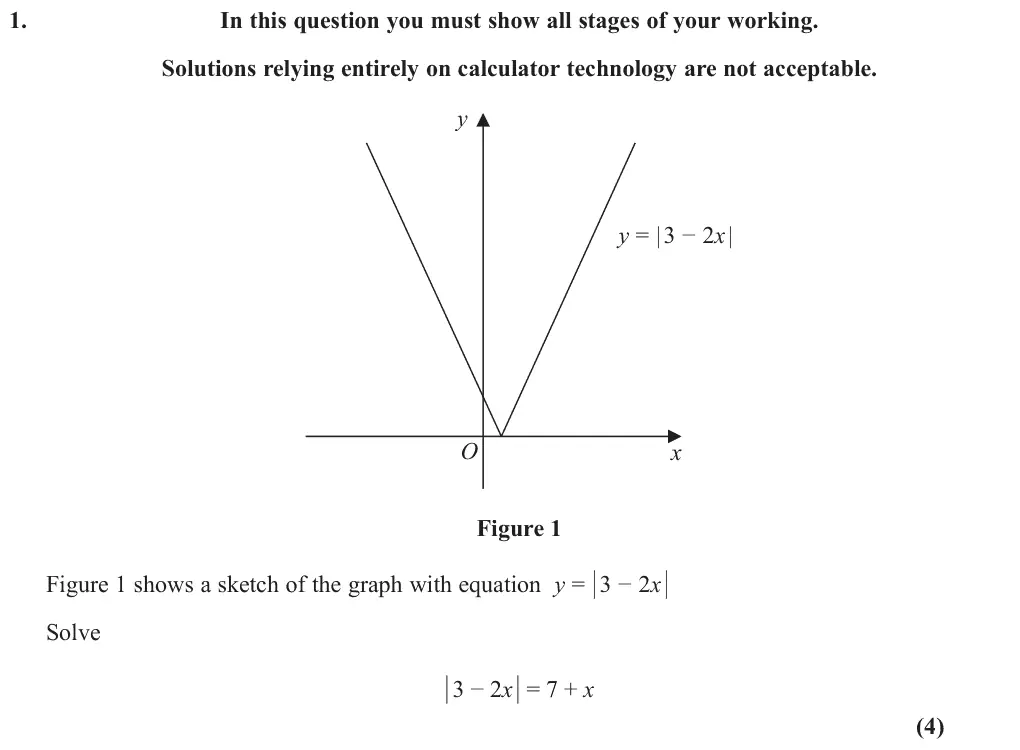
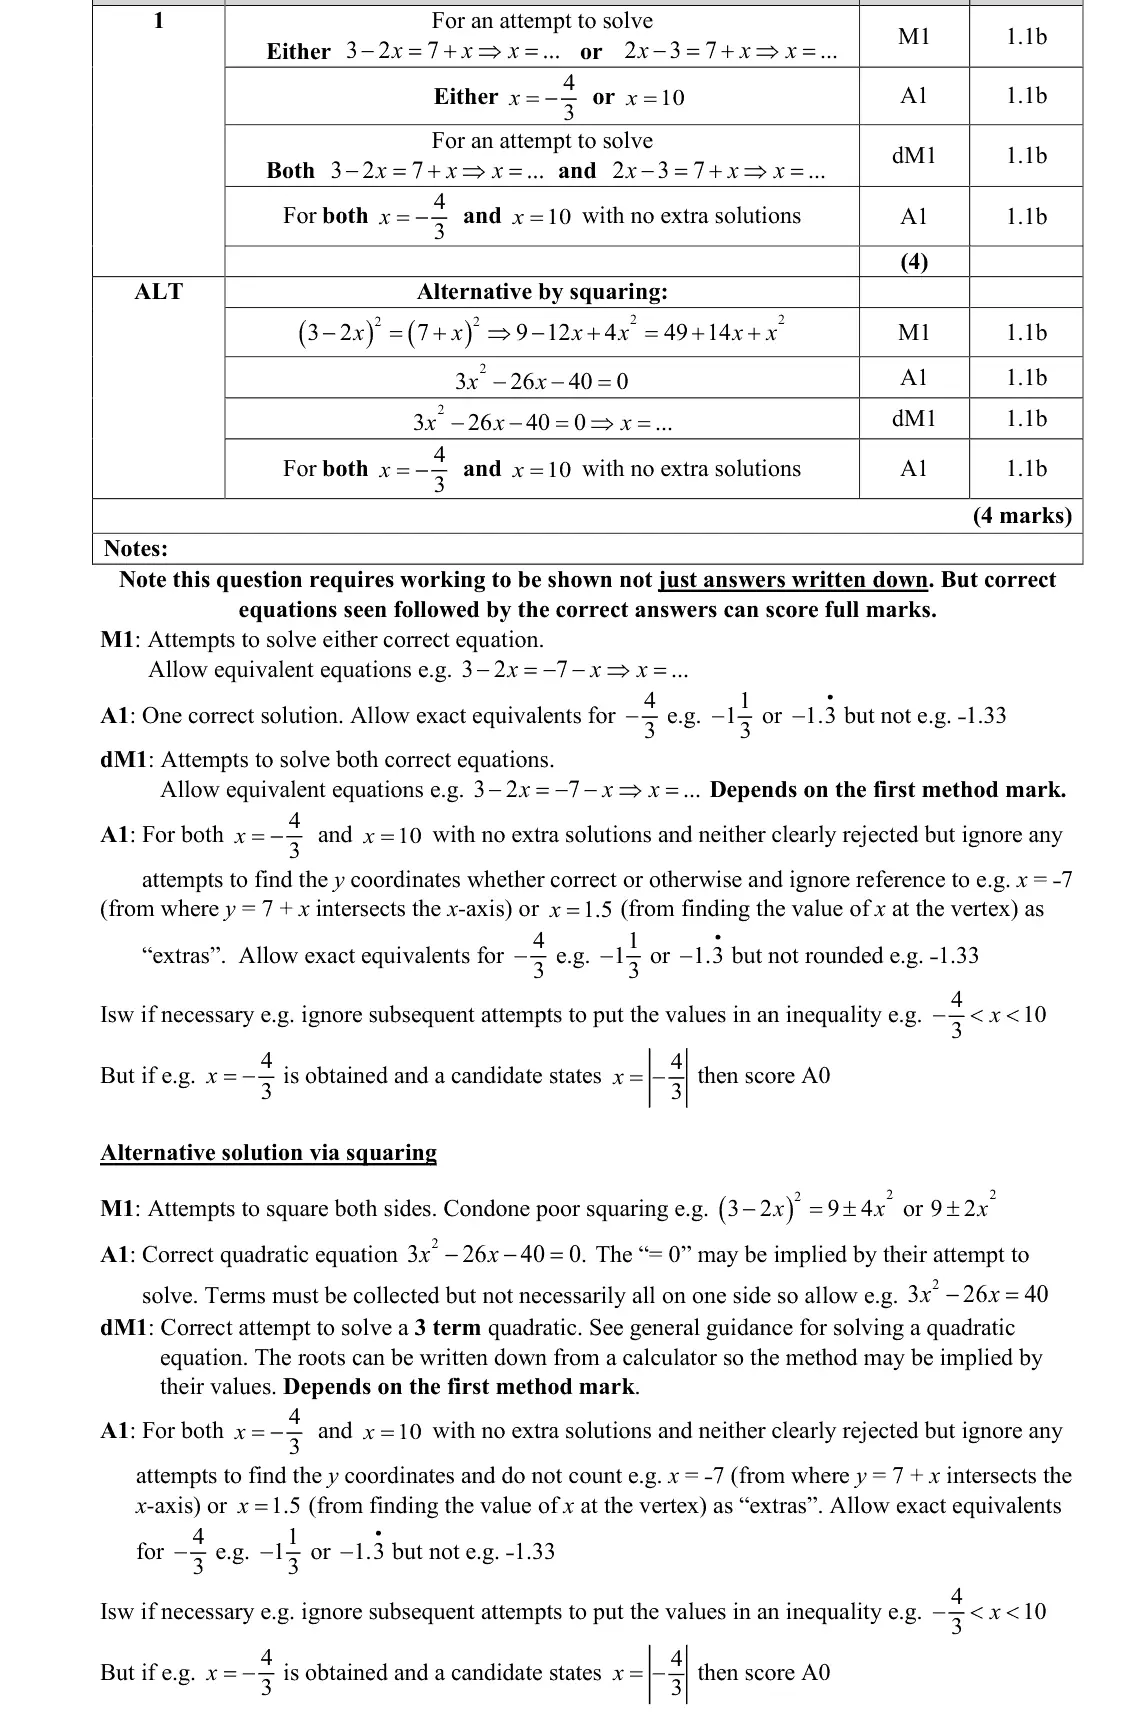
The first question on the paper provided a good start for many candidates who were able to score full marks. A fairly small minority solved by squaring both sides of the equation. This method was generally very accurate when used. Most candidates however, attempted the alternative strategy of setting up two separate equations. Of those who did not get full marks, most were able to identify that they should be solving 3 - 2𝑥𝑥 = 7 + 𝑥𝑥 but a common error was in the incorrect manipulation of the equation to get 𝑥𝑥 = -3/4. Others lost minus signs along the way or deliberately removed them, perhaps because this was a question involving modulus signs and they held the misconception that values should therefore be positive. Many candidates were also able to identify that a second solution came from 2𝑥𝑥 – 3 = 7 + 𝑥𝑥 but some incorrectly assumed no negatives were permitted and instead used 2𝑥𝑥+ 3 = 7 + 𝑥𝑥. As with the first solution, the most common error, once identifying the right equation, was due to incorrect rearrangement to give 𝑥𝑥 = 4. Some students however, only set up and solved one equation failing to recognise that two would be required. Although not required by the question, some candidates annotated their graphs; clearly constructing the line 𝑦𝑦 = 7 + 𝑥𝑥 to “show” the 2 solutions. Others unnecessarily calculated y coordinates, perhaps misunderstanding what was required by a ‘solution’. A small number of candidates obtained the correct answers, but then rejected 𝑥𝑥= -4/3. Other candidates incorrectly gave two positive solutions. Candidates should be advised to refer back to the graph provided in the question as a means of checking the validity of their solutions. In this case that one was clearly positive and one negative. A substantial minority of candidates demonstrated a lack of understanding of the modulus function and simply changed negative signs to positive signs or assumed that the modulus function is distributive i.e. |a + b| = |a| + |b|. A small number of candidates included inequalities in every step of their attempt and others maintained the presence of modulus signs throughout their entire attempt.
Common mistakes
solve 3 − 2x = 7 + x and 2x − 3 = 7 + x (or square both sides: 3x² − 26x − 40 = 0)
x = −4/3 and x = 10
common slips x = −3/4 and x = 4
do not reject the negative root or use 2x + 3
the graph shows one root is negative
−1.33 not accepted
Oct 2021 · Paper 1 · Q2(b)2 marks
Mark scheme (whole question; this part is marked with the orange bar)
Examiner's comment
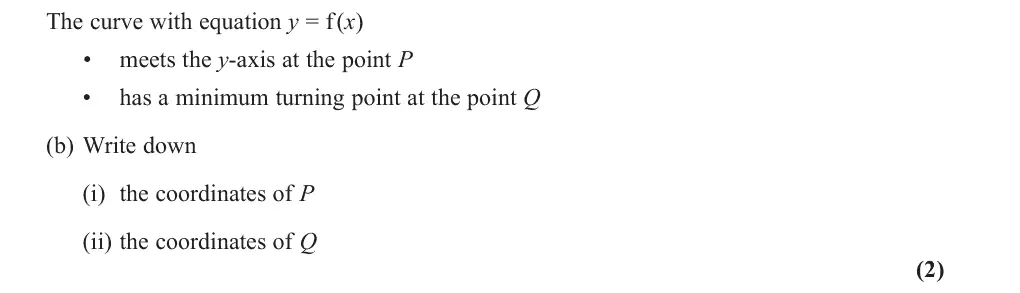
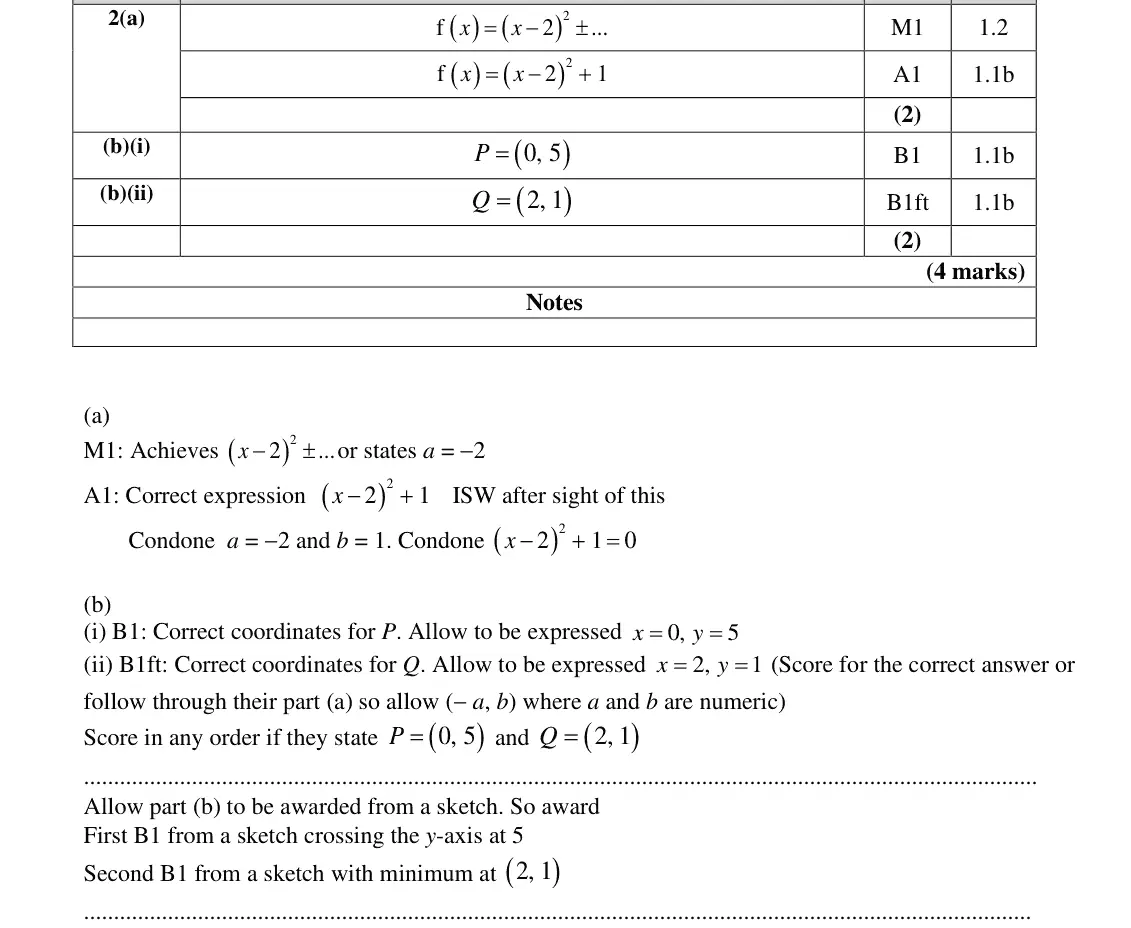
This focussed on the ability of a student to complete the square and proved to be as accessible as the first question. The vast majority of responses seen were fully correct. In response to part (b) both P and Q were often stated correctly with some candidates able to score the follow through mark for their Q from their value of ‘b’ from part (a). Occasionally a mark was lost if they had P =5 instead of y =5 when x=0. Very few sketches were seen, which if correctly labelled would have also scored full marks in (b). It was relatively common in (b)(ii) to see differentiation used, rather than the completed square expression.
Common mistakes
P = (0, 5), not P = 5
minimum Q = (2, 1) read from the completed square (−a, b), no need to differentiate
Oct 2021 · Paper 2 · Q7(b)1 mark
Mark scheme (whole question; this part is marked with the orange bar)
Examiner's comment
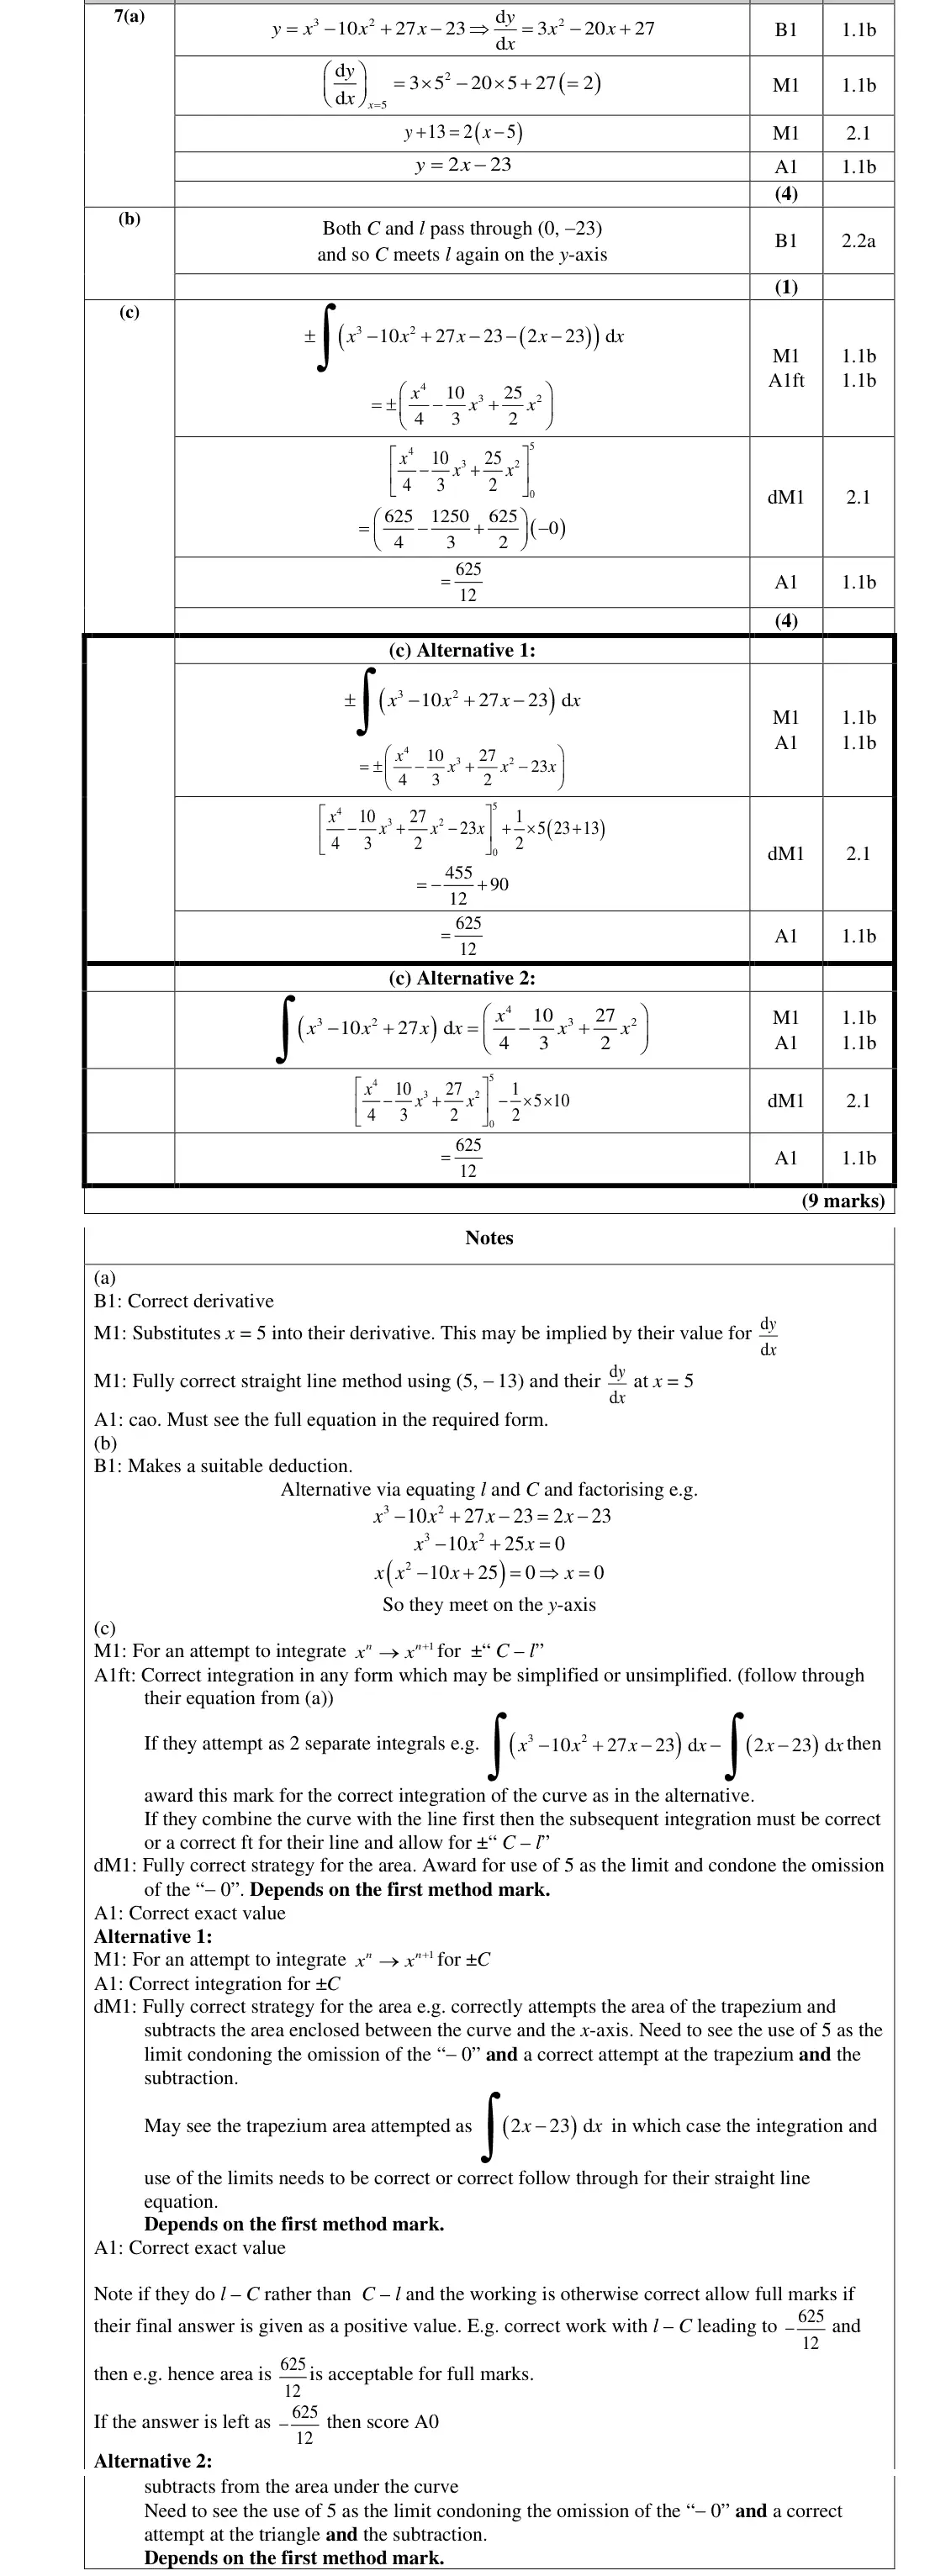
In part (b), most students understood the need to show that the y-intercepts were the same for both the line and the curve, but often candidates struggled to write an adequate conclusion to verify they meet again, and hence lost this mark.
Common mistakes
both C and l pass through (0, −23)
a concluding statement is required
Oct 2021 · Paper 2 · Q11(a)4 marks
Mark scheme (whole question; this part is marked with the orange bar)
Examiner's comment
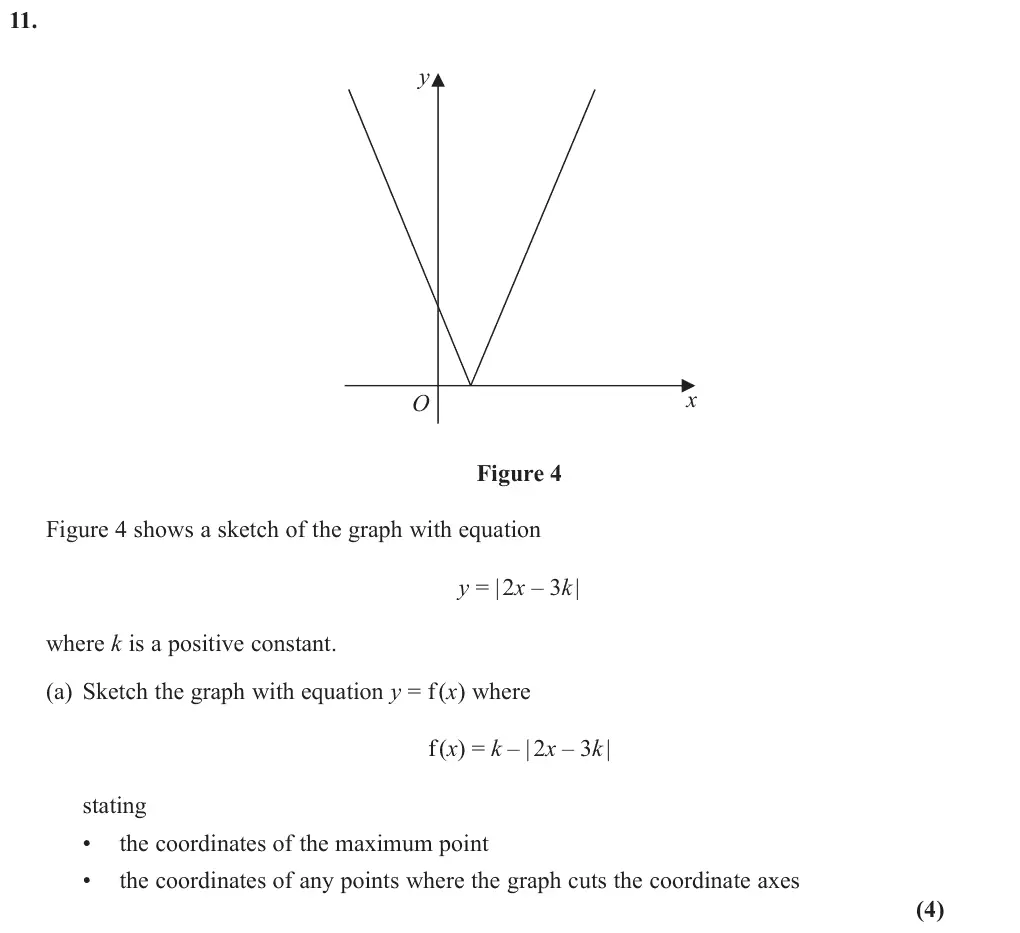
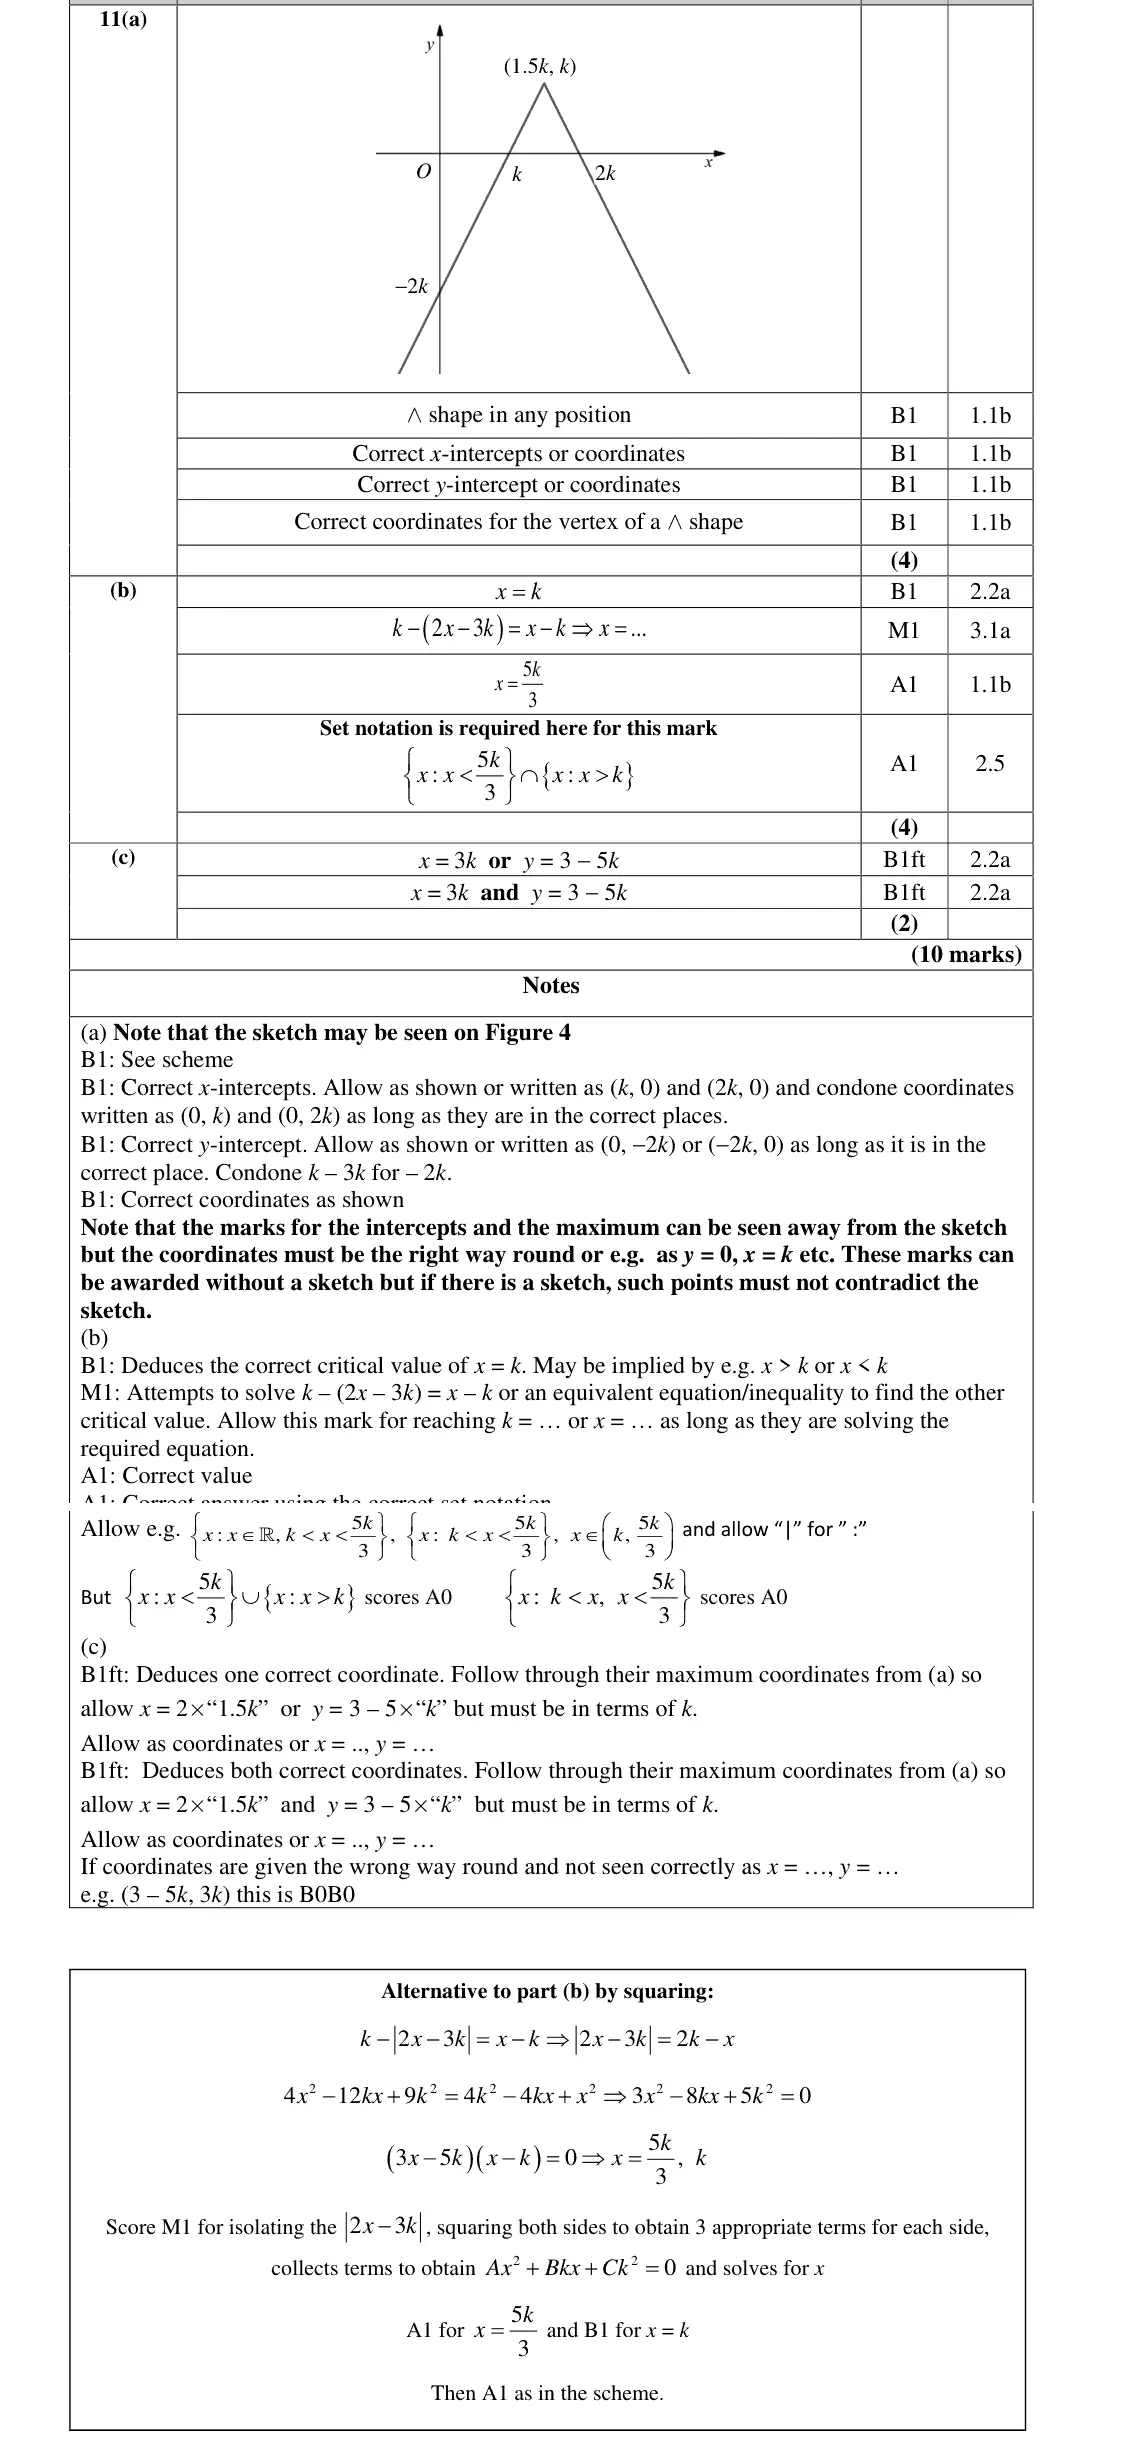
In general part (a) was poorly answered, with many candidates seemingly unfamiliar with sketching modulus functions. The majority of candidates scored at least one B mark for their upturned V but a V shape was occasionally seen, typically scoring no marks. Of those with the correct, many could not find the correct intersections and maximum point. Finding the correct y intercept seemed to be less challenging than finding the x intercept or the maximum point. Part (b) was better answered than part (a). Many candidates made correct attempts to find the second critical value of , gaining the M mark, but was often not found. The ‘squaring’ method was occasionally seen, but as this led to a 3TQ in x and k and which was hard to factorise this was rarely successful. The final A mark was often lost due to lack of correct set notation.
Common mistakes
inverted V (not V)
vertex (1.5k, k)
x-intercepts k and 2k
y-intercept −2k
Oct 2021 · Paper 2 · Q11(b)4 marks
Mark scheme (whole question; this part is marked with the orange bar)
Examiner's comment
Part (b) was better answered than part (a). Many candidates made correct attempts to find the second critical value of , gaining the M mark, but was often not found. The ‘squaring’ method was occasionally seen, but as this led to a 3TQ in x and k and which was hard to factorise this was rarely successful. The final A mark was often lost due to lack of correct set notation.
Common mistakes
critical values x = k and x = 5k/3 (solve k − (2x − 3k) = x − k)
answer {x : x < 5k/3} ∩ {x : x > k}, union scores A0
set notation required
squaring is rarely successful
Oct 2020 · AS Paper 1 · Q10(c)4 marks
Mark scheme (whole question; this part is marked with the orange bar)
Examiner's comment
This question was answered well by the majority of candidates. However, the question highlights the need for detail in proof and ‘show that’ questions which candidates are clearly still getting used to; it appeared to be even the more able candidates were neglecting to state facts that were needed. Candidates should be encouraged to make sure they provide sufficient reasoning when demonstrating a result or writing a proof. The final part requiring integration, whilst not penalised, brought out a lot of poor notation. Candidates were able to score most marks, however. Those who understood the nature of the curve and the importance of the factors and roots found earlier were able to choose the correct bounds and, usually, go on to achieve full marks. In part (c), those who attempted the question typically integrated correctly; however, it was very mixed when it came to evaluating. There were a number of poor graph sketches and some did not recognise which area they were actually finding and chose the wrong bounds for the integral. When evaluating the integral there were solutions lacking brackets which resulted in sign errors. Although the integral evaluates to be negative, the area is the magnitude of this. If the bounds were used in ascending order, then it was expected to see the negative answer before the positive solution. It was acceptable, following candidates carrying out algebraic integration visibly, that they used their calculator to substitute in their limits and could still score full marks. 10
Common mistakes
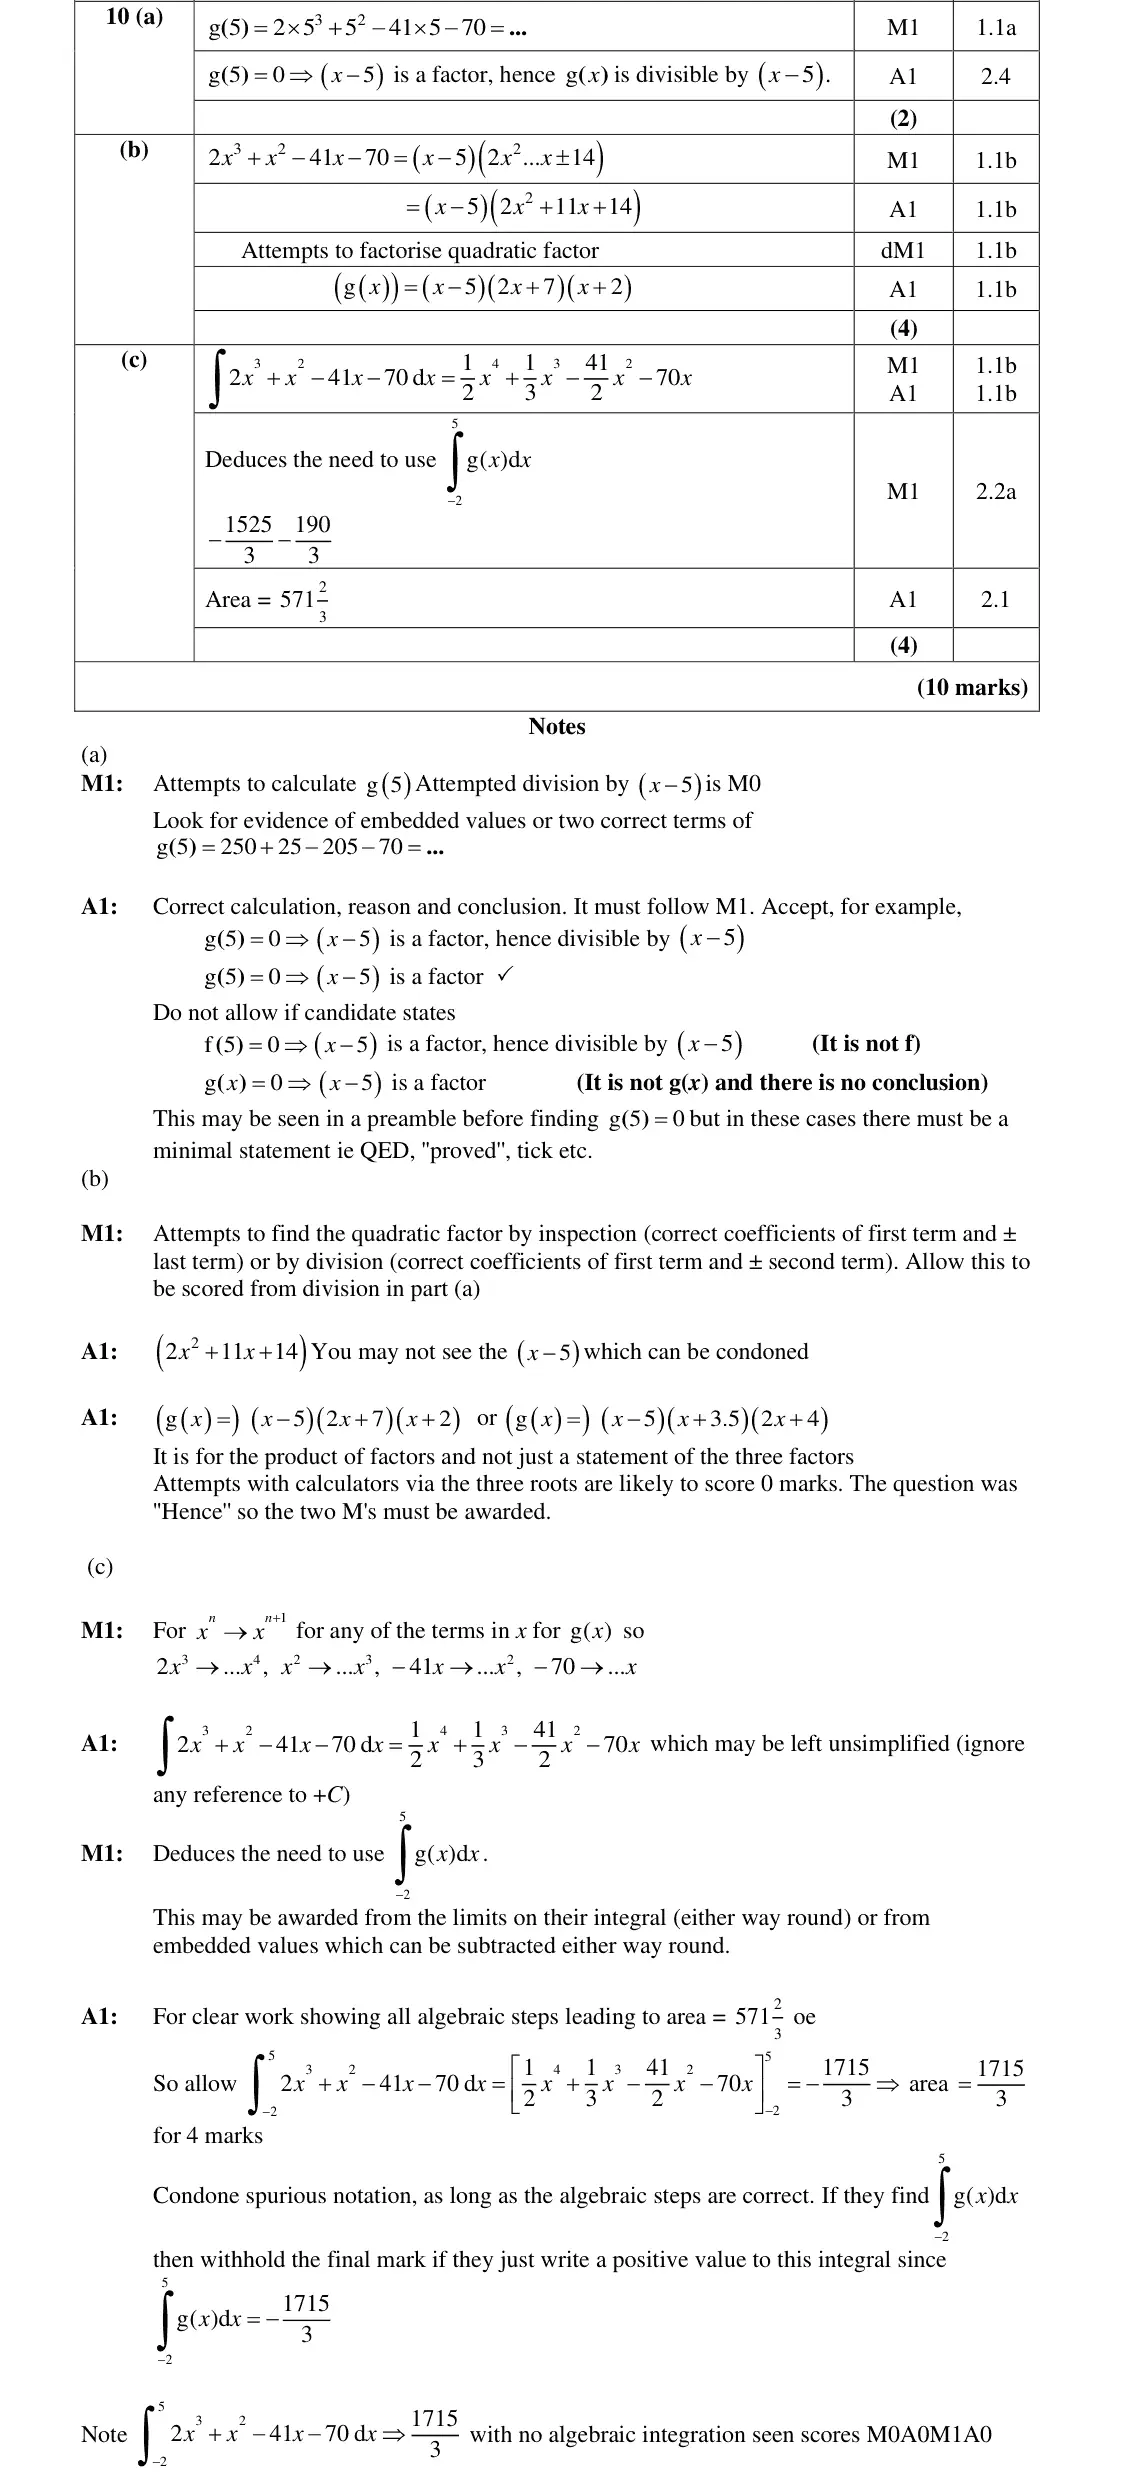
limits −2 and 5 from the factors (region below the axis)
brackets when substituting
integral is −1715/3 so area is 571⅔ (do not just write the positive value)
Oct 2020 · Paper 2 · Q11(a)2 marks
Mark scheme (whole question; this part is marked with the orange bar)
Examiner's comment
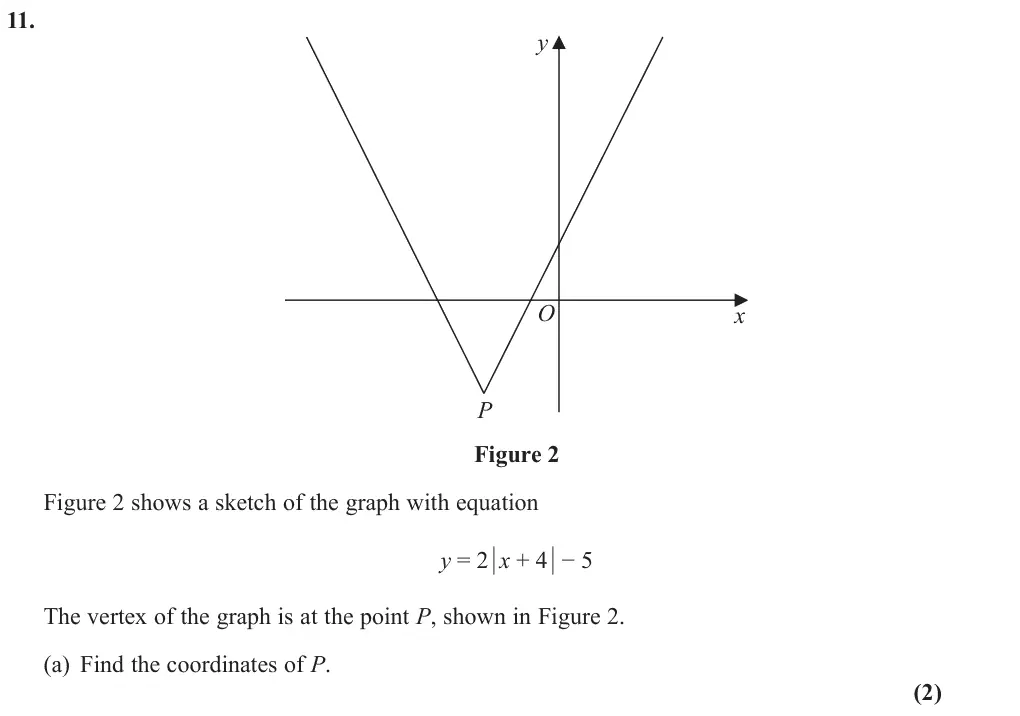
Part (a) of this question was generally well answered, with most candidates being able locate P correctly. A few candidates launched into some lengthy algebra, in some cases resulting in values for x and y bearing no relation to the position of P on the diagram. Answers to part (b) from this cohort of candidates were very disappointing and displayed an
Common mistakes
vertex P(−4, −5) read from the transformation
lengthy algebra not needed
Oct 2020 · Paper 2 · Q11(b)2 marks
Mark scheme (whole question; this part is marked with the orange bar)
Examiner's comment
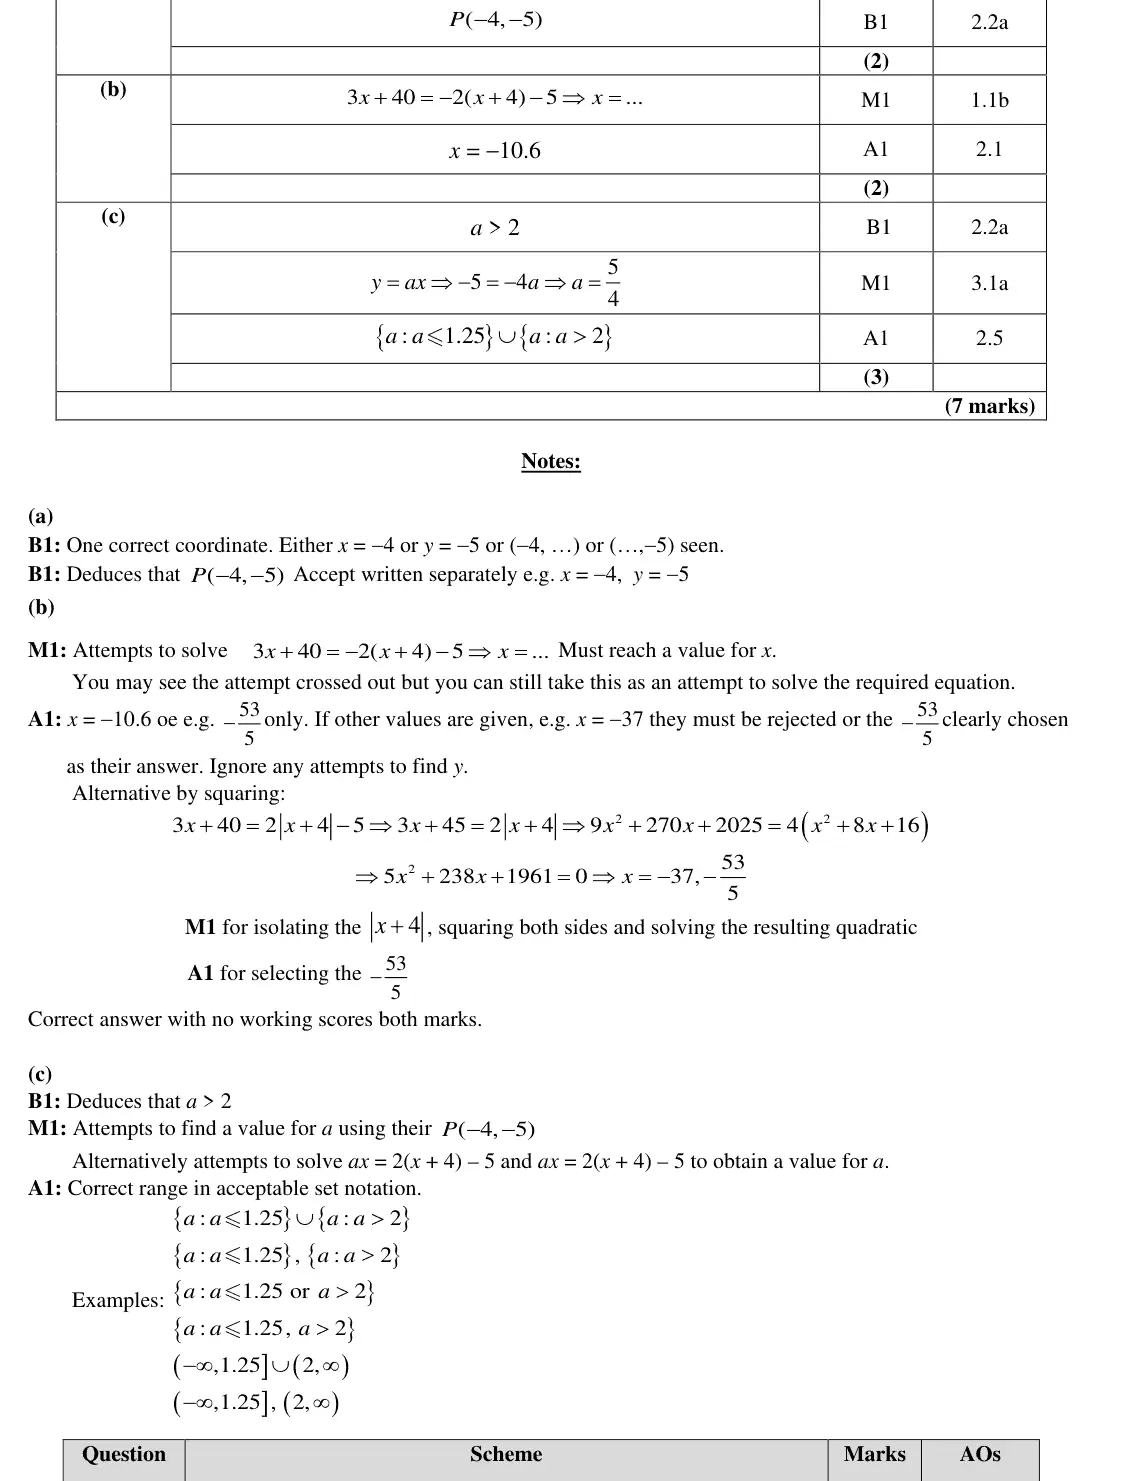
Answers to part (b) from this cohort of candidates were very disappointing and displayed an overreliance on algebra and poor understand of modulus graphs. Very few candidates identified x = -10.6 as the solution to the equation. Instead most answers wrote down the solution to 3x+40 = 2(x+4) – 5 {x =-37} as well as x = -10.6, scoring M1A0. A few candidates used a calculator to directly write down the correct value of x to gain both marks – perhaps not a bad strategy for students who are weak at modulus graphs. A simple check on a calculator would also have established that only x = -10.6 was a solution to the printed equation. Part [c] of this question was one of the most challenging parts of this paper, with hardly any candidates gaining all 3 marks. Candidates seemed unable to ‘visualise’ the question and see directly that there would be an intersection if a was greater than 2, so the B mark was hardly ever gained (and consequently the A mark was immediately lost). The M mark for considering P and attempting a = 5/4 was occasionally gained, although as above this often entailed long winded algebraic methods e.g. solving simultaneous equations to find a.
Common mistakes
the line meets the left branch only: solve 3x + 40 = −2(x + 4) − 5 to get x = −10.6
reject x = −37 from the other branch
Oct 2020 · Paper 2 · Q11(c)3 marks
Mark scheme (whole question; this part is marked with the orange bar)
Examiner's comment
Part (a) of this question was generally well answered, with most candidates being able locate P correctly. A few candidates launched into some lengthy algebra, in some cases resulting in values for x and y bearing no relation to the position of P on the diagram. Answers to part (b) from this cohort of candidates were very disappointing and displayed an overreliance on algebra and poor understand of modulus graphs. Very few candidates identified x = -10.6 as the solution to the equation. Instead most answers wrote down the solution to 3x+40 = 2(x+4) – 5 {x =-37} as well as x = -10.6, scoring M1A0. A few candidates used a calculator to directly write down the correct value of x to gain both marks – perhaps not a bad strategy for students who are weak at modulus graphs. A simple check on a calculator would also have established that only x = -10.6 was a solution to the printed equation. Part [c] of this question was one of the most challenging parts of this paper, with hardly any candidates gaining all 3 marks. Candidates seemed unable to ‘visualise’ the question and see directly that there would be an intersection if a was greater than 2, so the B mark was hardly ever gained (and consequently the A mark was immediately lost). The M mark for considering P and attempting a = 5/4 was occasionally gained, although as above this often entailed long winded algebraic methods e.g. solving simultaneous equations to find a.
Common mistakes
a > 2 (steeper than the right branch)
line through P gives a = 5/4, so a ≤ 1.25
set notation {a : a ≤ 1.25} ∪ {a : a > 2}
June 2019 · AS Paper 1 · Q7(a)3 marksMedium
Mark scheme (whole question; this part is marked with the orange bar)
Examiner's comment
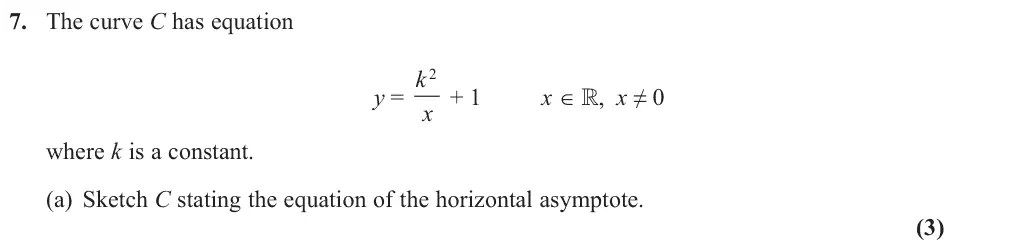
In general, parts (a) and (b) were well done with part (c) causing some issues. (a) There were many well drawn sketches with the correct equation of the asymptote either stated on the graph or below it. A common mistake was for the lower branch not to cross the x-axis, thus demonstrating a lack of understanding of the relevance of the asymptote (in effect y = 0 became another asymptote). One observation from part (a) is that many candidates ignored the blank section of the paper and attempted to draw their graph on the line page. Whilst this is not an issue, too many candidates failed to use a ruler and had dubiously shaped curves, often curving away from the asymptotes for larger values of x and y.
Common mistakes
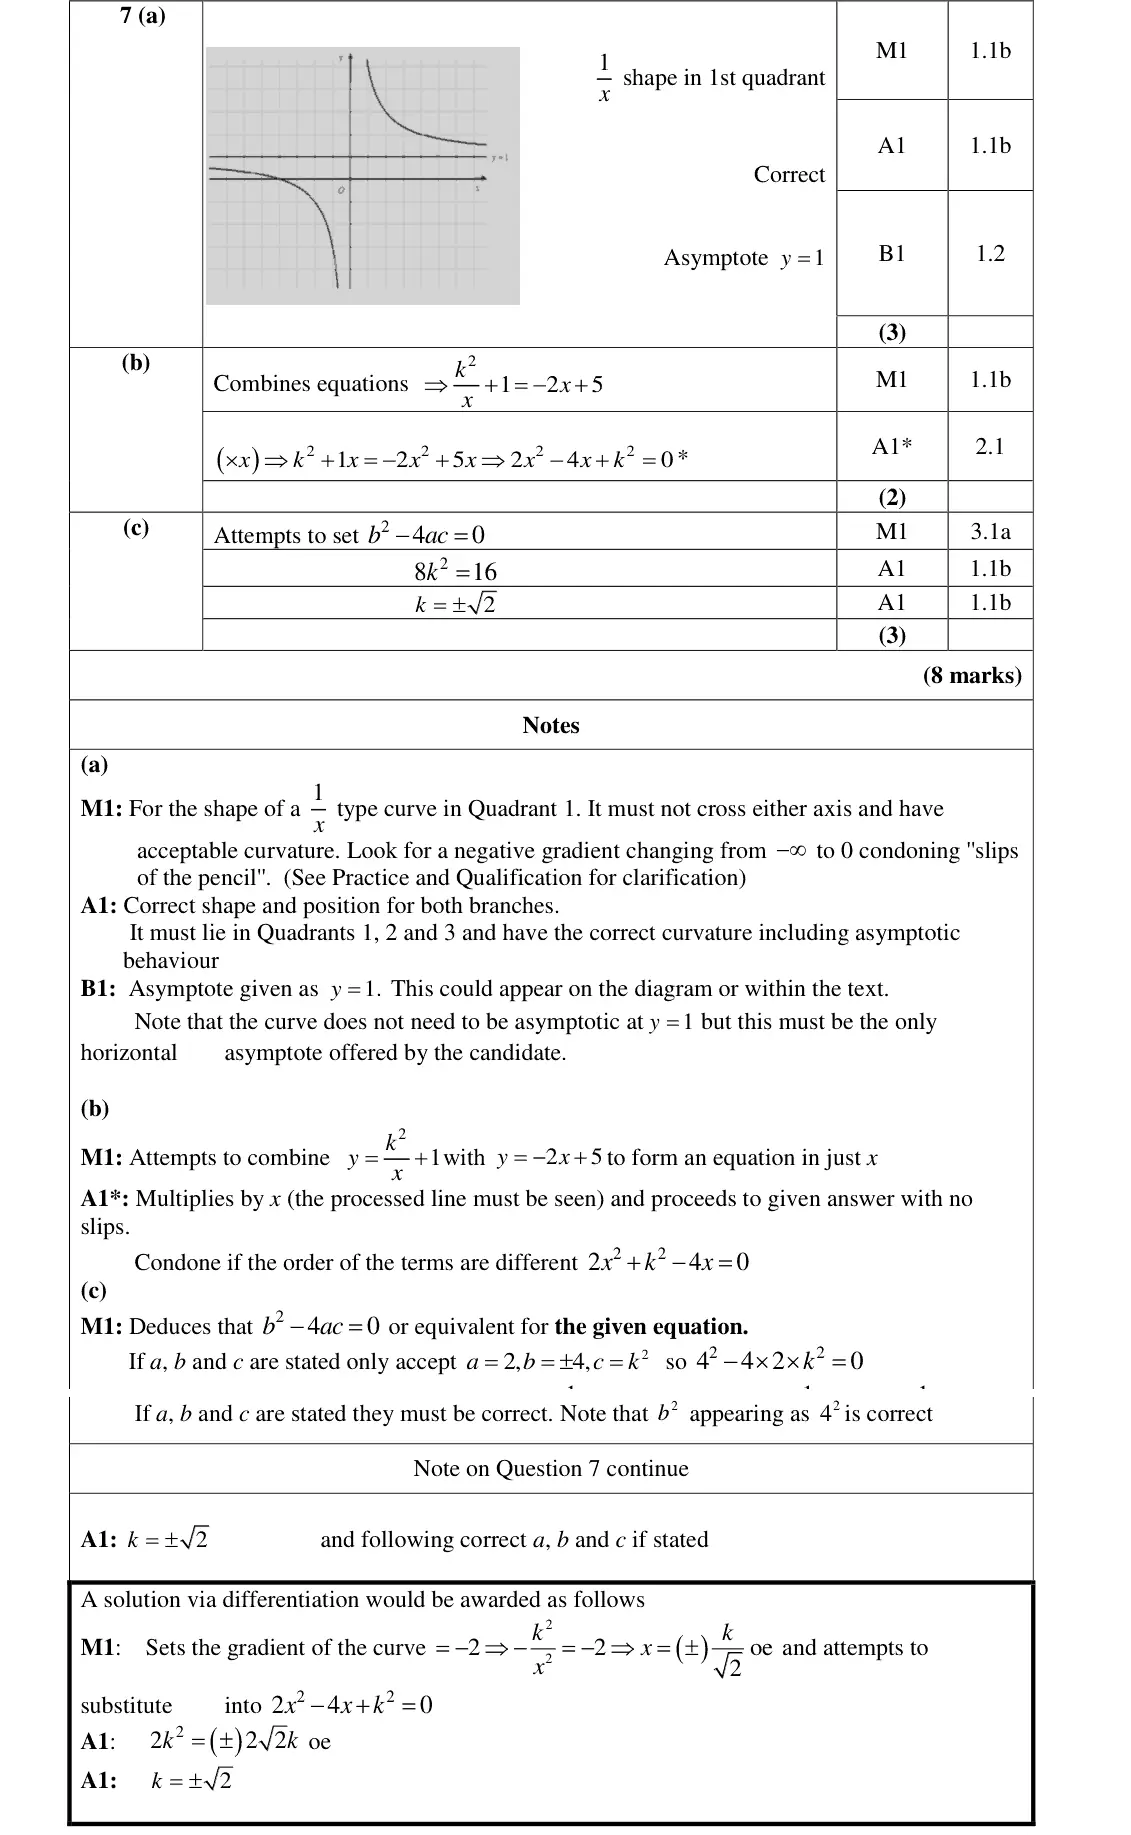
1/x shape in the 1st and 3rd quadrants shifted up 1
lower branch must cross the x-axis
asymptote y = 1 stated
curves must not bend away from the asymptotes
June 2019 · AS Paper 1 · Q11(c)2 marksMedium
Mark scheme (whole question; this part is marked with the orange bar)
Examiner's comment
As a general point, it is worth noting that a good examination technique is to look at the mark marks, yet produced half a page of work in (c) or (d) which had an allocation of just 2 marks. The number of marks allocated to any part of a question is a good hint to the depth and detail of work required. (c) Those who noticed that the value of the constant had changed from 48 to 46 recognised that the new equation had three roots. Only a few went on to explain that f(x) had been transformed by the vector or even just 2 places downwards cutting the x-axis in three places. A large number of candidates did not spot the difference between the equation in (c) and f(x) = 0 and many of those merely explained what they had done in (b). given. Infact quite a few candidates, who had scored only a few marks in parts (a) (b) and (c) combined, achieved both marks here.
Common mistakes
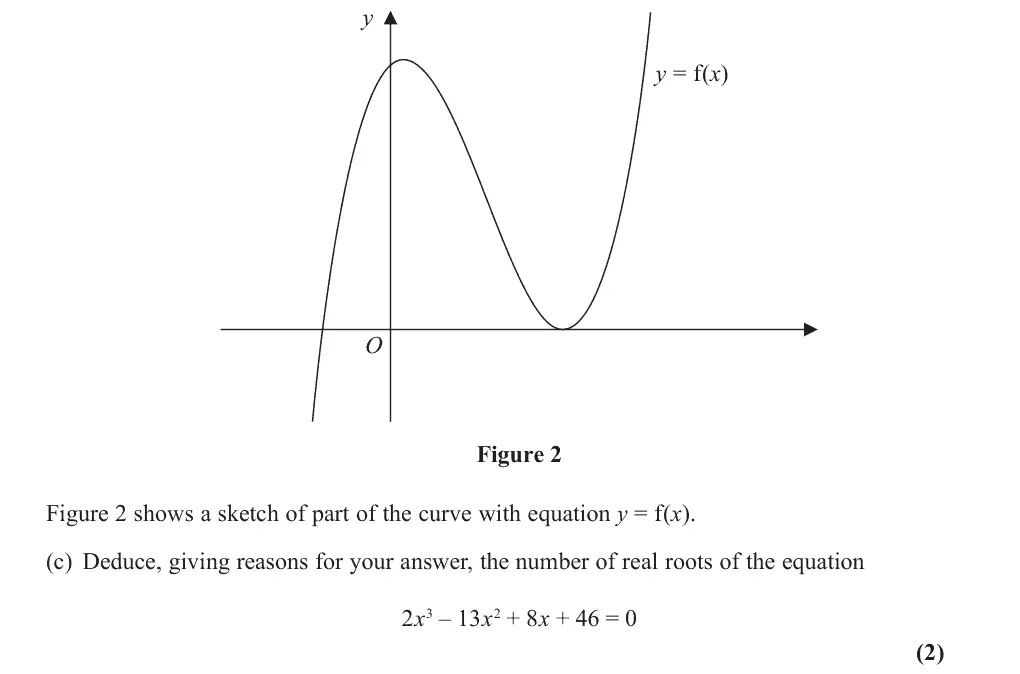
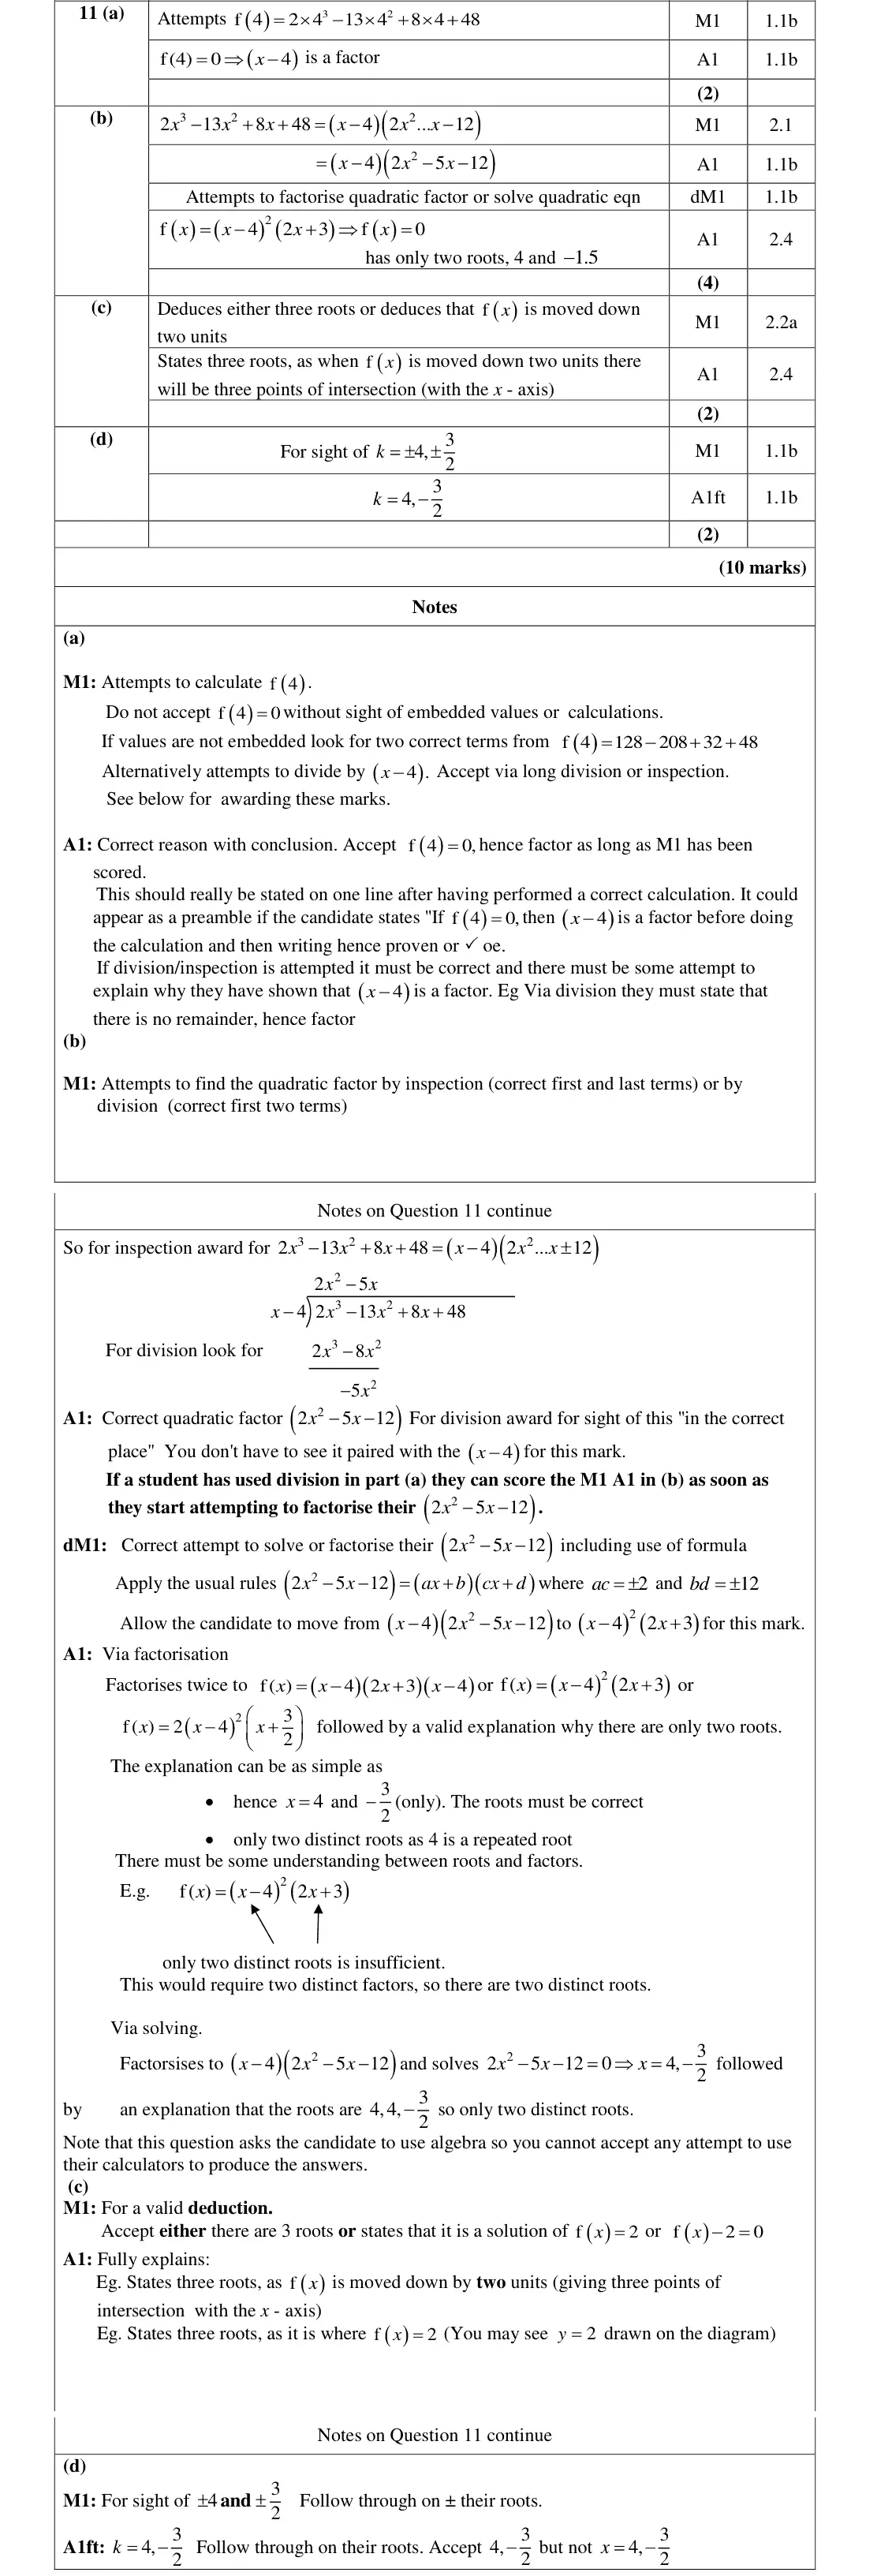
the constant changed from 48 to 46: f(x) − 2 = 0 is y = f(x) moved down 2 units (or f(x) = 2), so 3 points of intersection and 3 roots
June 2019 · Paper 1 · Q2(a)2 marksMedium
Mark scheme (whole question; this part is marked with the orange bar)
Examiner's comment
This question proved to be more challenging for a number of candidates although many were still able to score full marks. In part (a) it was important for candidates to pay attention to the scale of the graph. Most candidates who did draw a straight-line graph were able to make the link between one point of intersection and one real root to the equation, however, a significant minority of these were unable to construct the correct straight-line graph with enough accuracy to gain both marks for this part of the question.
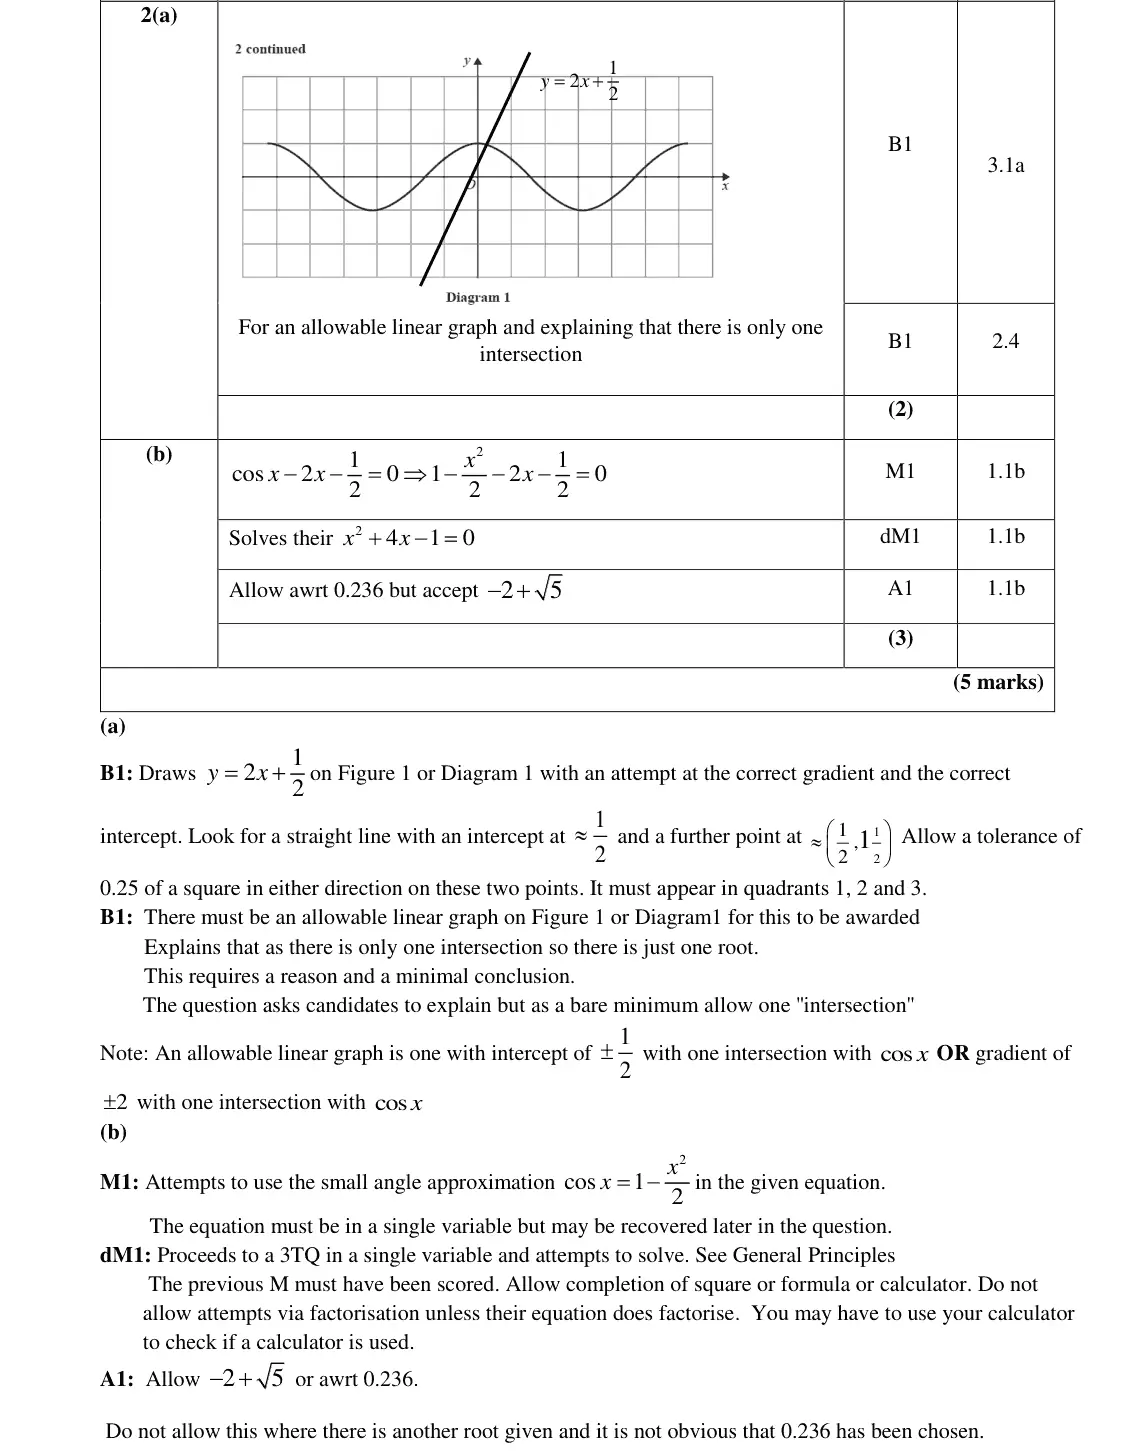
Common mistakes
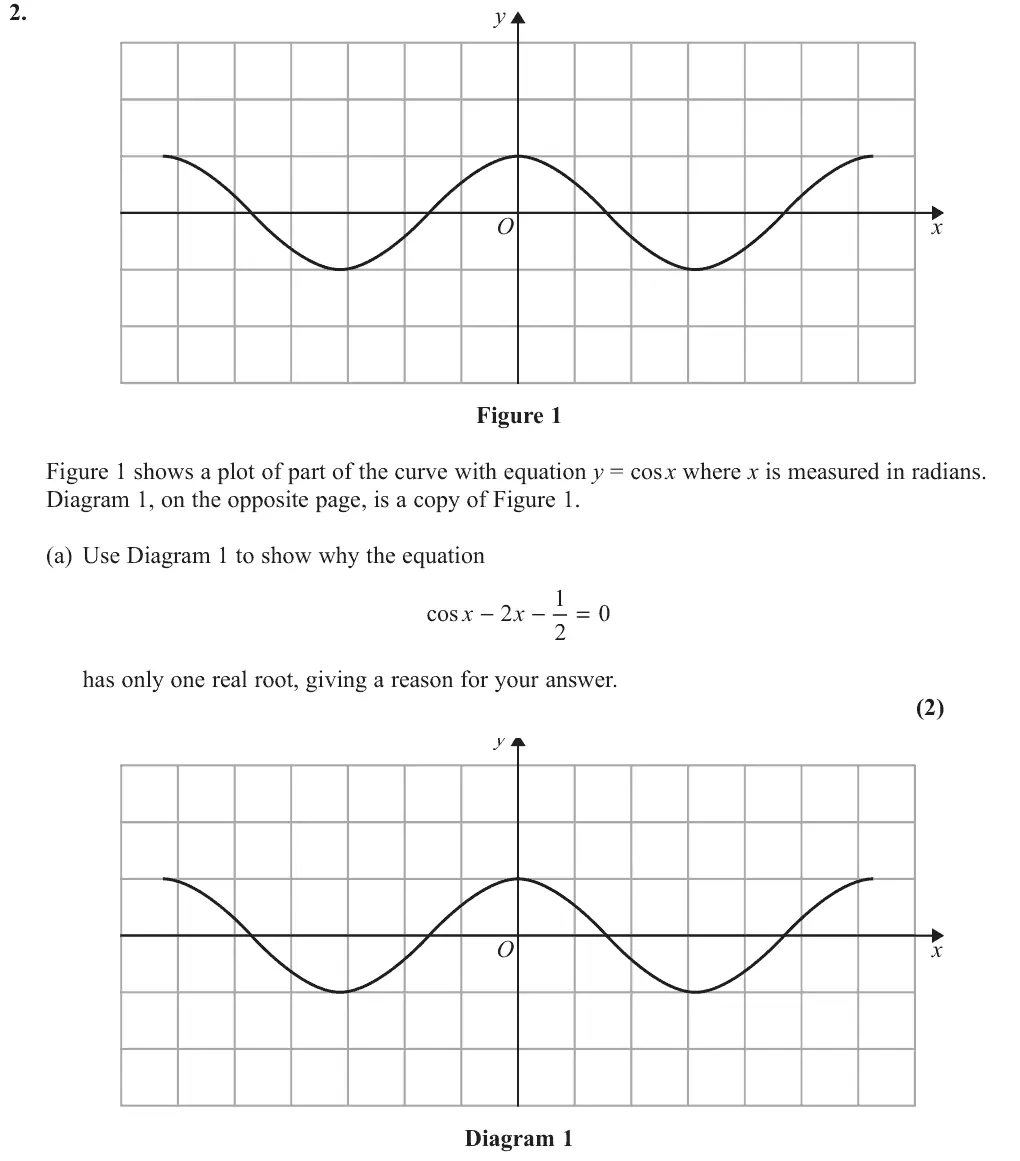
rearrange to cos x = 2x + ½ and draw that line (intercept ½, gradient 2: watch the scale)
one intersection so one root, a reason is needed
June 2019 · Paper 1 · Q5(b)3 marksEasy
Mark scheme (whole question; this part is marked with the orange bar)
Examiner's comment
This question on completing the square and the quadratic function was accessible to all, especially the first 6 Part (b) was equally straightforward, even for candidates who did not achieve the correct result in part (a). 2 ( ) a x b c Many used the form or their graphical calculators to produce accurate and well drawn curves. Marks were lost here when candidates drew V shaped curves or had incorrectly placed turning points. As stated earlier, part (c) was a lot more demanding. Rather strangely part (i) was found more accessible than
Common mistakes
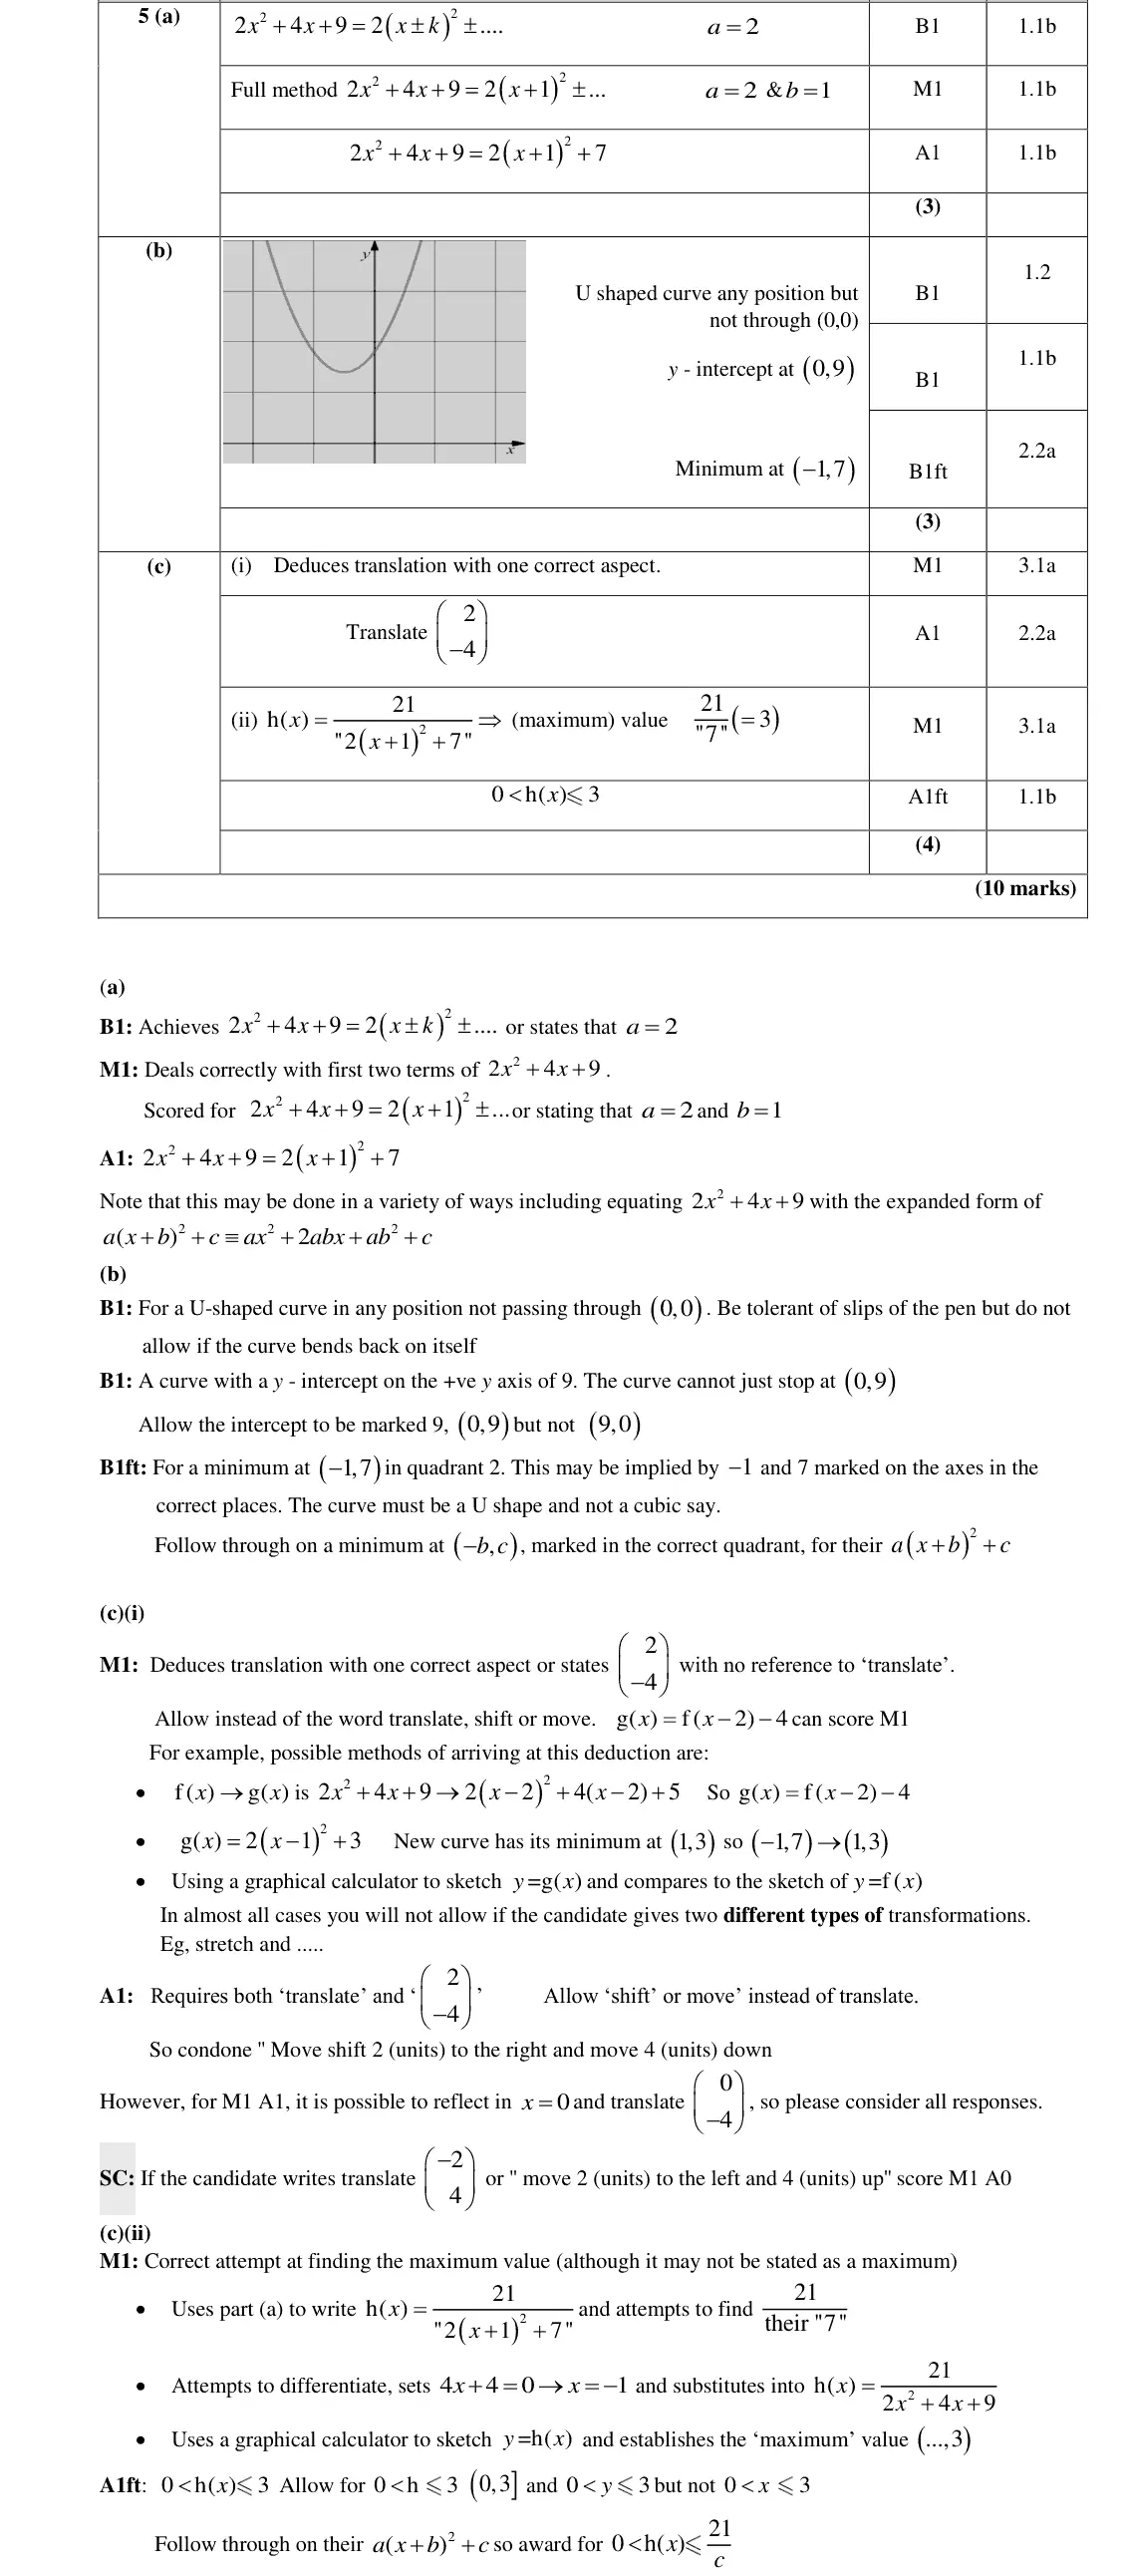
U shape not V
y-intercept (0, 9)
minimum (−1, 7) in the second quadrant
June 2019 · Paper 1 · Q10(ii)2 marksHard
Mark scheme (whole question; this part is marked with the orange bar)
Examiner's comment
The idea of proof is another new one in this updated specification. It was not well known and a disproportionate number of blank or barely started solutions indicated a lack of expertise in this topic. Candidates who scored full marks for part (i) most often did so via algebraic proof, letting n=2m (for even numbers) and then n=2m+1 (for odd numbers), although several candidates missed out on the final accuracy mark as they failed to insert a conclusion for all n. Weaker candidates tried to use m + 1 instead of 2m + 1 to represent odd numbers. Also many candidates only considered either odd or even numbers, but not both. Candidates who set out to use proof via contradiction tended to score few marks as they did not show an understanding of how to use that method of proof. Proofs via logic were rare and tended to appear as part of a mix of different methods where the candidates seemed to be unclear of the best way to proceed. Some candidates seemed to think that using random numbers to show that the expression is not divisible by 4 amounted to proof (receiving 0 marks). Students need more practice on this style of proof. In part (ii) more candidates approached the problem algebraically than graphically. They were generally able to set up the two equations / inequalities required, but errors often occurred in their use of algebra when attempting to solve them. Some candidates only set up one of the two required inequalities. Many students attempted the question by just substituting numbers in to the expression, with most of these deducing that the statement was always true. Where candidates drew a graph, they often did not describe why their graph indicated that the statement is sometimes true. Many graphs showed a line and a V shape but some were incorrect in the relative positioning of these shapes.
Common mistakes
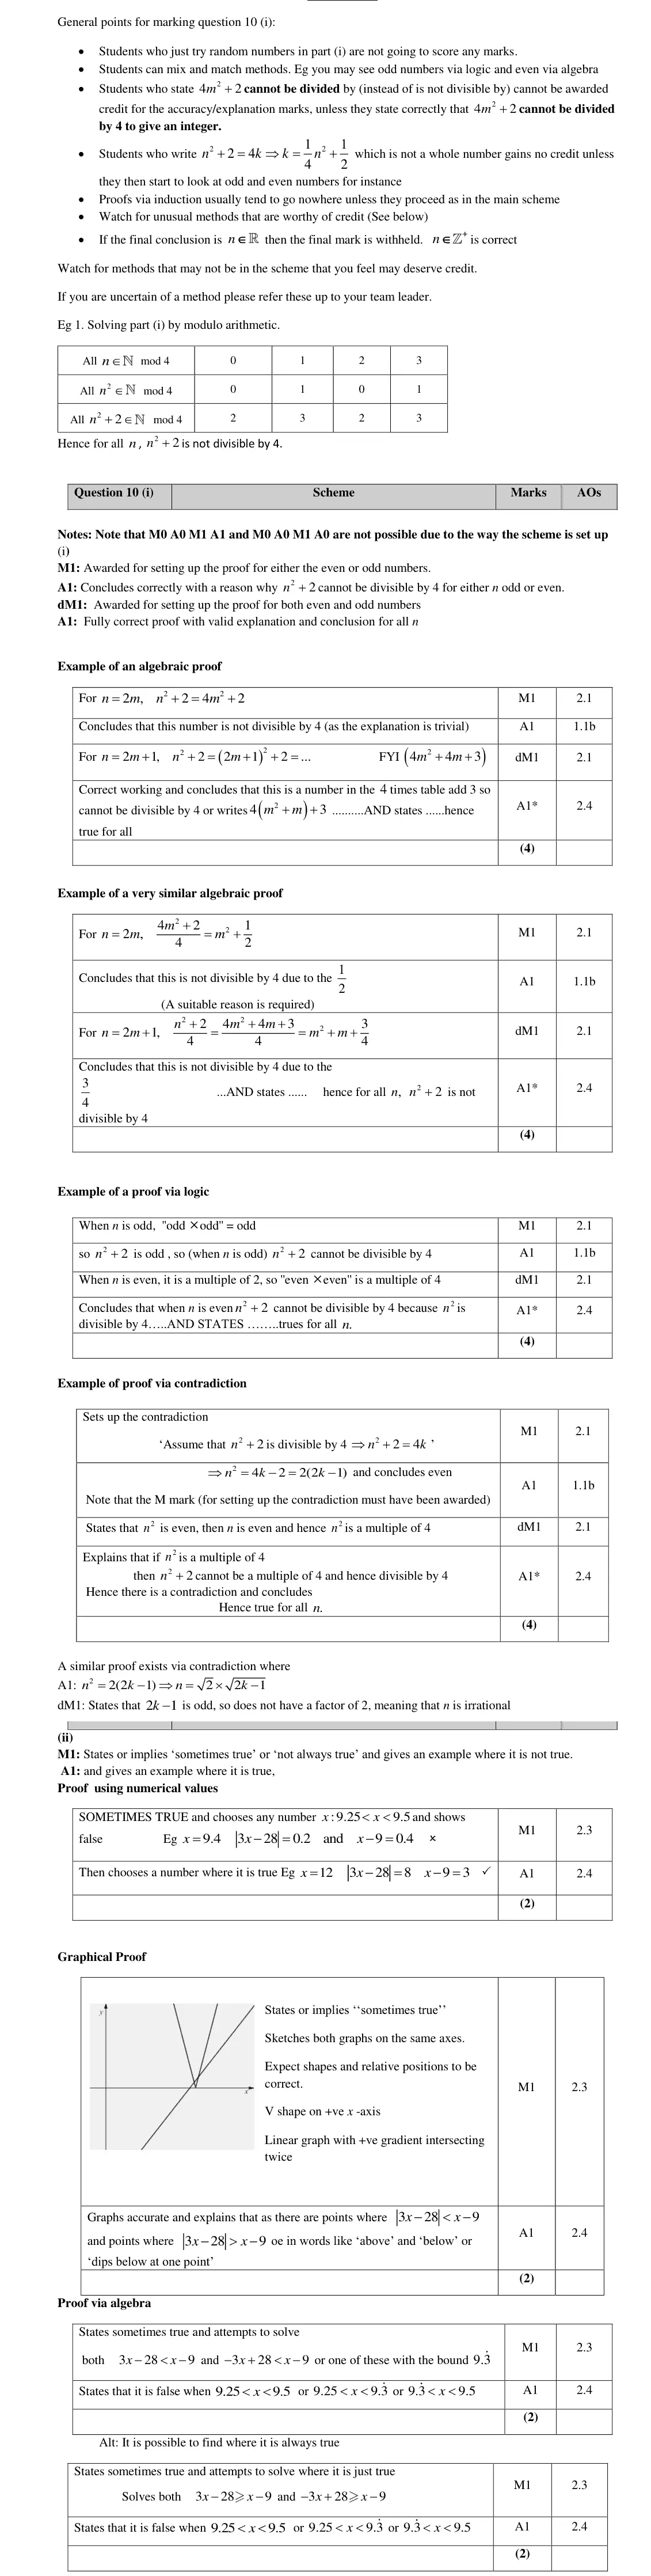
sometimes true: false for 9.25 < x < 9.5, true e.g. x = 12
give one example of each
substituting a few numbers led many to "always true"
graph needs V shape and line crossing twice
June 2019 · Paper 1 · Q13(a)3 marksMedium
Mark scheme (whole question; this part is marked with the orange bar)
Examiner's comment
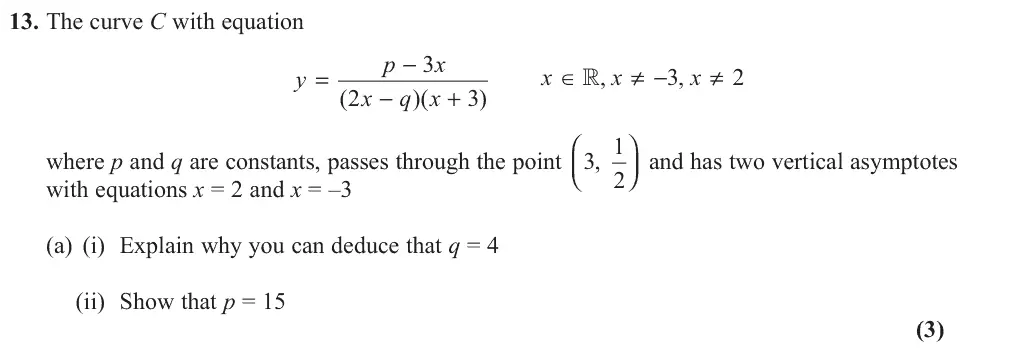
Only the strongest candidates scored all 11 marks here, with the majority losing at least 1 mark, usually the first mark in (a) or the last mark in (b). In part (a) (i) many candidates realised that x = 2 was linked to establishing that q = 4 but they found difficulty explaining this by referencing the asymptote, or the denominator being zero. Almost all candidates provided good explanations in (a)(ii) even when they had provided inadequate explanations on part (i)
Common mistakes
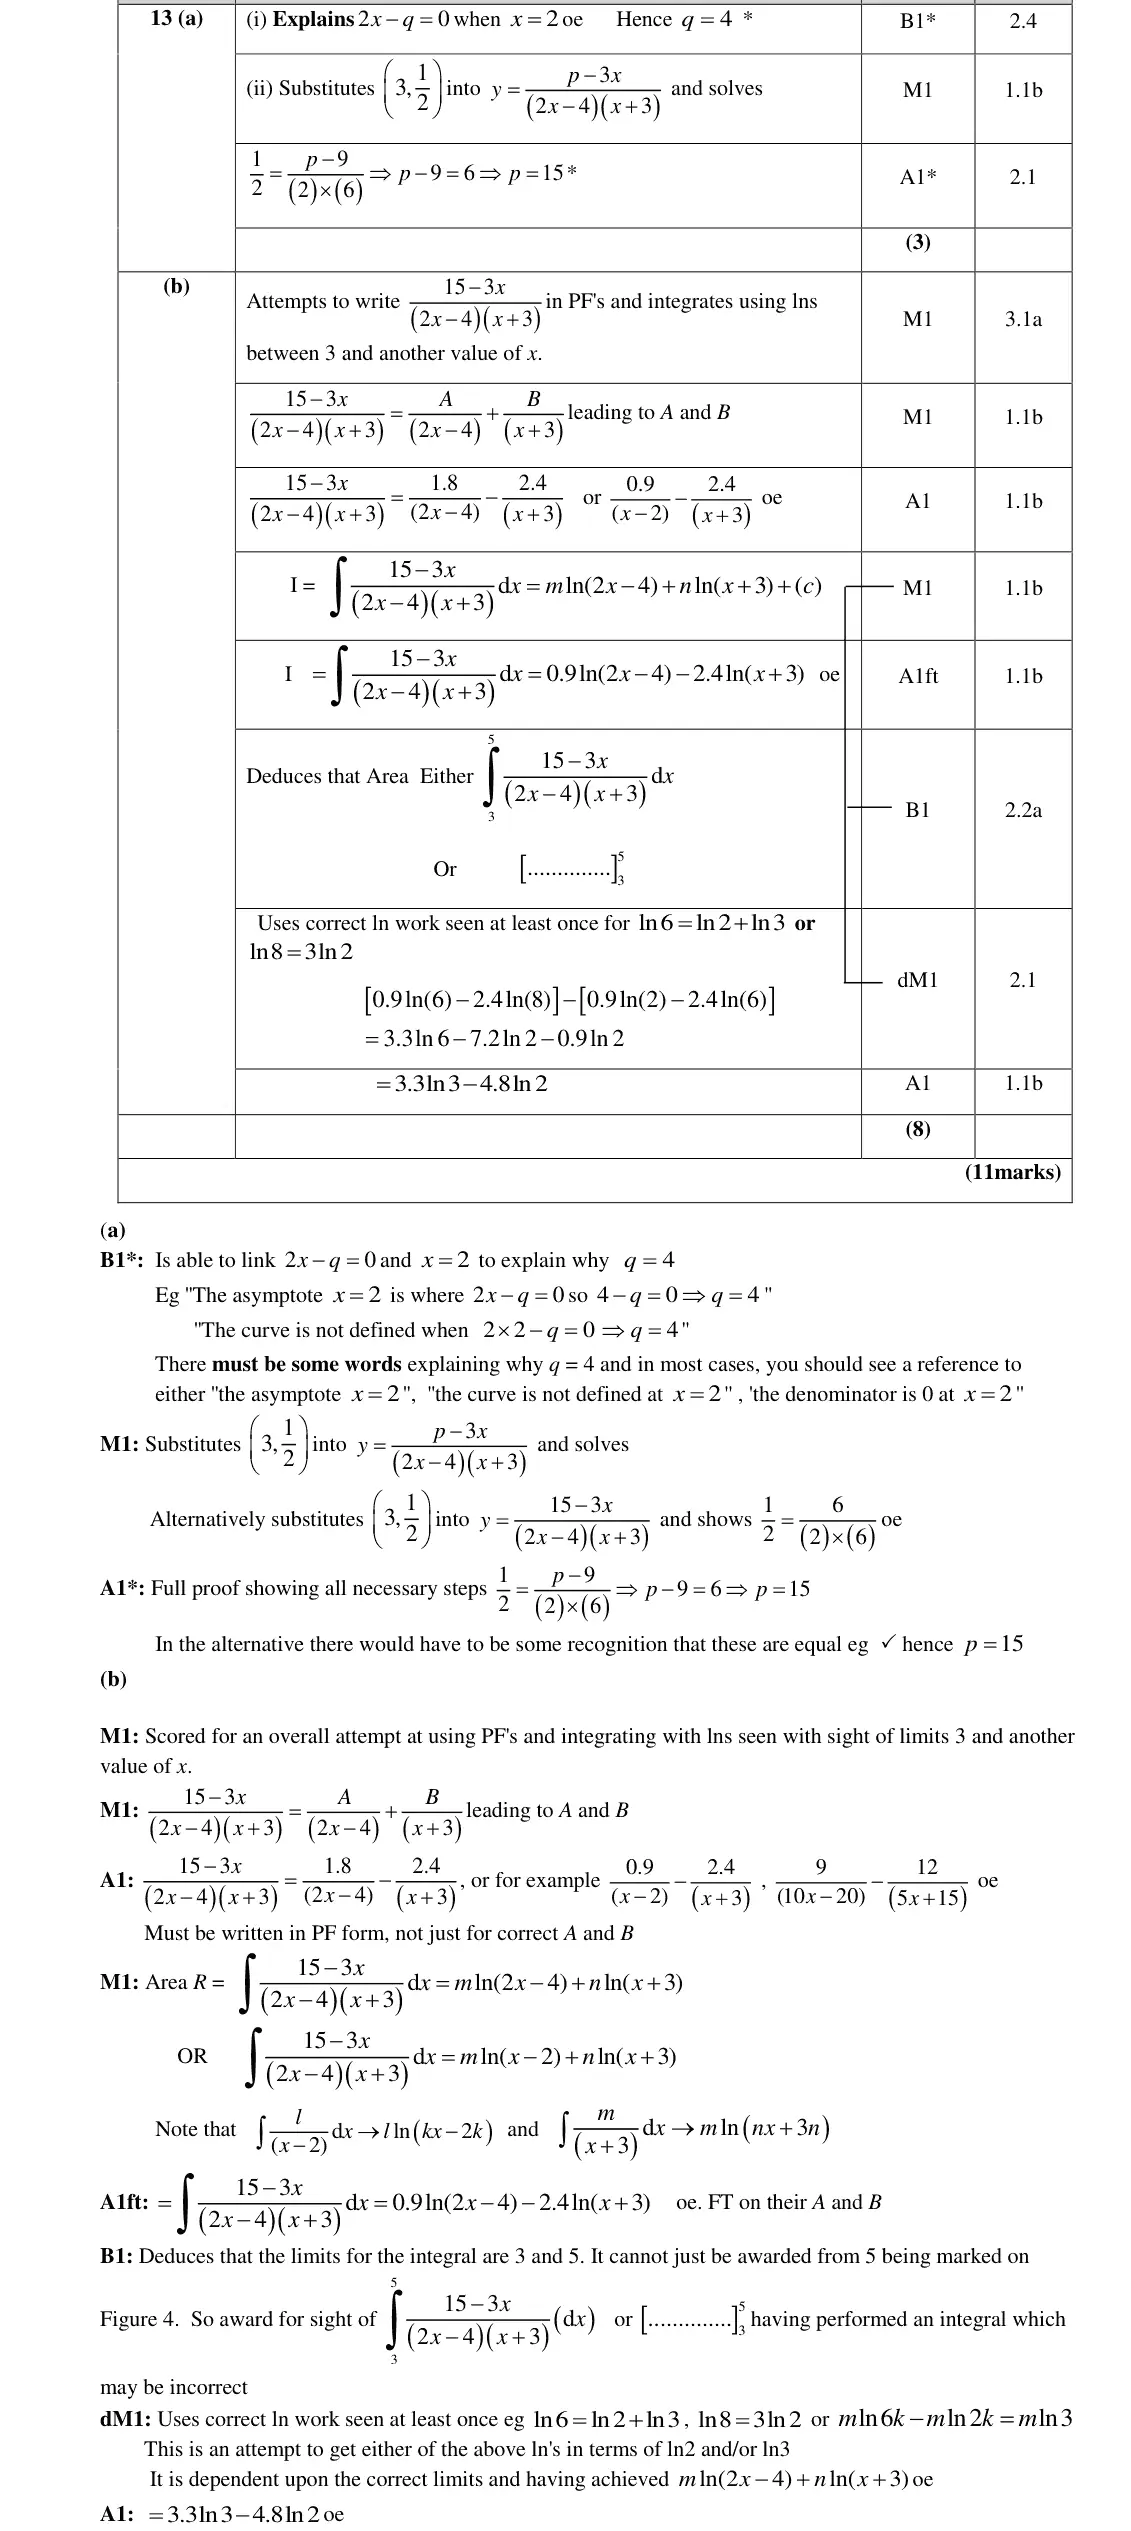
(i) vertical asymptote where the denominator is zero: 2x − q = 0 at x = 2 so q = 4 (explanation often missing)
(ii) substitute (3, ½)
June 2019 · Paper 2 · Q7(a)1 mark
Mark scheme (whole question; this part is marked with the orange bar)
Examiner's comment
Q07 discriminated well between the medium and higher ability candidates. Lower ability candidates struggled to make much progress with this modelling question and most of them scored no more than one mark. In Q07(a), most candidates wrote down a correct equation for the model in the form , y kx c with constants k and c. A minority struggled to give a suitable form of the linear equation, with some omitting the fixed cost constant, c. Some candidates gave ; y x incorrect answers, such as equations involving exponential models; or differential equations. Q07(b) proved challenging for those candidates who struggled to grasp the concept ‘profit sales cost ’, with many of them incorrectly assuming that the model from Q07(a) was for the profit made. Many of these candidates used (800, 500) and either (300, 80) or (300, 80) to form two linear equations, with some erroneously finding a gradient of 0.84. Those candidates who understood the link between profit and cost usually found the total cost to the factory of £1100 and £680 for 800 and 300 bars of soap respectively. Most used (800, 1100) and (300, 680) to form two linear equations and proceeded to find the gradient, 0.84, and y-intercept, 428. A large proportion concluded by stating 0.84 428. y x the given equation A few candidates, however, did not complete their analysis with a suitable conclusion, and so lost the final mark. Some candidates used (800, 1100) and (300, 680)to verify the model 0.84 428. y x Many of these were successful but often failed to give a suitable conclusion stating that the given model was true. Q07(c) gave a significant number of candidates their only creditable access to Q07. Some candidates gave a correct interpretation such as 0.84 represented ‘the cost of making an extra bar of soap’. Incorrect explanations included that 0.84 represented ‘the selling price of a bar of soap’ or ‘the profit per bar of soap made’. There was a mixed response to Q07(d). The most popular approach was to form and or 2 0.84 428, n n solve a correct 2 which mostly led to the correct 0.84 428 n n n n n 369. 369, answer A final answer left as an inequality such as or 368 without reference to the statement that 369 was the number of bars required, was not n n sufficient for the final mark. Some candidates used trials of both and 368 369 n 369. in a complete trial and error method leading to a correct conclusion of
Common mistakes
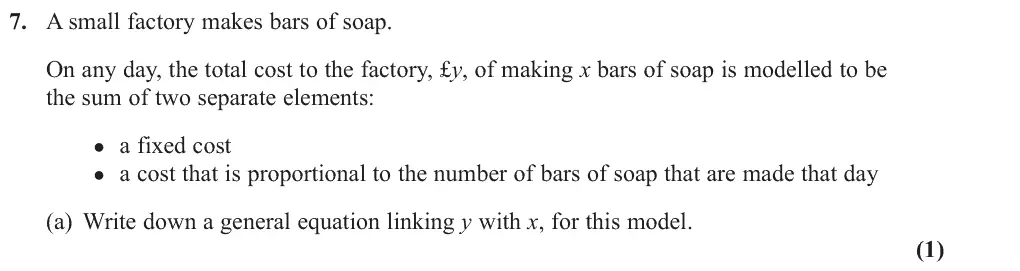
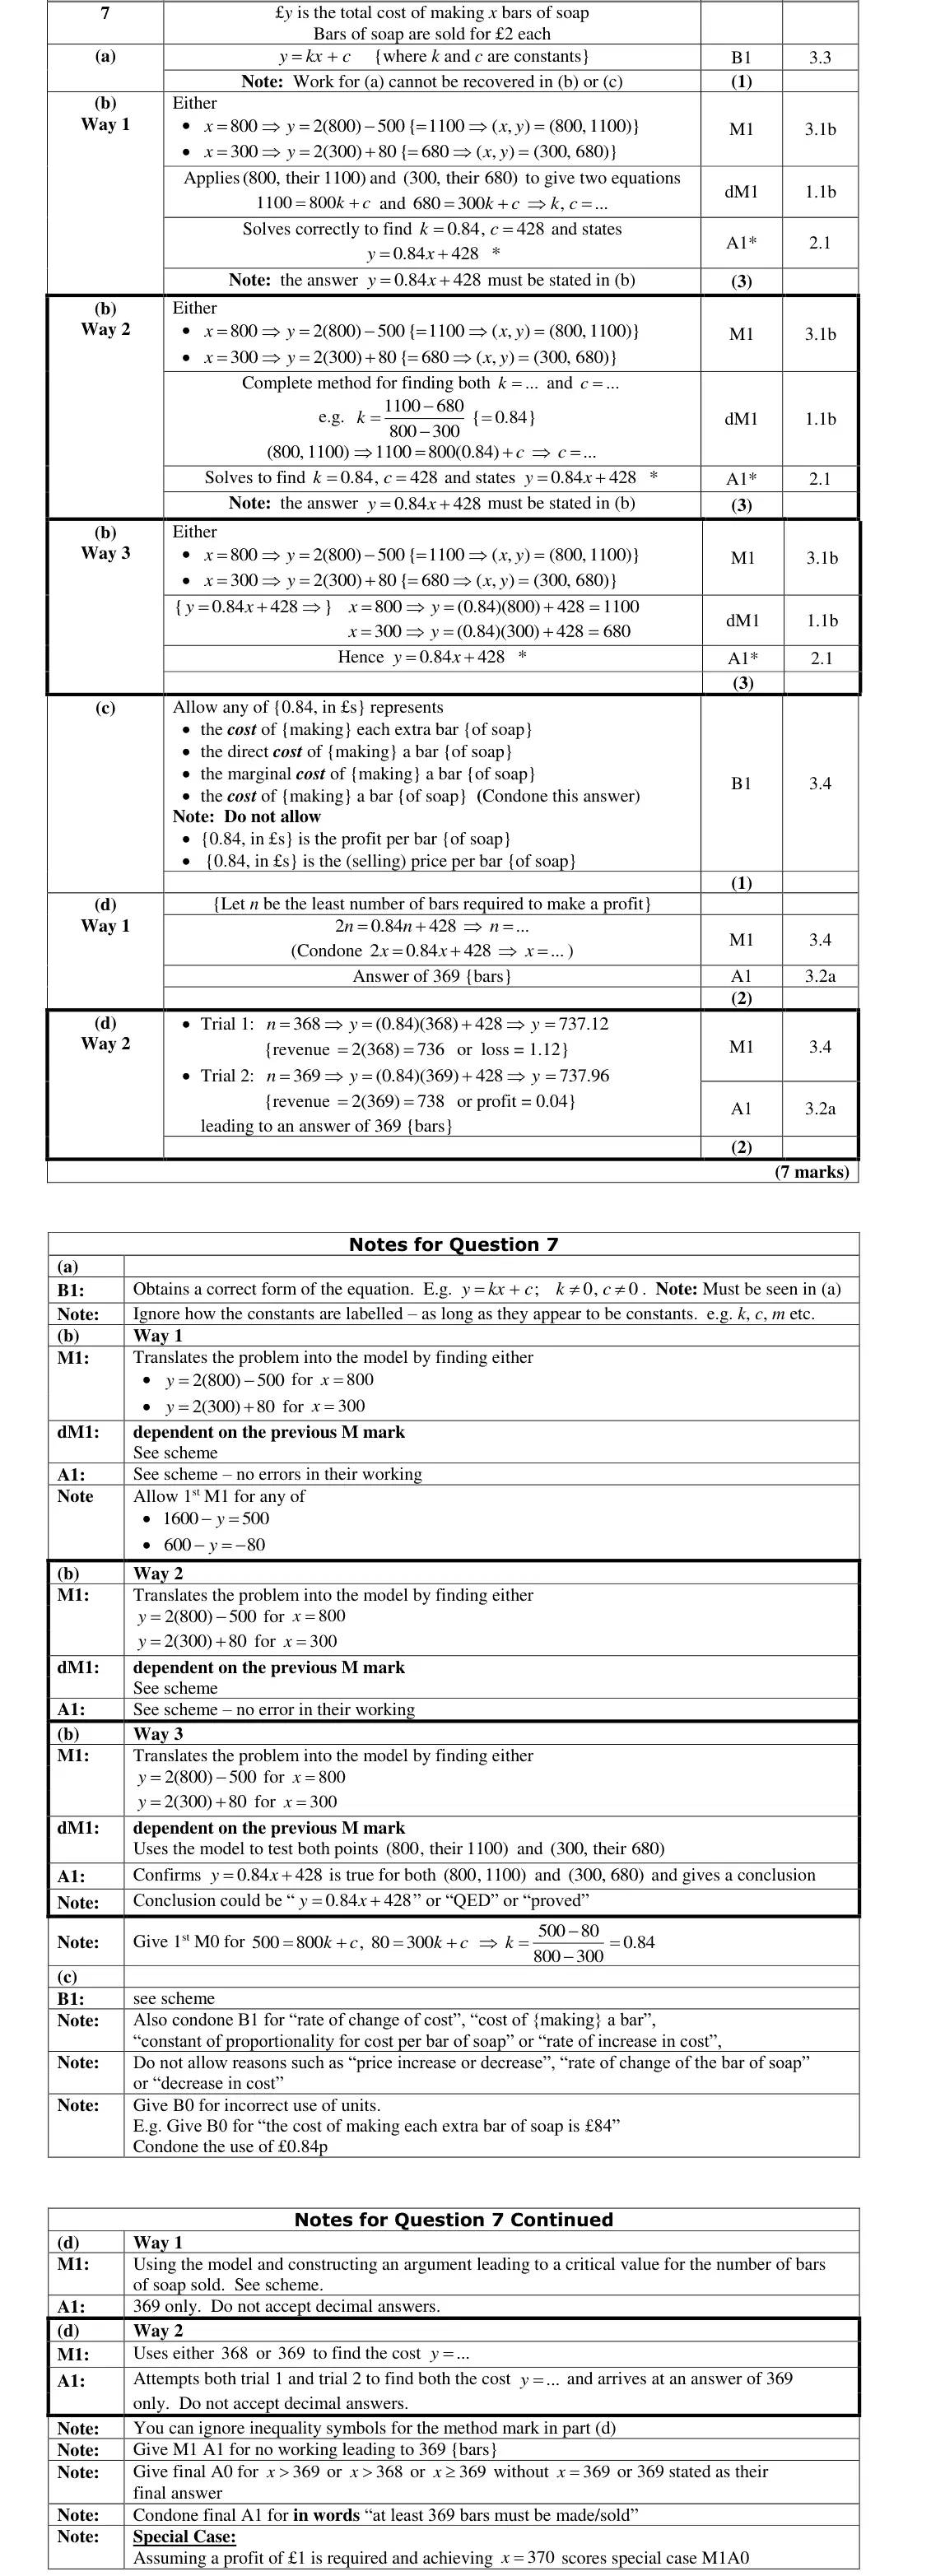
y = kx + c with constants
omitting the fixed cost c
exponential or differential equation models wrong
June 2018 · AS Paper 1 · Q9(c)3 marks
Mark scheme (whole question; this part is marked with the orange bar)
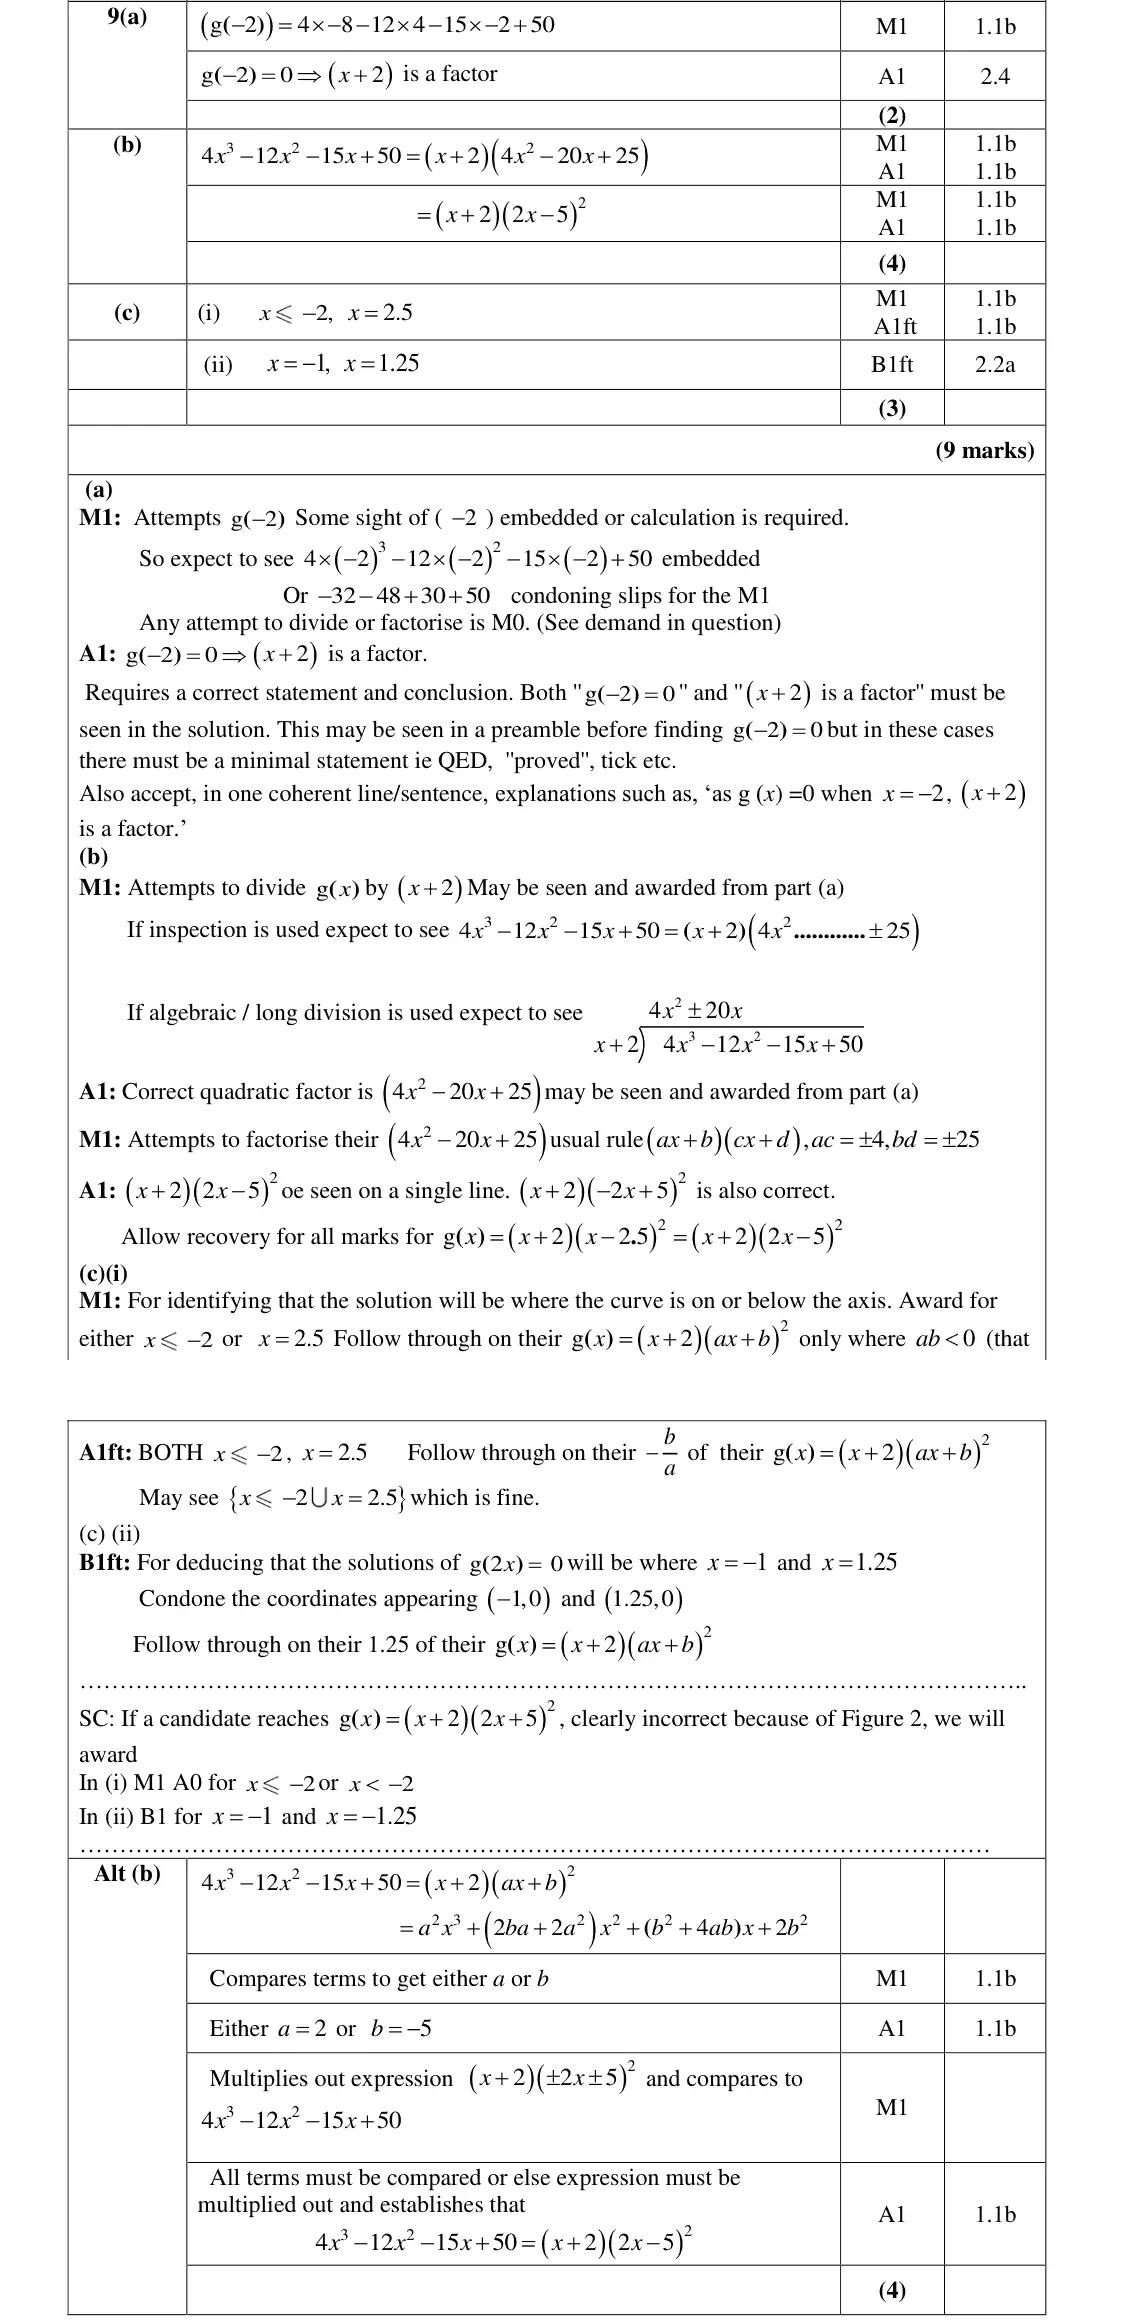
Examiner's comment
This question on the factor theorem proved to be a good source of marks for many students. Clearly they had been well prepared for this kind of question. Part (c) was usually attempted, but with limited success. In part (i) many achieved one mark, usually for 2 x (or x < - 2 which was condoned for the M mark). Errors from part (b) were often followed through correctly. Only more able (and careful) students gained full marks. In part (ii) many correctly use transformations to state x = -1 and x = 1.25. Some students multiplied the critical values by 2 (instead of dividing by 2) or in other cases they wrote down just one of the two solutions.
Common mistakes
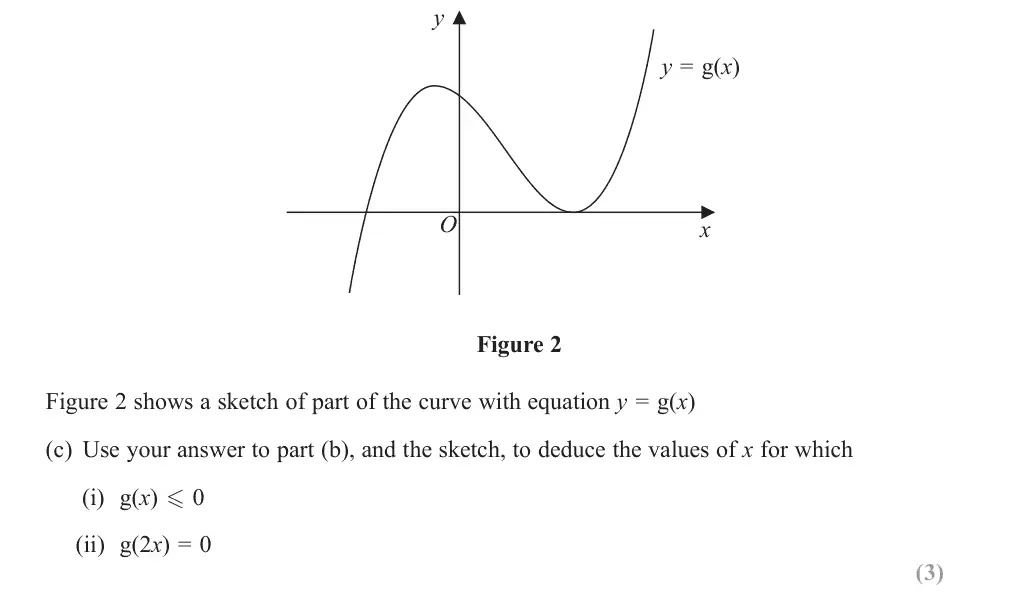
(i) curve on or below the axis: x ≤ −2 or x = 2.5 (the repeated root where the curve touches the axis is often missed)
(ii) g(2x) = 0 halves the roots: x = −1, 1.25 (not doubled)
June 2018 · Paper 1 · Q7(b)3 marks
Mark scheme (whole question; this part is marked with the orange bar)
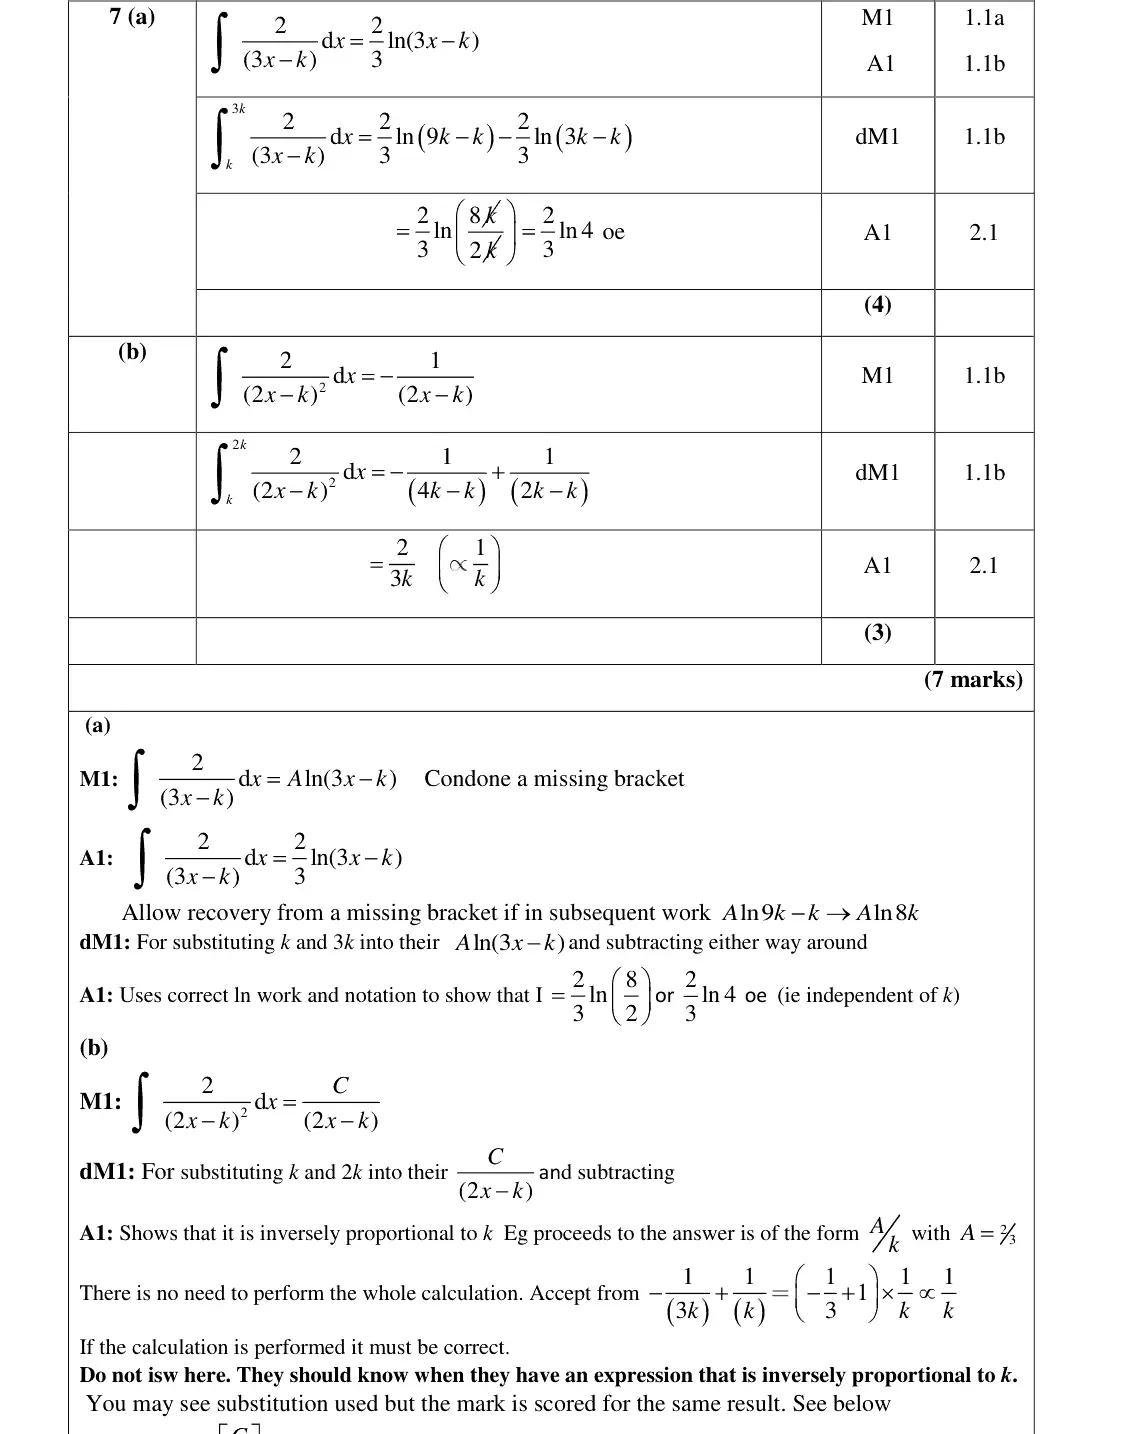
Examiner's comment
Both parts of this question were answered well, allowing students to demonstrate their confidence in integrating fractional expressions in x and working with unknown constants. independent of k, or in (b) inversely proportional to k. Whilst not a requirement for the final A mark in either part, the logical completion of the question would have been to make these conclusions and show an understanding of these mathematical terms. Common method errors in this question included integrating to obtain a natural logarithm in part (b) as well as part (a). Additionally, despite the successful implementation of limits, some careless and disappointing algebra was seen in simplifying their final expressions in an attempt to answer the question. A more unusual but not uncommon error was related to the fact that ‘k’ occurred both in the integral and in the limits. Some students integrated with respect to k whilst others substituted the limits for the term in k rather than the term in x. Other unusual attempts were seen by students attempting to use partial fractions within part (b).
Common mistakes
integrate to −1/(2x − k), not a logarithm
limits 2k and k into x
2/(3k) is of the form A/k so inversely proportional (do not isw)
partial fractions not needed
June 2018 · Paper 1 · Q14(b)3 marks
Mark scheme (whole question; this part is marked with the orange bar)
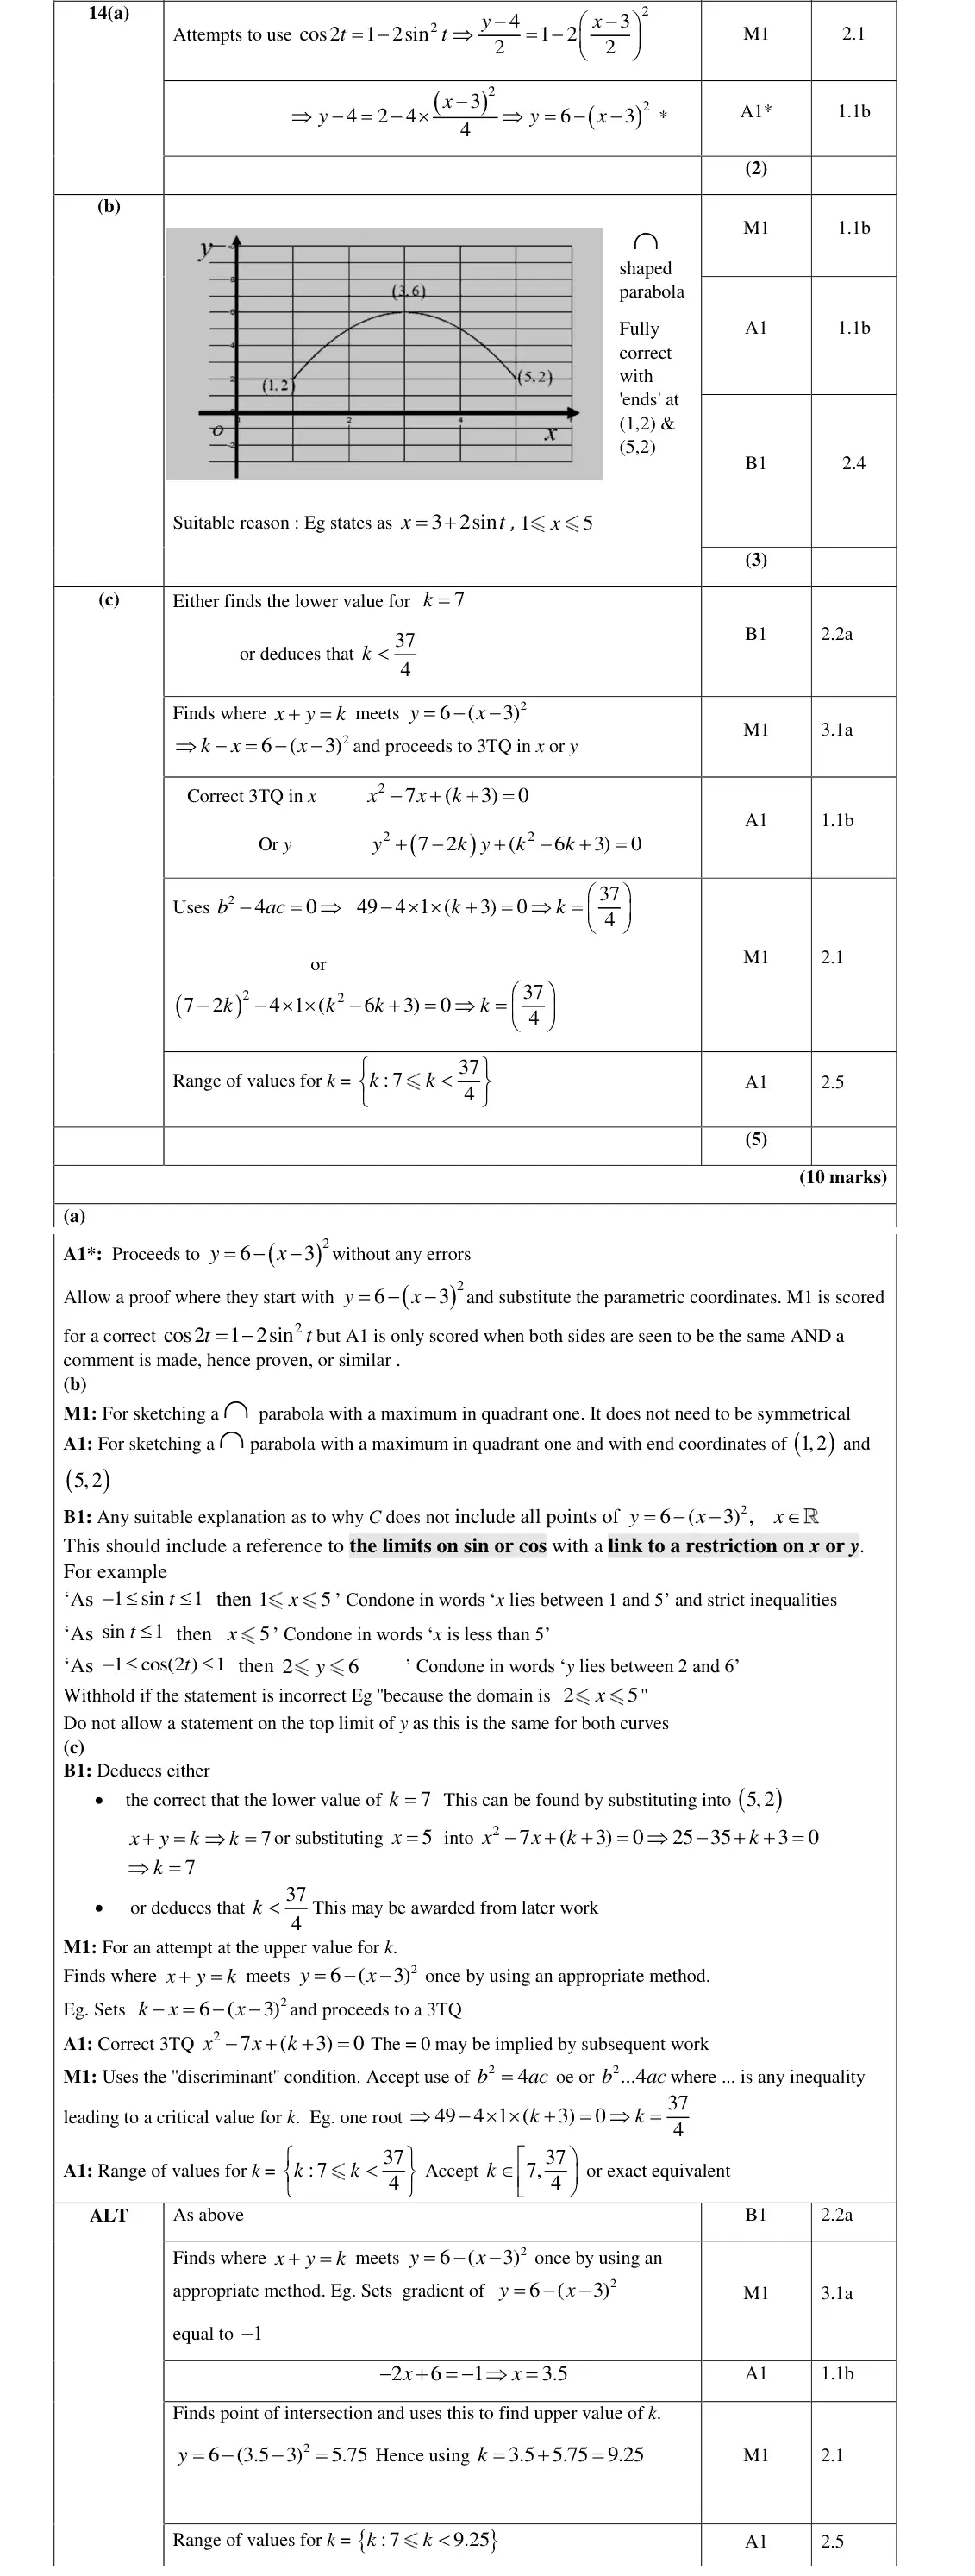
Examiner's comment
part (b) scoring one out of the three marks. Those who managed to sketch the correct part of the parabola rarely were able to explain why the domain (and range) were restricted. Stating that ''because 0 2 t '' was not enough to explain why for instance 1 5 x . The best then 3 2sint students were able to explain that as 1 sin 1 t would have a maximum and a minimum value of 3 2 value of 3 2 5 1.
Common mistakes
sketch only the arc from (1, 2) to (5, 2) with maximum (3, 6), not the whole parabola
reason: −1 ≤ sin t ≤ 1 so 1 ≤ x ≤ 5 ("0 ≤ t < 2π" alone is not enough)
June 2018 · Paper 1 · Q14(c)5 marks
Mark scheme (whole question; this part is marked with the orange bar)
Examiner's comment
Part (c) was also demanding and better students annotated their graphs to help their understanding of the question (See Figure 1). Most however used the discriminant condition 2 for two roots and were able to proceed to two values. Arithmetic errors were 4 0 b ac quite common using this method. Most students who proceeded to the answer were well versed in writing their answer using set notation. Figure 1
Common mistakes
lower value k = 7 from the end point (5, 2)
x² − 7x + (k + 3) = 0 with b² − 4ac = 0 gives k = 37/4
answer {k : 7 ≤ k < 37/4} in set notation
annotate the sketch
June 2018 · Paper 2 · Q3(b)3 marks
Mark scheme (whole question; this part is marked with the orange bar)
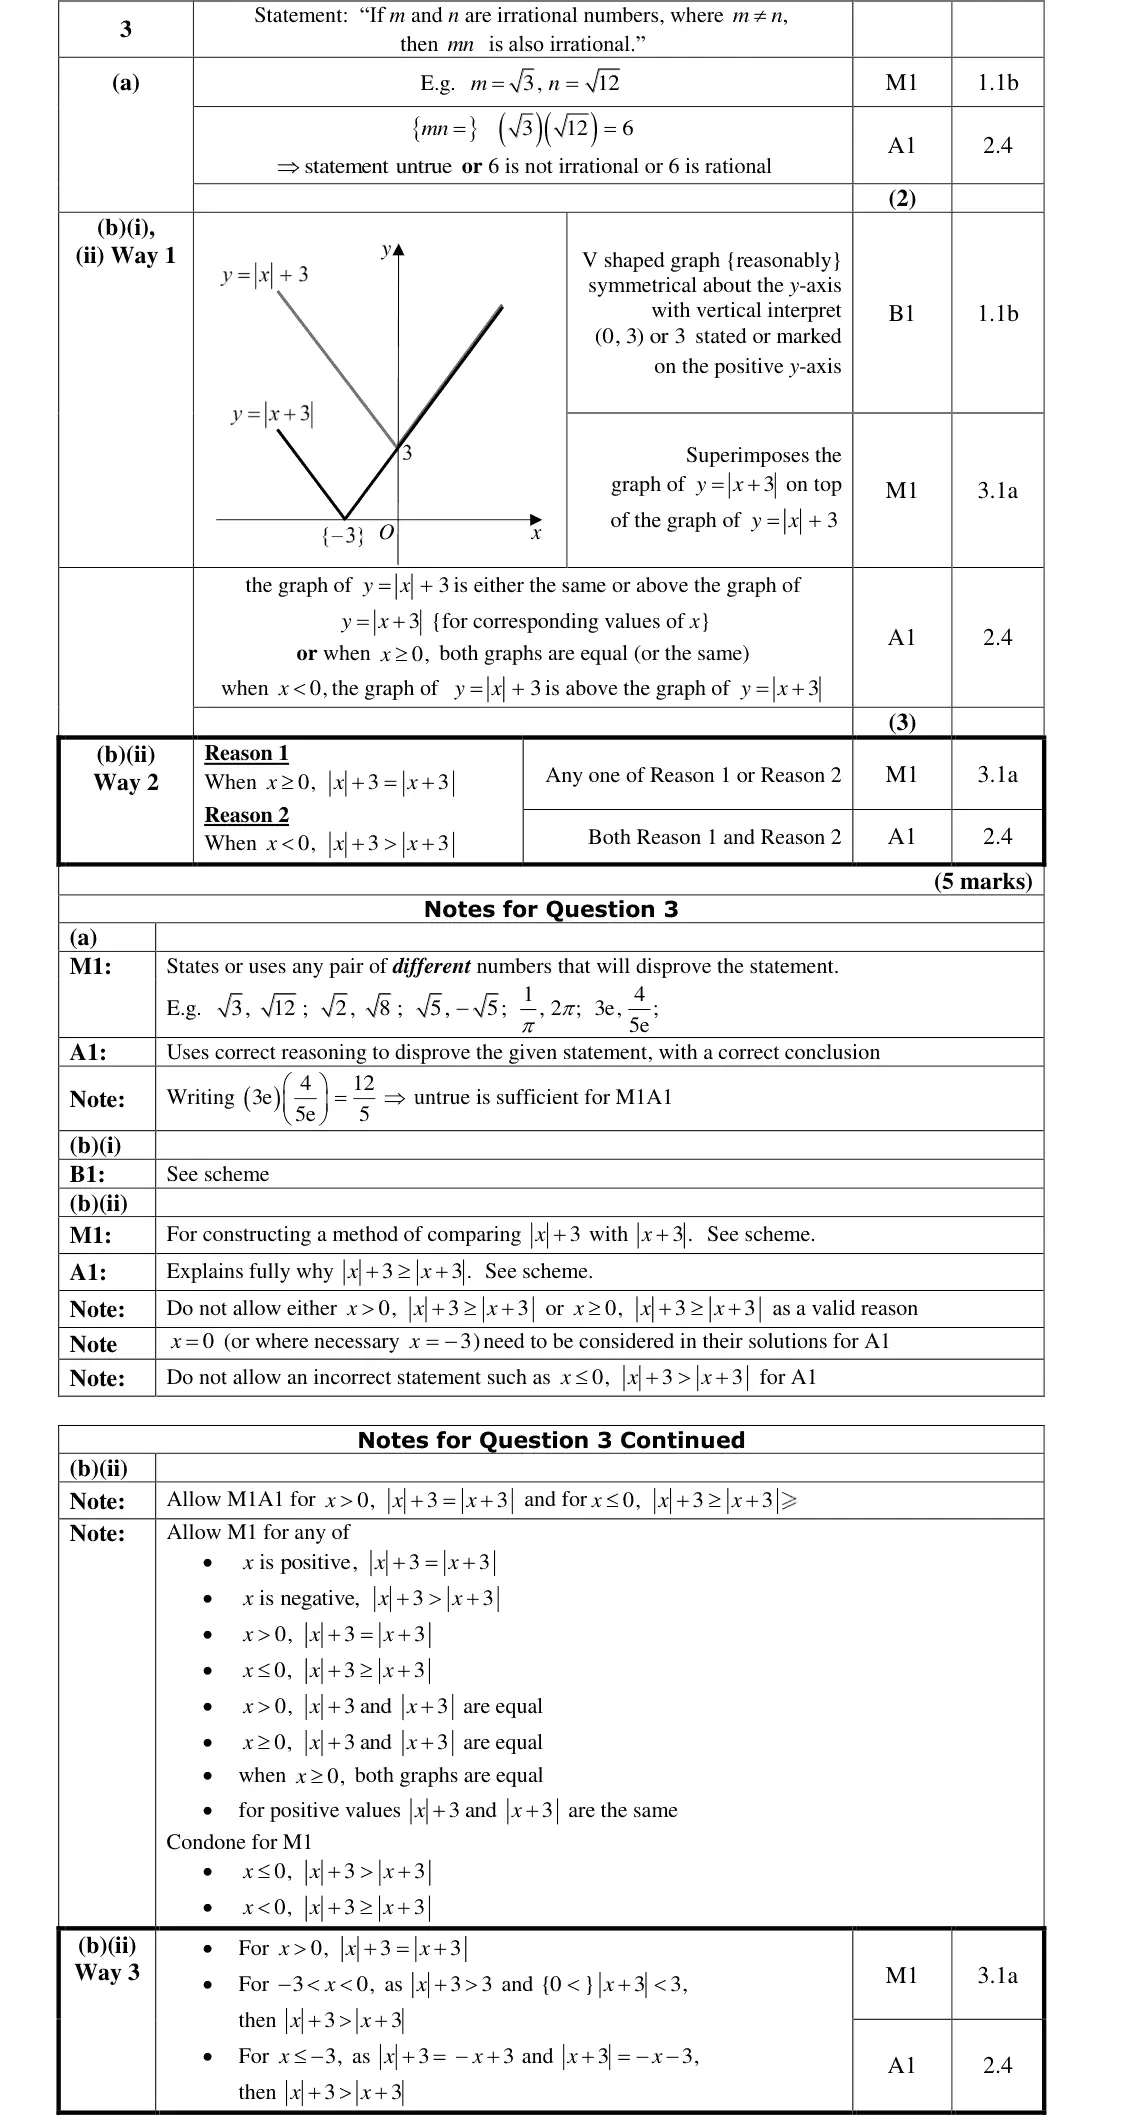
Examiner's comment
This question discriminated well between students of all abilities with some students struggling to access the final mark in part (b). In part (b)(i), most students drew a V-shaped graph in the correct position with many labelling 3 or (0, 3) as the y-intercept. In part (b)(ii), those students who superimposed the graph of 3 y x over the graph of 3 y x were usually more successful in explaining why 3 3 x x for all real values of x. Otherwise, a variety of explanations were seen, of which some were detailed, usually containing at least one correct statement. Common errors included explanations which did not consider the case 0 x or explanations including the statement that the graphs of 3 y x and 3 y x were parallel for all 0. x A significant number of students who only tested the statement 3 3 x x for specific values of x (usually one positive and one negative) did not receive any credit in this part.
Common mistakes
V shape with vertex (0, 3)
superimpose y = modulus of (x + 3)
for x ≥ 0 equal, for x < 0 modulus of x plus 3 is greater
testing particular values gets no credit
graphs are not "parallel" for x < 0
Find an Edexcel maths tutor
Stuck on this? Book a trial session with an Edexcel specialist.