Oct 2021: Paper 3 Section A: Statistics

50 marks · 22 question parts · Question paper, mark scheme and examiner's report on Pearson's site

Question by question

QTopicMarksDifficulty
1(a) Sampling 1 —
1(b) Discrete distributions and the binomial distribution 3 —
1(c) Probability, including conditional probability 1 —
1(d) Discrete distributions and the binomial distribution, Probability, including conditional probability 2 Medium
2(a) Correlation and regression 1 —
2(b) Correlation and regression 1 —
2(c) Hypothesis testing, Correlation and regression 1 —
2(d) Hypothesis testing 3 —
3(a) Data presentation: histograms, box plots, measures and outliers, The large data set 1 Easy
3(b) Data presentation: histograms, box plots, measures and outliers 2 Easy
3(c) Data presentation: histograms, box plots, measures and outliers 3 Easy
3(d) Data presentation: histograms, box plots, measures and outliers, The large data set 2 Easy
4(a) Probability, including conditional probability 1 Hard
4(b) Probability, including conditional probability 3 Medium
4(c) Probability, including conditional probability 4 Easy
4(d) Probability, including conditional probability 3 Easy
5(a) Normal distribution 2 —
5(b) Normal distribution 1 Easy
5(c) Normal distribution, Probability, including conditional probability 4 —
5(d) Hypothesis testing 4 —
6(a) Discrete distributions and the binomial distribution, Exponentials and logarithms 5 —
6(b) Discrete distributions and the binomial distribution, Probability, including conditional probability, Exponentials and logarithms 2 Hard

The questions

1(a)1(b)1(c)1(d)2(a)2(b)2(c)2(d)3(a)3(b)3(c)3(d)4(a)4(b)4(c)4(d)5(a)5(b)5(c)5(d)6(a)6(b)
Oct 2021 · Paper 3 (Statistics) · Q1(a) 1 mark sampling
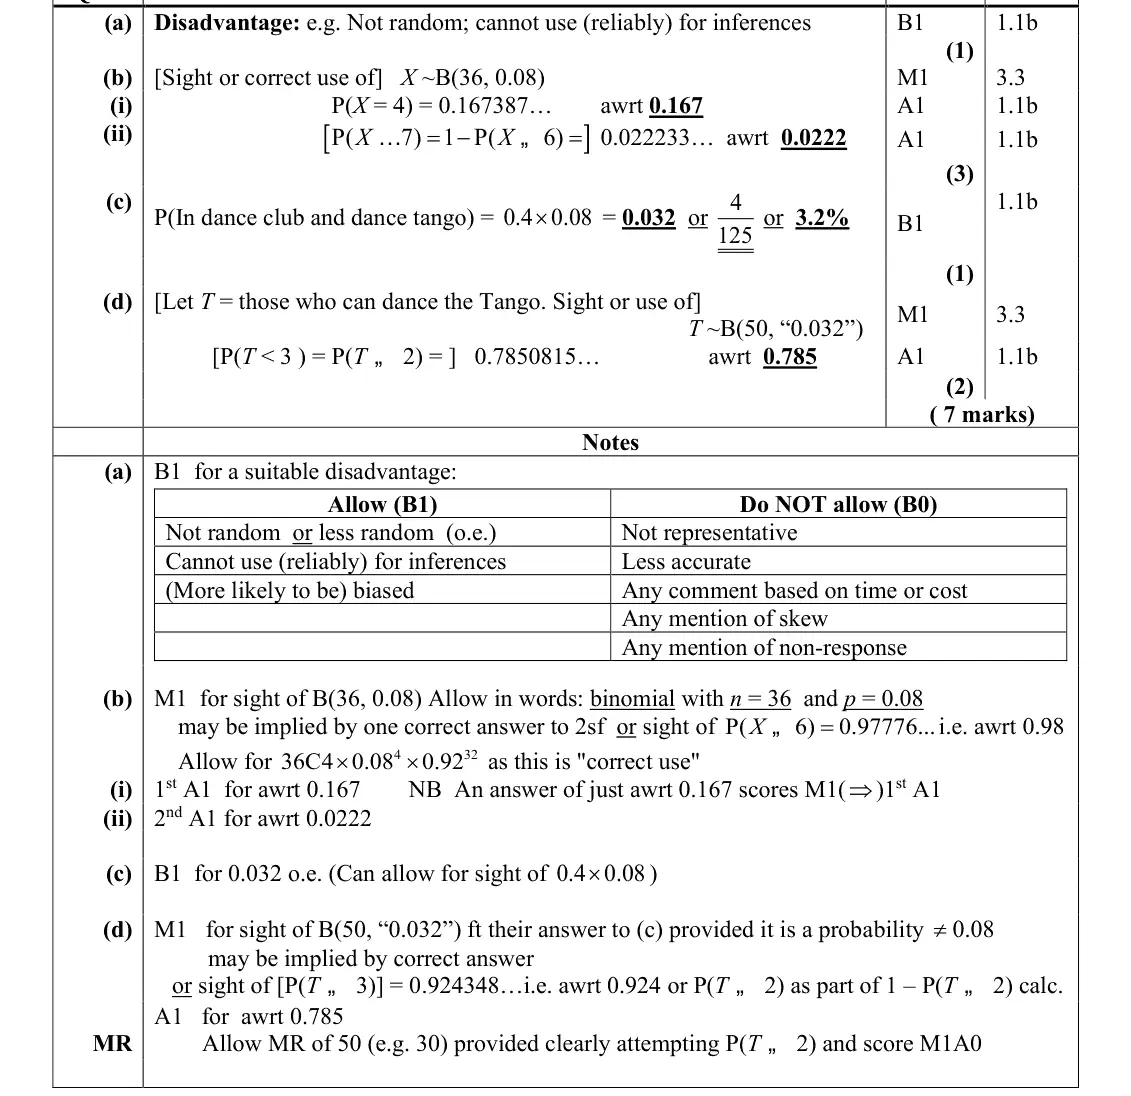
1. (a) State one disadvantage of using quota sampling compared with simple random sampling. (1)
Oct 2021 · Paper 3 (Statistics) · Q1(b) 3 marks binomial distribution
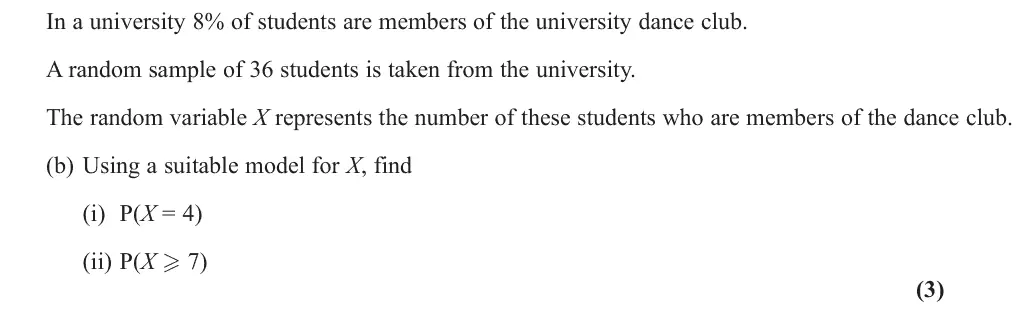
In a university 8% of students are members of the university dance club. A random sample of 36 students is taken from the university. The random variable X represents the number of these students who are members of the dance club. (b) Using a suitable model for X, find (i) P(X = 4) (ii) P(X 7) (3)
Oct 2021 · Paper 3 (Statistics) · Q1(c) 1 mark probability
Only 40% of the university dance club members can dance the tango. (c) Find the probability that a student is a member of the university dance club and can dance the tango. (1)
Oct 2021 · Paper 3 (Statistics) · Q1(d) 2 marks Medium binomial distributionprobability
A random sample of 50 students is taken from the university. (d) Find the probability that fewer than 3 of these students are members of the university dance club and can dance the tango. (2)
Oct 2021 · Paper 3 (Statistics) · Q2(a) 1 mark correlation and regression
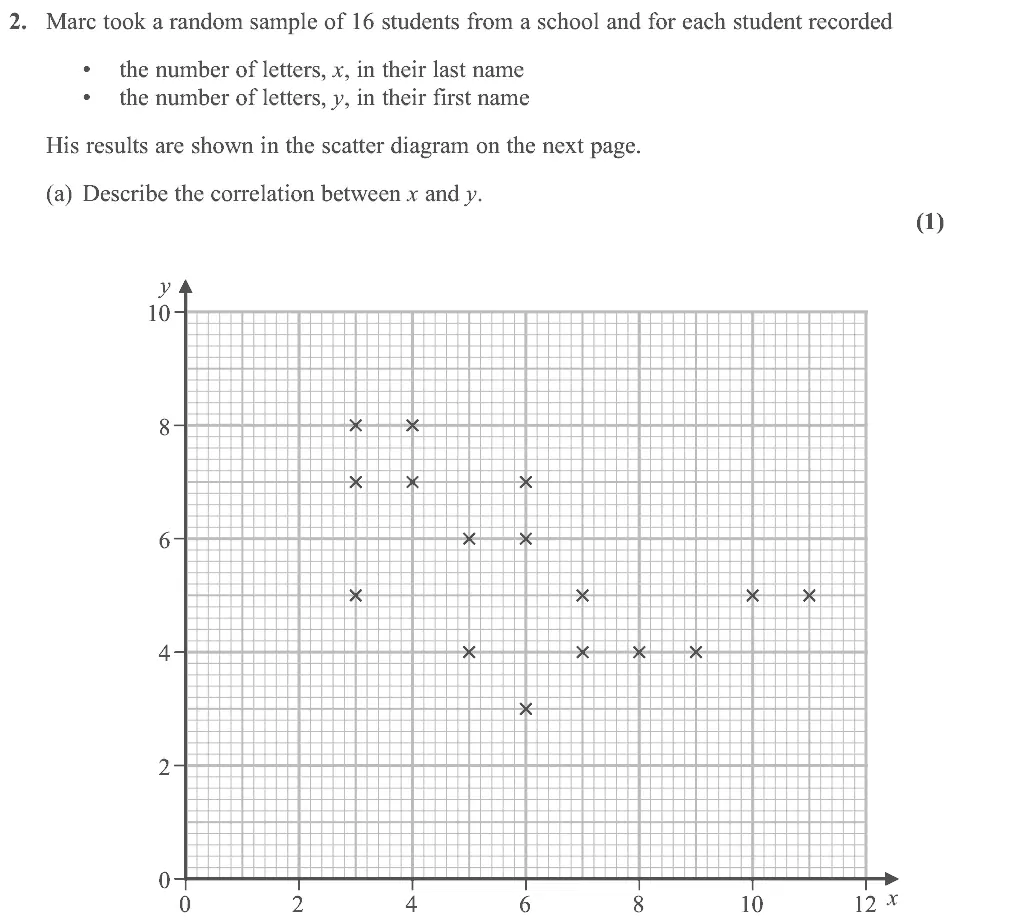
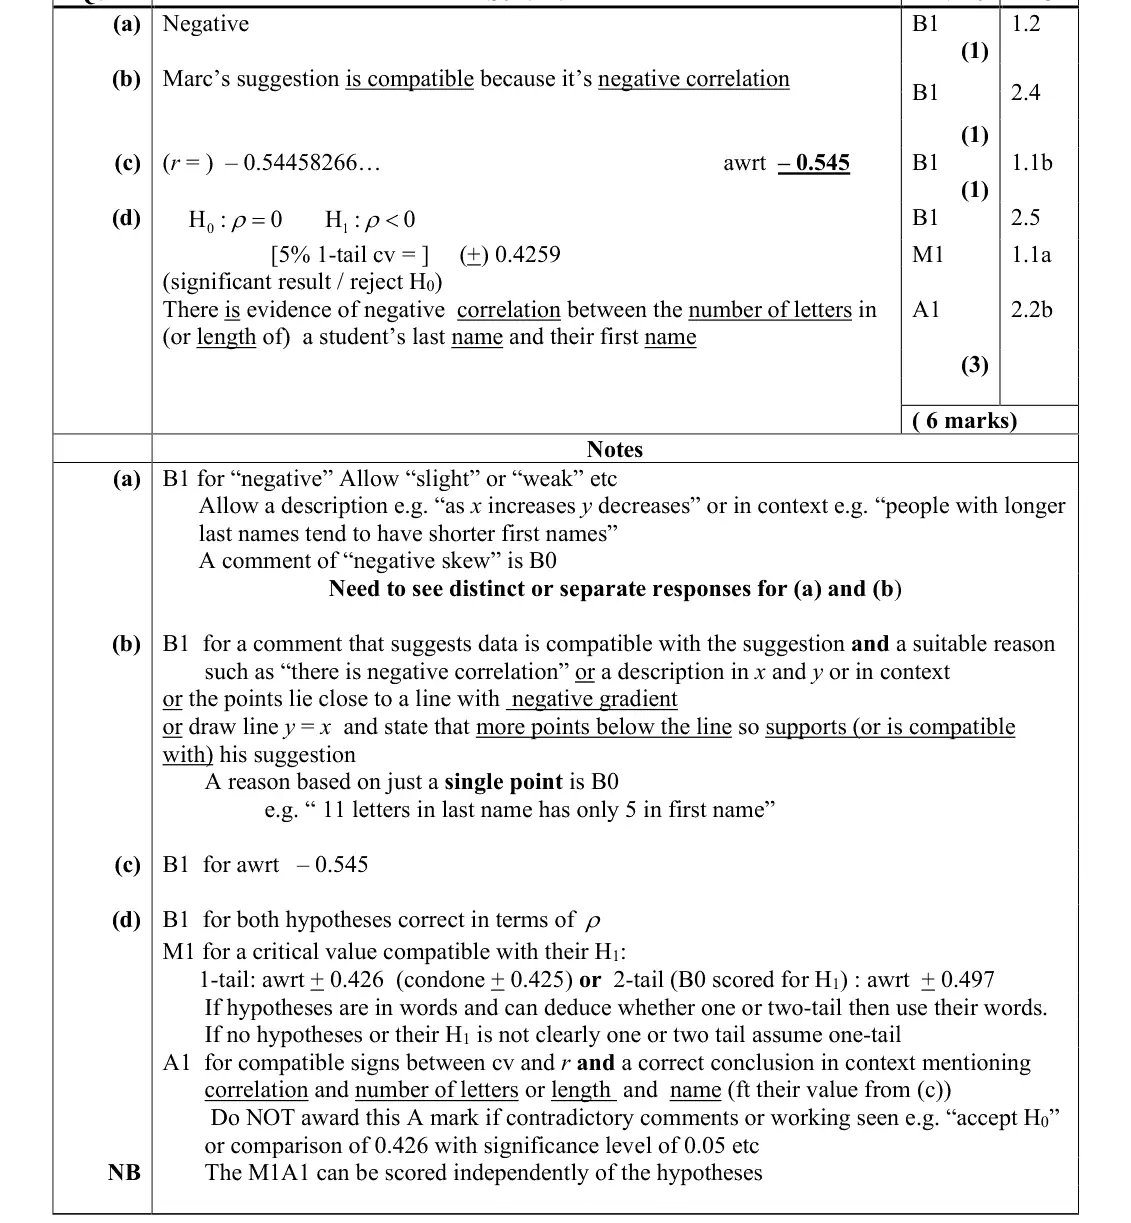
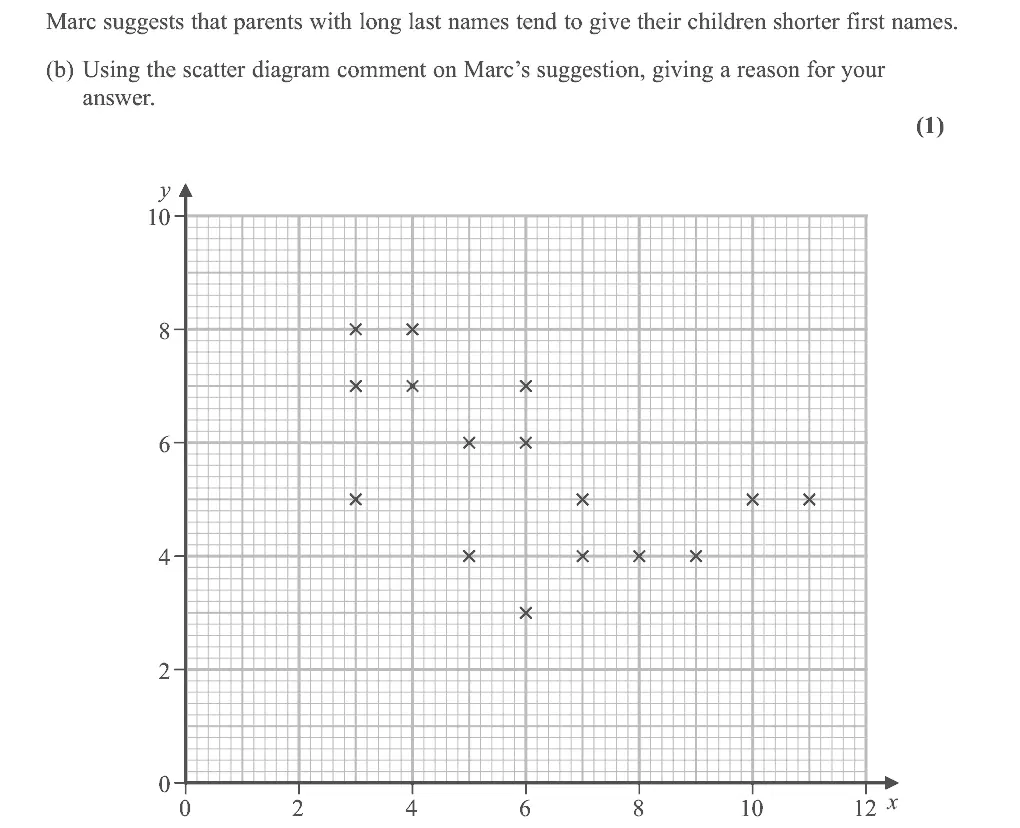
2. Marc took a random sample of 16 students from a school and for each student recorded • the number of letters, x, in their last name • the number of letters, y, in their first name His results are shown in the scatter diagram on the next page. (a) Describe the correlation between x and y. (1)
Oct 2021 · Paper 3 (Statistics) · Q2(b) 1 mark correlation and regression
Marc suggests that parents with long last names tend to give their children shorter first names. (b) Using the scatter diagram comment on Marc’s suggestion, giving a reason for your answer. (1)
Oct 2021 · Paper 3 (Statistics) · Q2(c) 1 mark hypothesis testingcorrelation and regression
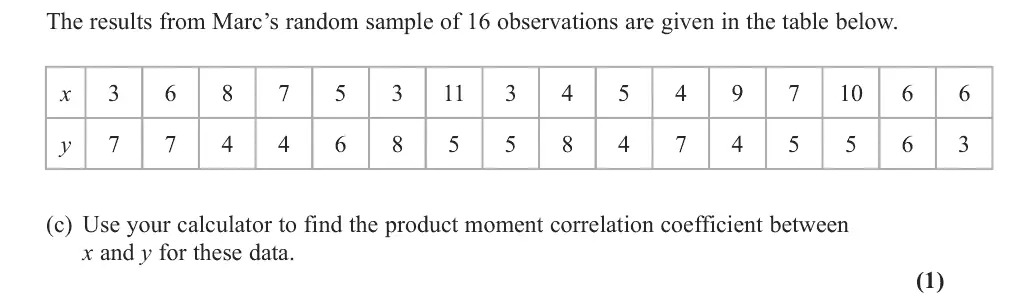
The results from Marc’s random sample of 16 observations are given in the table below. x y (c) Use your calculator to find the product moment correlation coefficient between x and y for these data. (1)
Oct 2021 · Paper 3 (Statistics) · Q2(d) 3 marks hypothesis testing
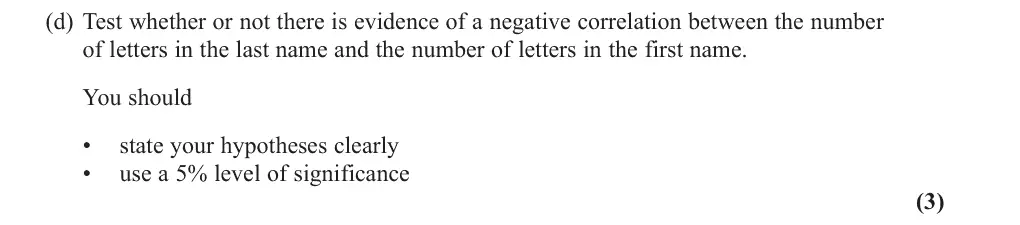
(d) Test whether or not there is evidence of a negative correlation between the number of letters in the last name and the number of letters in the first name. You should • state your hypotheses clearly • use a 5% level of significance (3)
Oct 2021 · Paper 3 (Statistics) · Q3(a) 1 mark Easy data presentationlarge data set
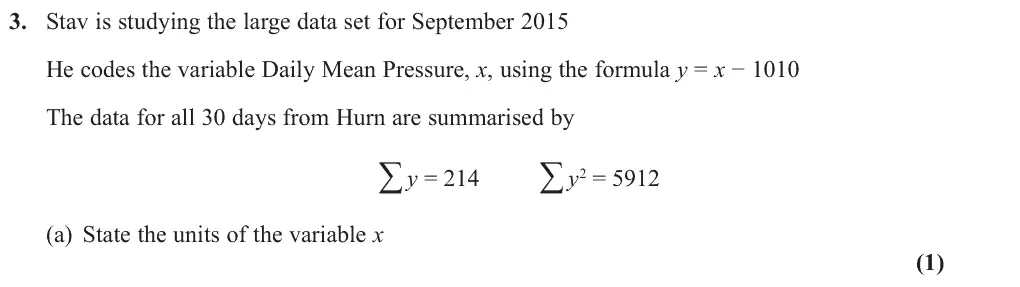
3. Stav is studying the large data set for September 2015 He codes the variable Daily Mean Pressure, x, using the formula y = x - 1010 The data for all 30 days from Hurn are summarised by ∑ y = 214 ∑ y2 = 5912 (a) State the units of the variable x (1)
Oct 2021 · Paper 3 (Statistics) · Q3(b) 2 marks Easy data presentation
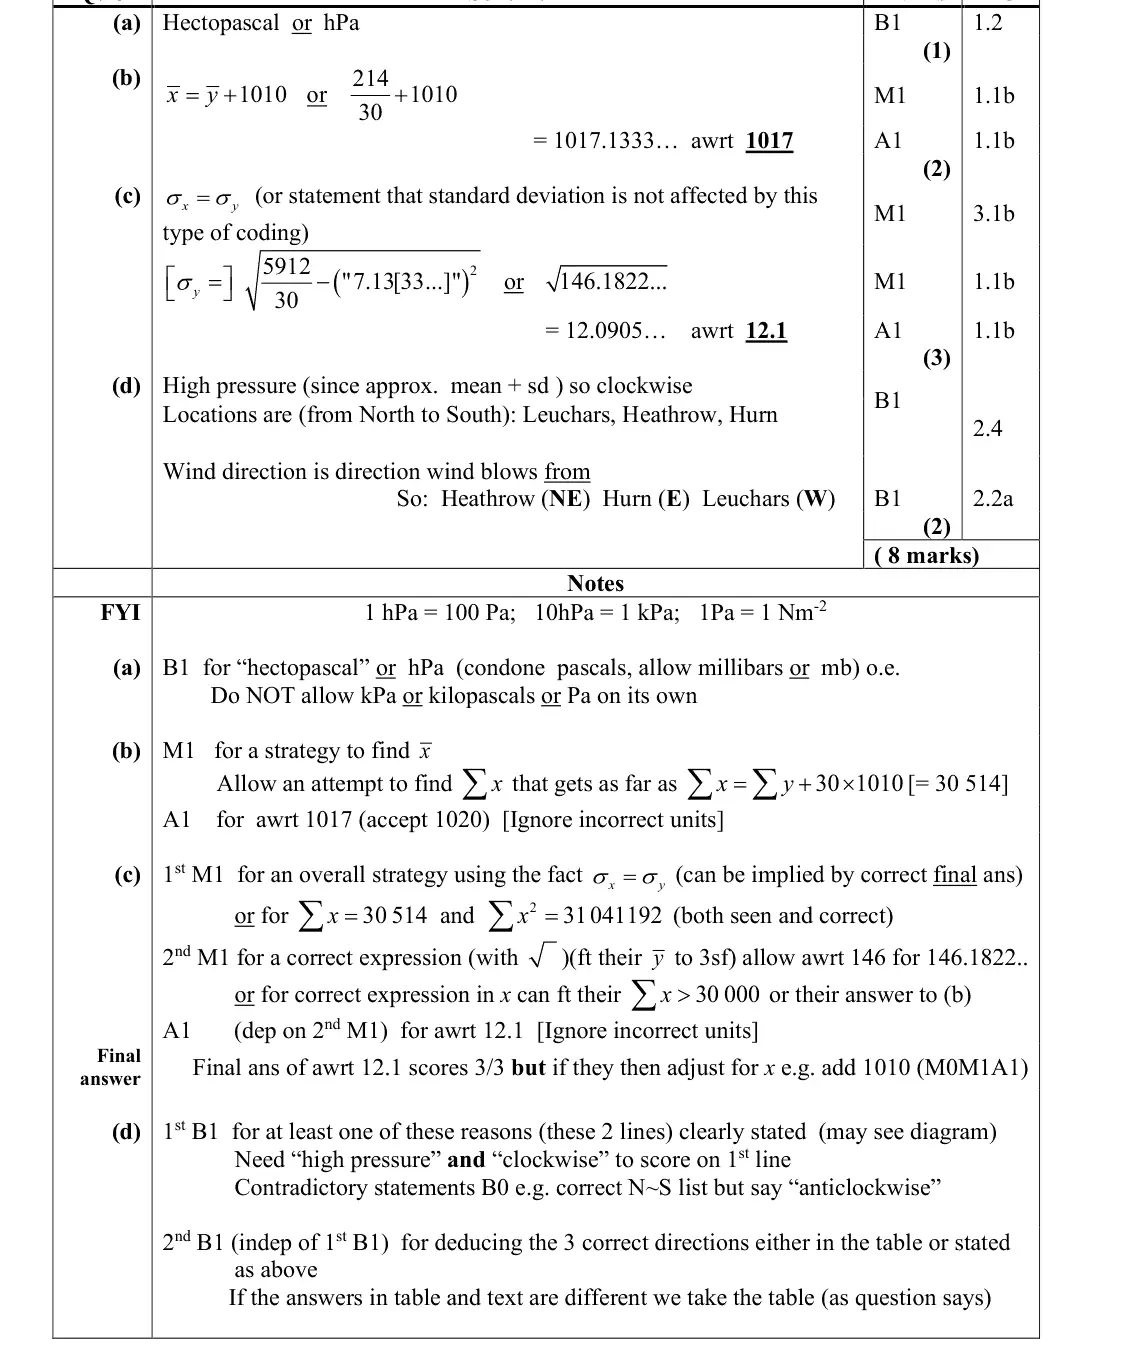
(b) Find the mean Daily Mean Pressure for these 30 days. (2)
Oct 2021 · Paper 3 (Statistics) · Q3(c) 3 marks Easy data presentation
(c) Find the standard deviation of Daily Mean Pressure for these 30 days. (3)
Oct 2021 · Paper 3 (Statistics) · Q3(d) 2 marks Easy data presentationlarge data set
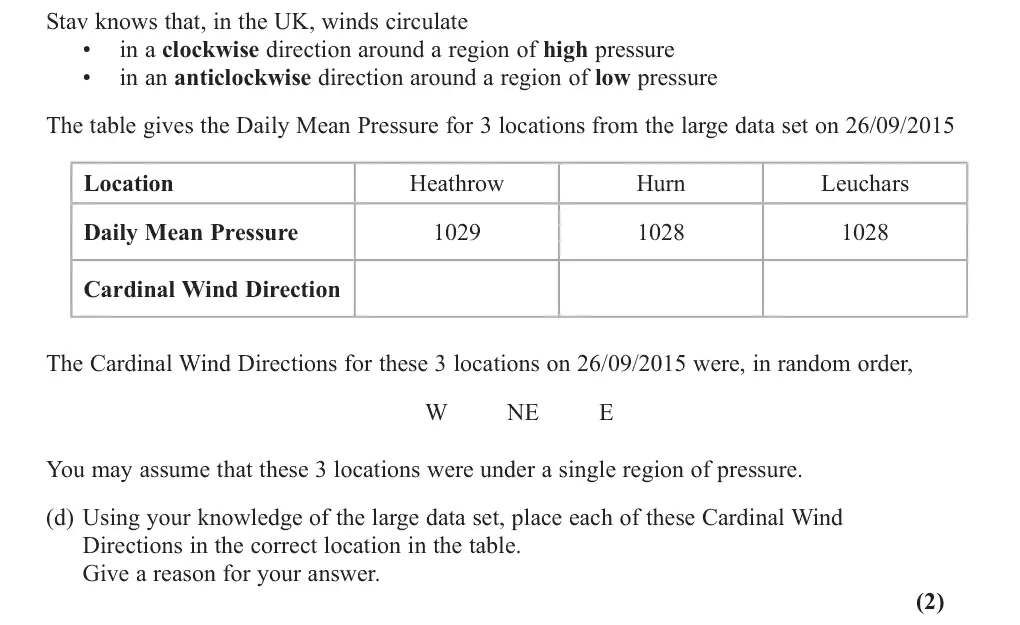
Stav knows that, in the UK, winds circulate • in a clockwise direction around a region of high pressure • in an anticlockwise direction around a region of low pressure The table gives the Daily Mean Pressure for 3 locations from the large data set on 26/09/2015 Location Heathrow Hurn Leuchars Daily Mean Pressure 1029 1028 1028 Cardinal Wind Direction The Cardinal Wind Directions for these 3 locations on 26/09/2015 were, in random order, W NE E You may assume that these 3 locations were under a single region of pressure. (d) Using your knowledge of the large data set, place each of these Cardinal Wind Directions in the correct location in the table. Give a reason for your answer. (2)
Oct 2021 · Paper 3 (Statistics) · Q4(a) 1 mark Hard probability
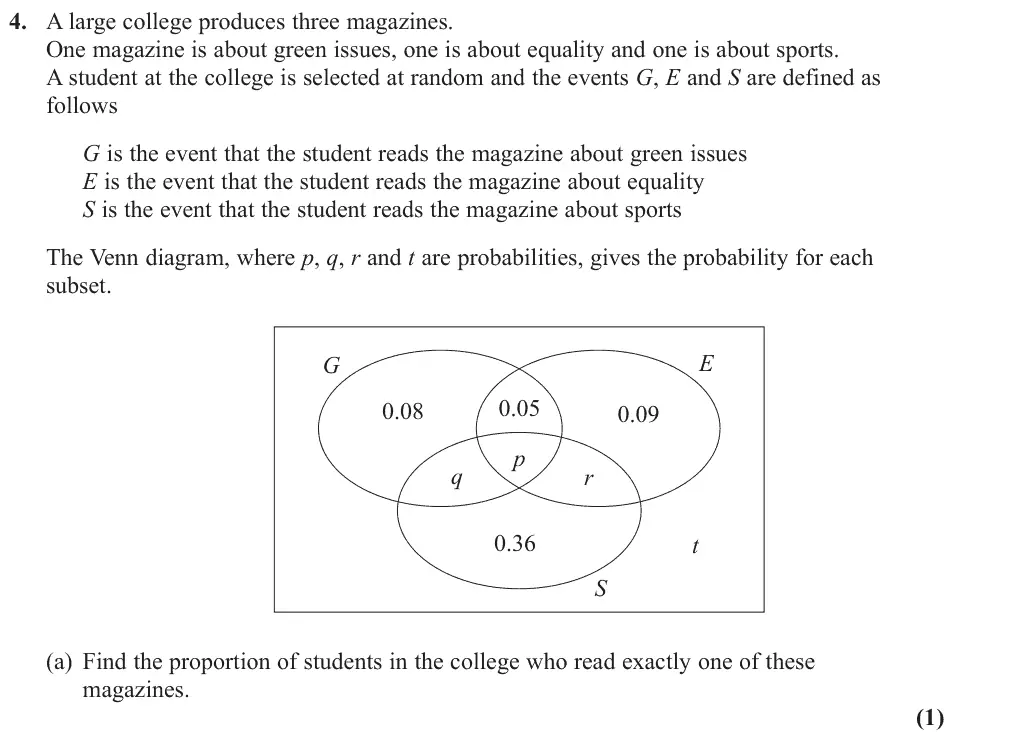
4. A large college produces three magazines. One magazine is about green issues, one is about equality and one is about sports. A student at the college is selected at random and the events G, E and S are defined as follows G is the event that the student reads the magazine about green issues E is the event that the student reads the magazine about equality S is the event that the student reads the magazine about sports The Venn diagram, where p, q, r and t are probabilities, gives the probability for each subset. E G 0.05 0.08 0.09 p q r 0.36 t S (a) Find the proportion of students in the college who read exactly one of these magazines. (1)
Oct 2021 · Paper 3 (Statistics) · Q4(b) 3 marks Medium probability
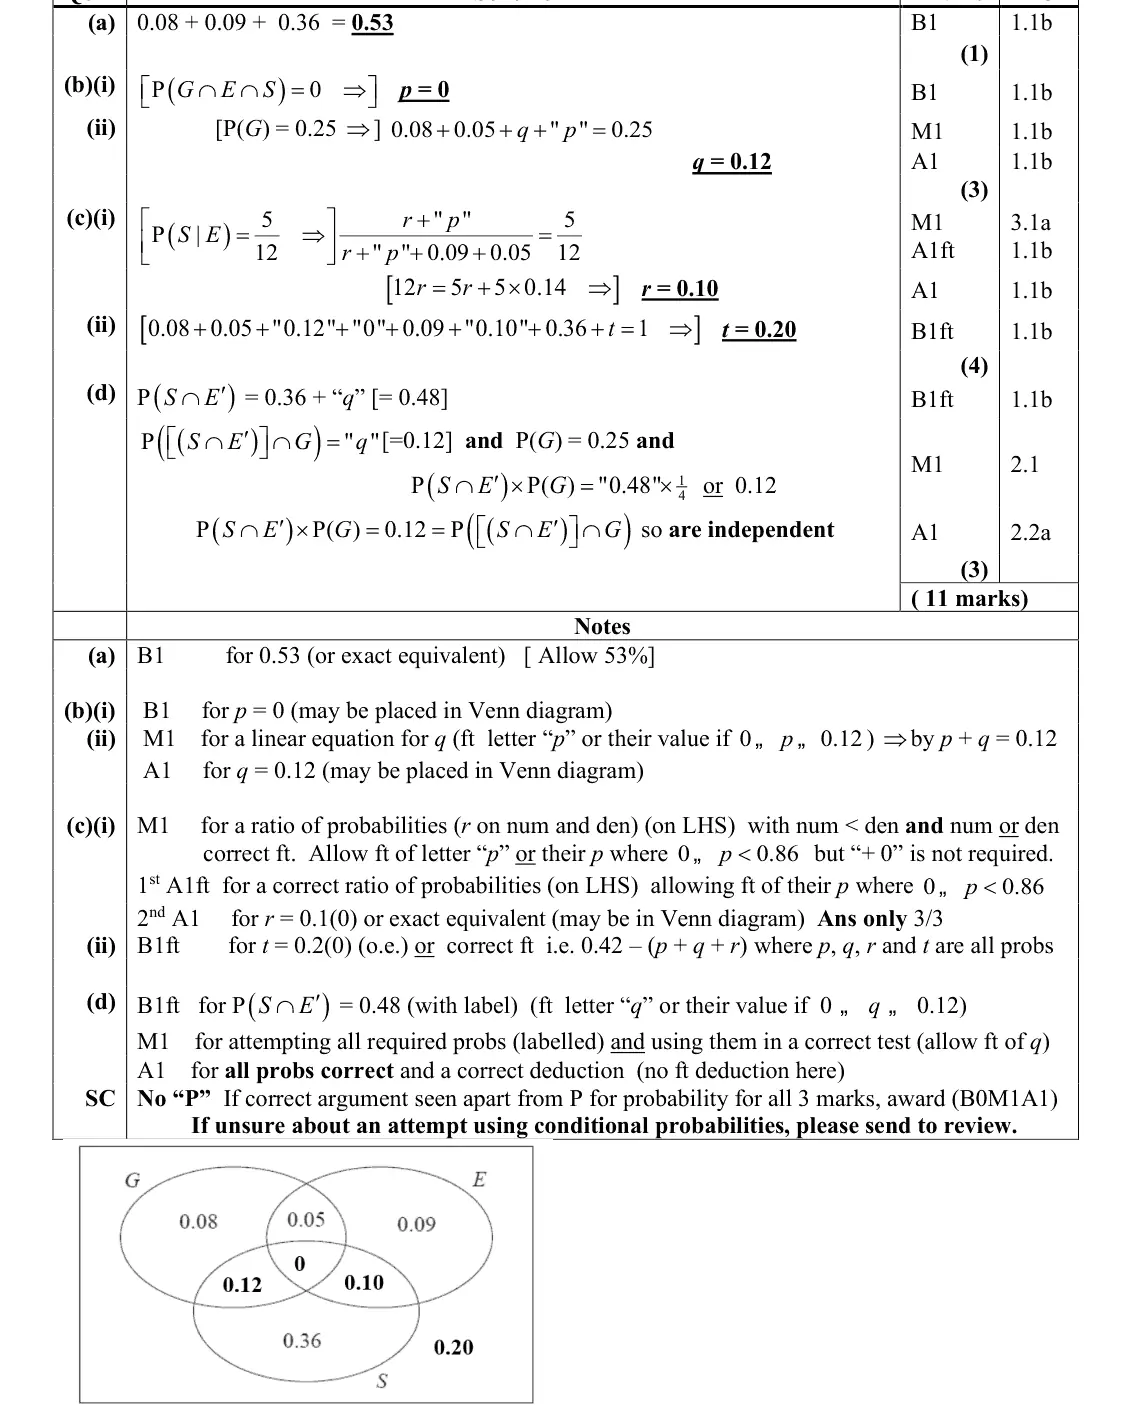
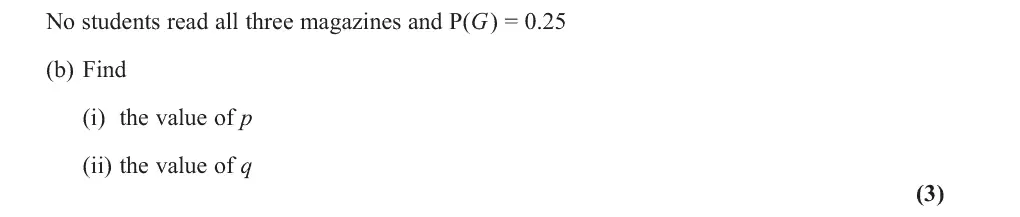
No students read all three magazines and P(G) = 0.25 (b) Find (i) the value of p (ii) the value of q (3)
Oct 2021 · Paper 3 (Statistics) · Q4(c) 4 marks Easy probability
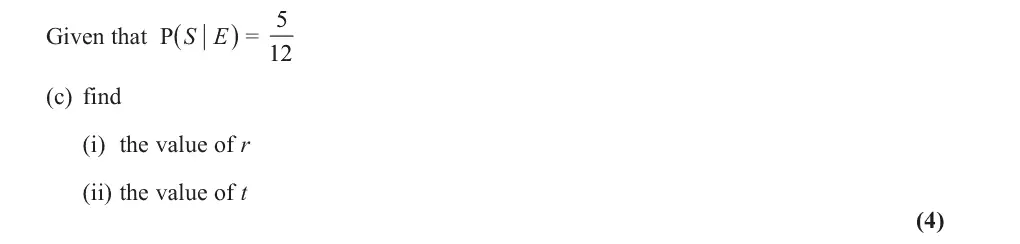
Given that P(S | E) = 5 (c) find (i) the value of r (ii) the value of t (4)
Oct 2021 · Paper 3 (Statistics) · Q4(d) 3 marks Easy probability
(d) Determine whether or not the events (S ∩ Eʹ) and G are independent. Show your working clearly. (3)
Oct 2021 · Paper 3 (Statistics) · Q5(a) 2 marks normal distribution
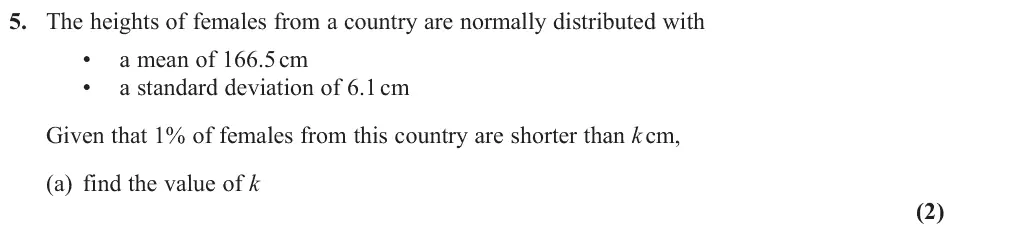
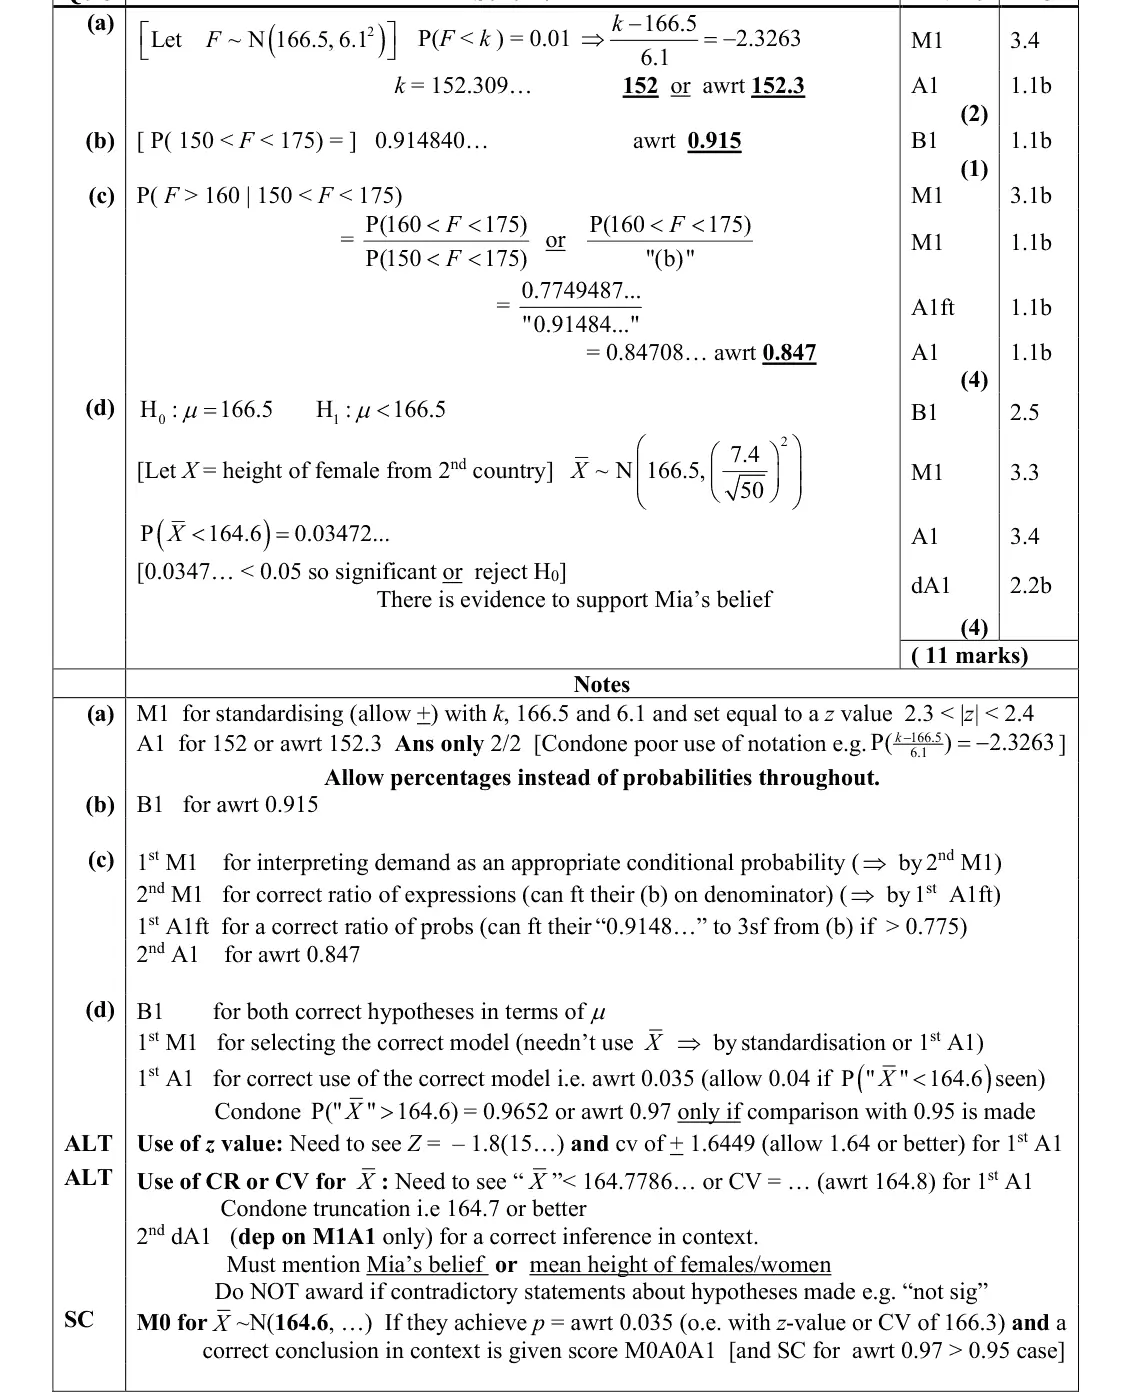
5. The heights of females from a country are normally distributed with • a mean of 166.5 cm • a standard deviation of 6.1 cm Given that 1% of females from this country are shorter than k cm, (a) find the value of k (2)
Oct 2021 · Paper 3 (Statistics) · Q5(b) 1 mark Easy normal distribution
(b) Find the proportion of females from this country with heights between 150 cm and 175 cm (1)
Oct 2021 · Paper 3 (Statistics) · Q5(c) 4 marks normal distributionprobability
A female, from this country, is chosen at random from those with heights between 150 cm and 175 cm (c) Find the probability that her height is more than 160 cm (4)
Oct 2021 · Paper 3 (Statistics) · Q5(d) 4 marks hypothesis testing
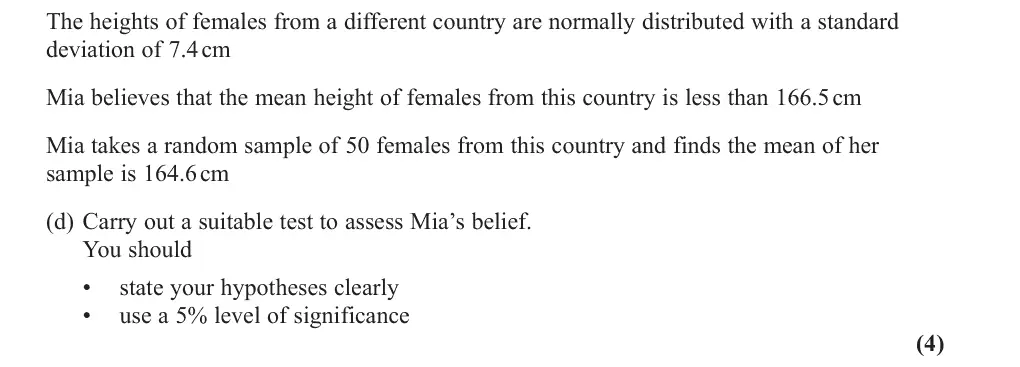
The heights of females from a different country are normally distributed with a standard deviation of 7.4 cm Mia believes that the mean height of females from this country is less than 166.5 cm Mia takes a random sample of 50 females from this country and finds the mean of her sample is 164.6 cm (d) Carry out a suitable test to assess Mia’s belief. You should • state your hypotheses clearly • use a 5% level of significance (4)
Oct 2021 · Paper 3 (Statistics) · Q6(a) 5 marks binomial distributionexponentials and logs
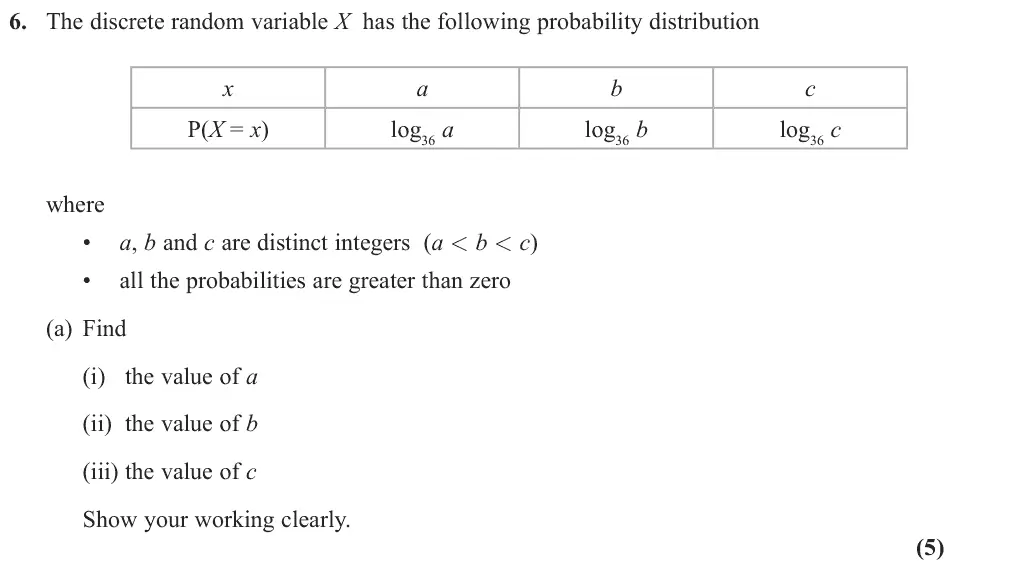
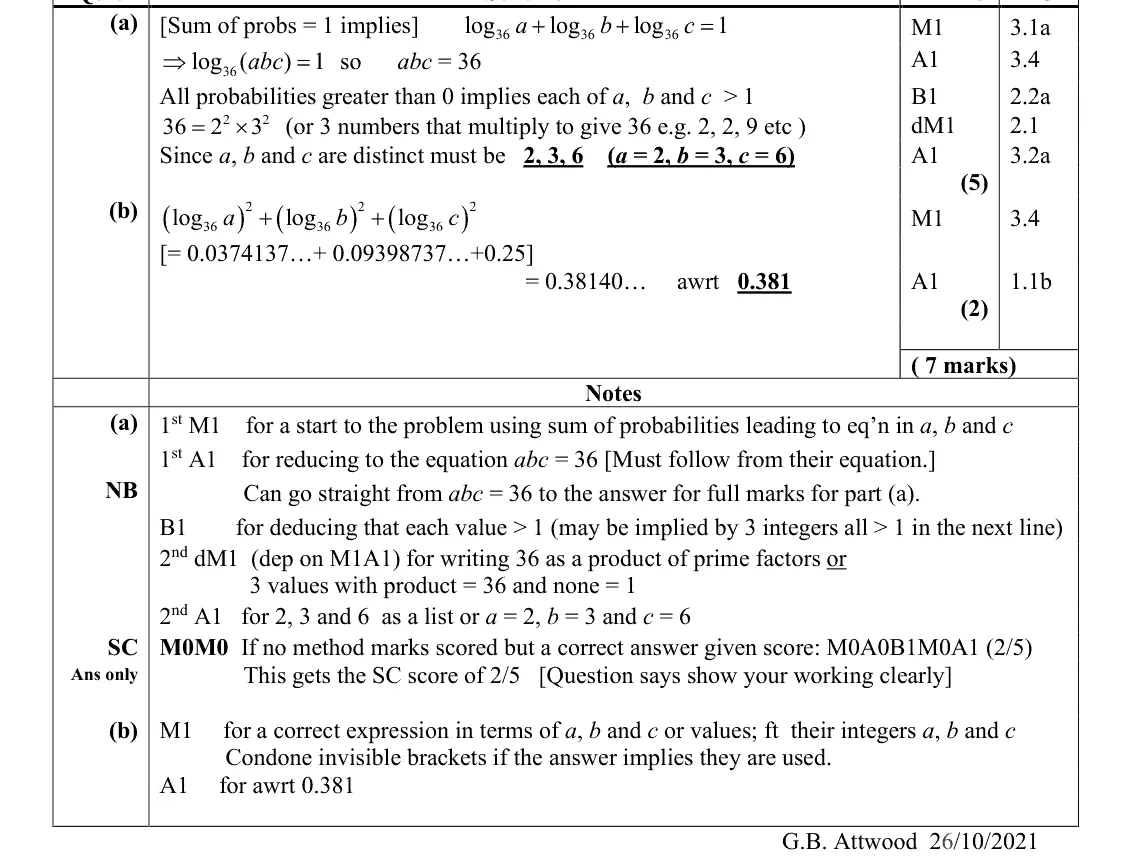
6. The discrete random variable X has the following probability distribution x a b c P(X = x) log36 a log36 b log36 c where • a, b and c are distinct integers (a < b < c) • all the probabilities are greater than zero (a) Find (i) the value of a (ii) the value of b (iii) the value of c Show your working clearly. (5)
Oct 2021 · Paper 3 (Statistics) · Q6(b) 2 marks Hard binomial distributionprobabilityexponentials and logs
The independent random variables X1 and X2 each have the same distribution as X (b) Find P(X1 = X2) (2)

Find an Edexcel maths tutor

Want this paper marked and gone through with you? Message us.

Prefer email? Send an enquiry

If you are under 18, please include a parent's contact details. Enquiries go to enquiries@mathsaleveltutor.com and are deleted once handled.