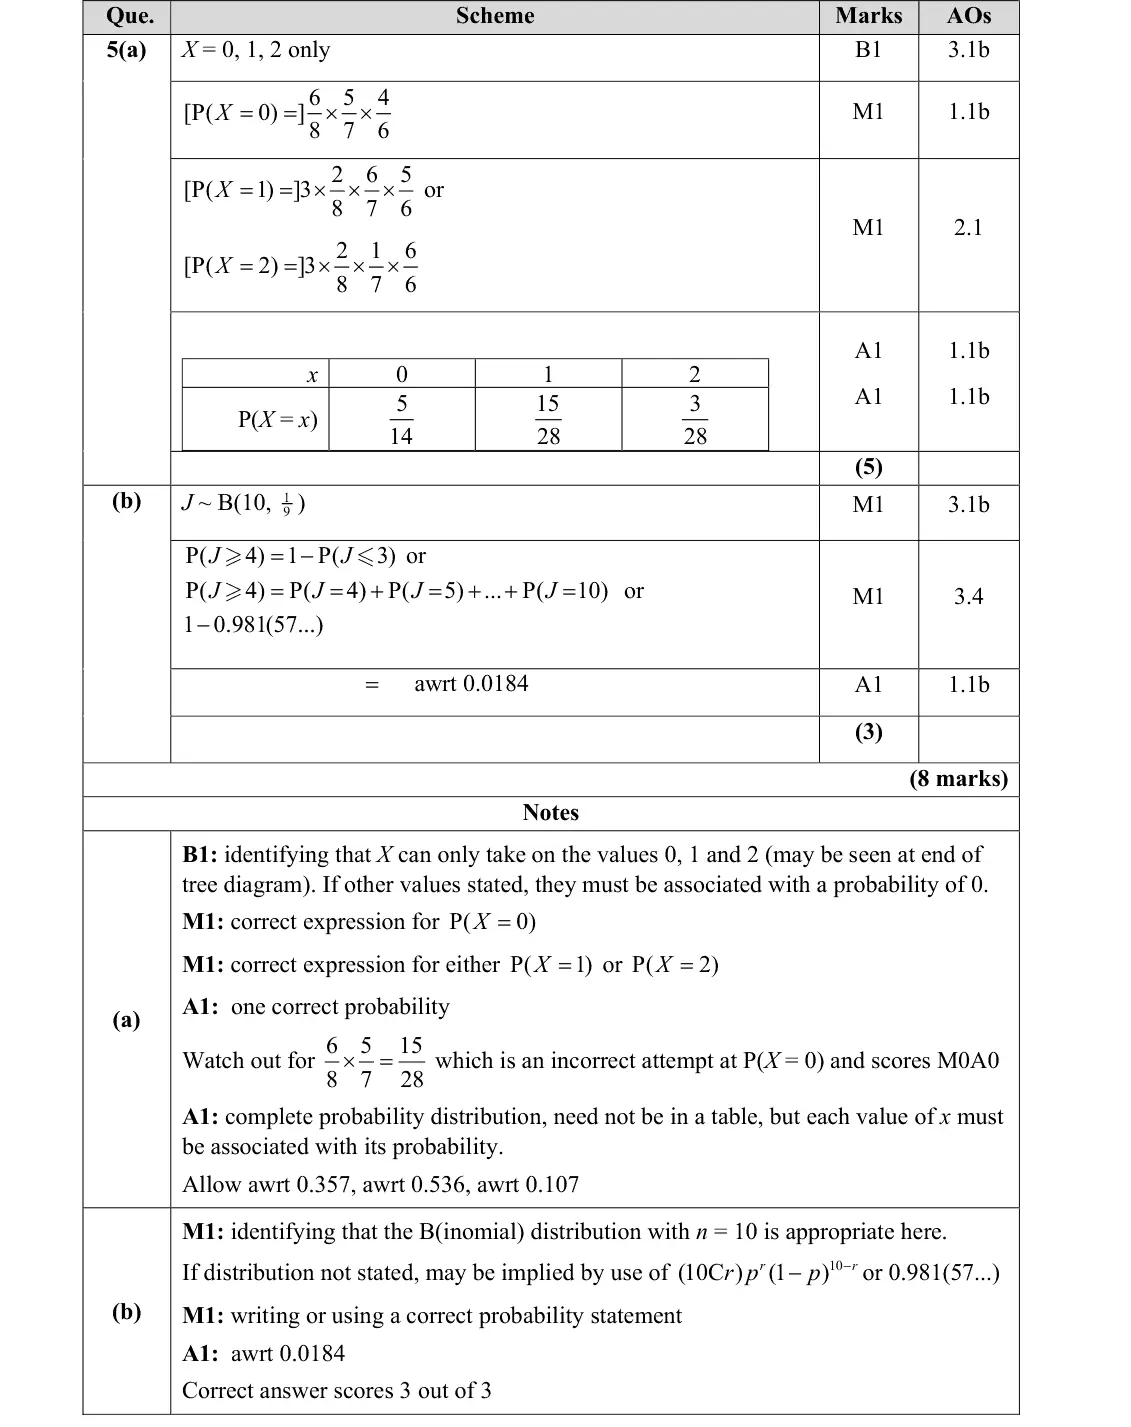
Understand and use mutually exclusive and independent events when calculating probabilities. Link to discrete and continuous distributions.
Guidance
Venn diagrams or tree diagrams may be used. Set notation to describe events may be used. Use of P(B|A) = P(B), P(A|B) = P(A), P(A ∩ B) = P(A)P(B) in connection with independent events. No formal knowledge of probability density functions is required, but students should understand that area under the curve represents probability in the case of a continuous distribution.
A-level only
set notation for events; P(B|A) = P(B), P(A|B) = P(A) for independent events
Mark scheme (whole question; this part is marked with the orange bar)
Examiner's comment
Students were very confident in answering part (a) with most arriving at the correct value of u.
Common mistakes
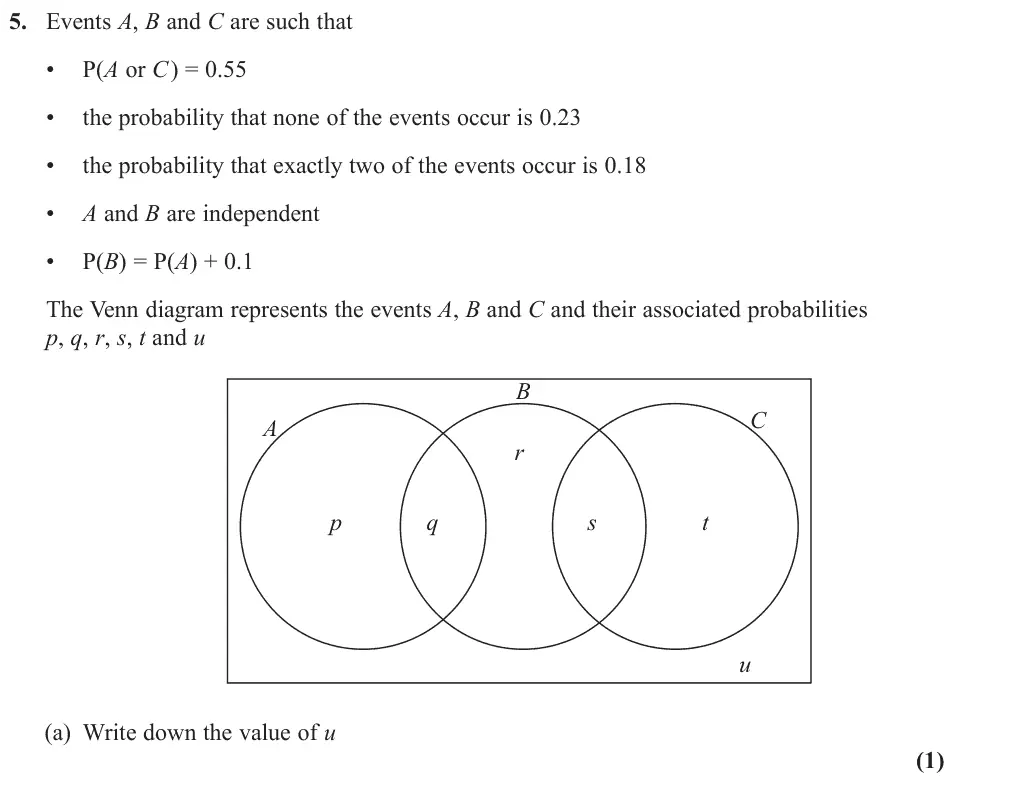
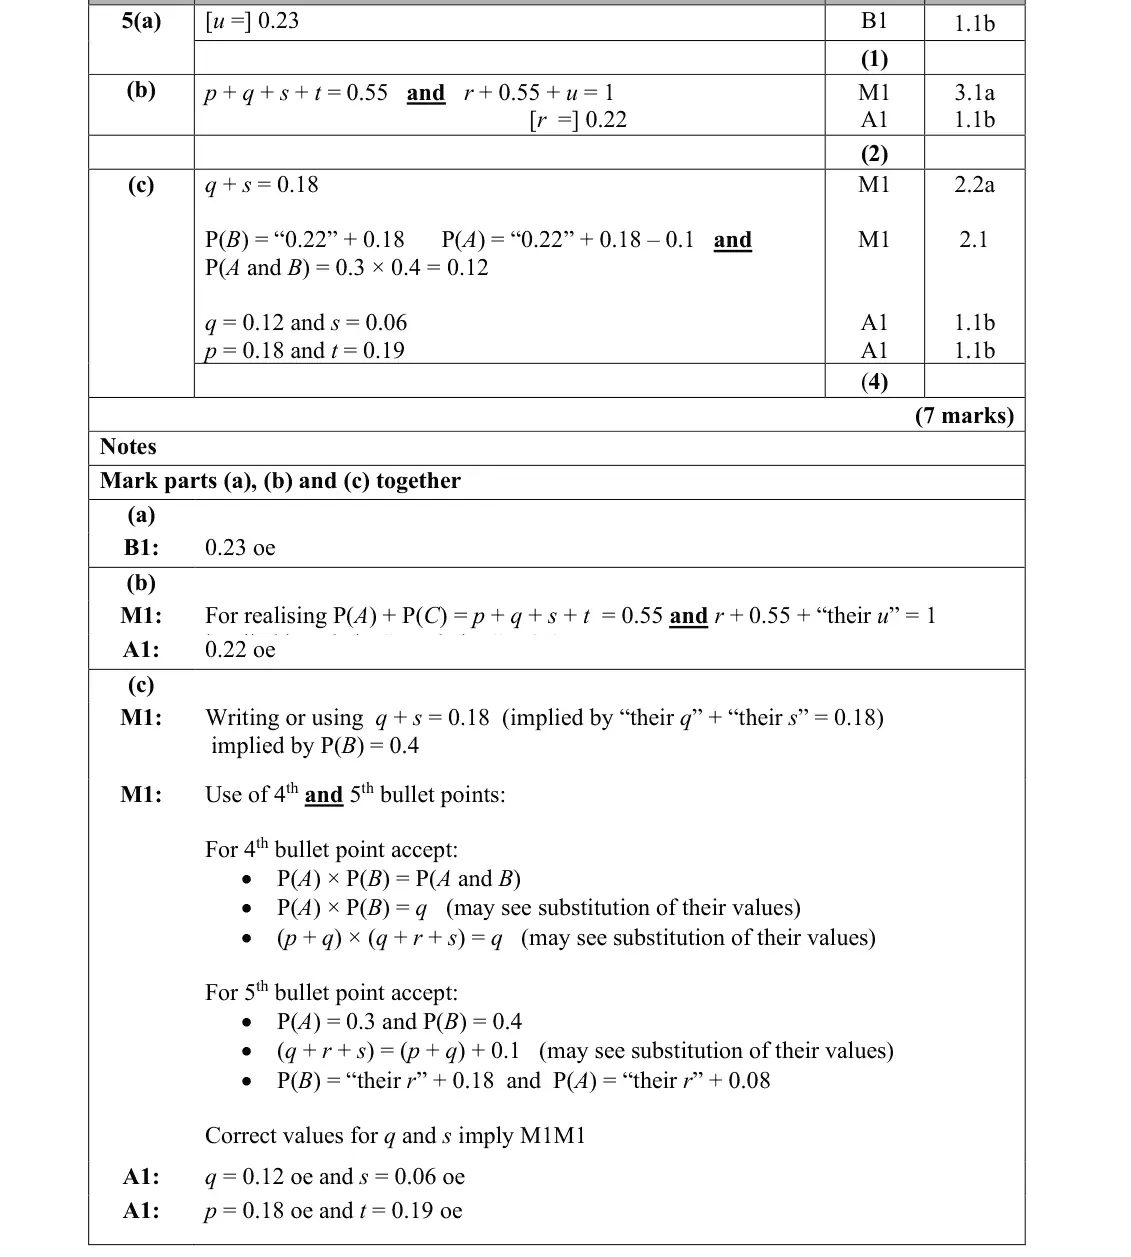
none of the events occur is the region outside all circles: u = 0.23
June 2025 · AS Paper 2 (Statistics) · Q5(b)2 marks
Mark scheme (whole question; this part is marked with the orange bar)
Examiner's comment
Those who understood that P(A or C) represented p + q + s + t were generally able to successfully calculate the value of r , with the majority of students scoring full marks in part (b).
Common mistakes
P(A or C) = p + q + s + t = 0.55, so r = 1 − 0.55 − 0.23 = 0.22
June 2025 · AS Paper 2 (Statistics) · Q5(c)4 marks
Mark scheme (whole question; this part is marked with the orange bar)
Examiner's comment
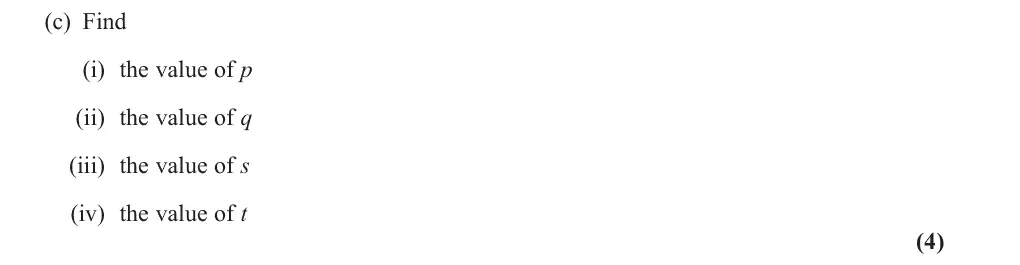
Those attempting part (c) often gained one of the two method marks available. More commonly this was for realising that q + s = 0.18. To score the second method mark, students needed to use two pieces of information and this proved difficult for many. Had students realised that numerical values could be substituted into their expressions at an early stage, they would have avoided pages of unnecessary algebraic expansion and simultaneous equations. This part proved to be one of the most discriminating parts of the entire paper.
Common mistakes
exactly two gives q + s = 0.18
P(B) = r + q + s = 0.4 so P(A) = 0.3
independence P(A and B) = 0.3 × 0.4 = 0.12 = q, s = 0.06, p = 0.18, t = 0.19
substitute numbers early to avoid long algebra
most discriminating part of the paper
June 2025 · Paper 3 (Statistics) · Q1(a)(i)2 marks
Mark scheme (whole question; this part is marked with the orange bar)
Examiner's comment
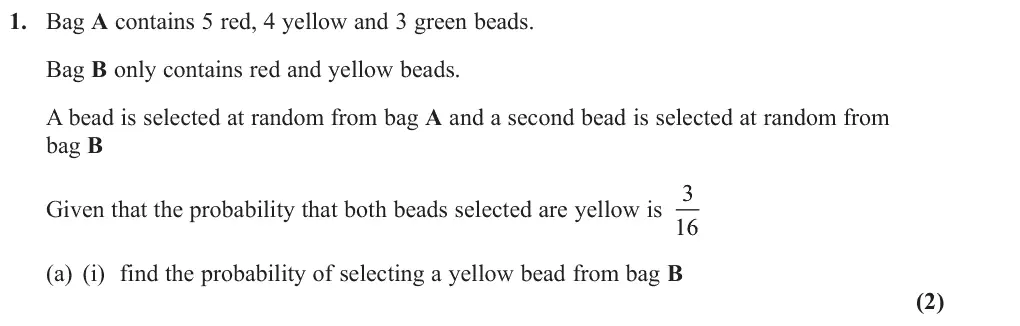
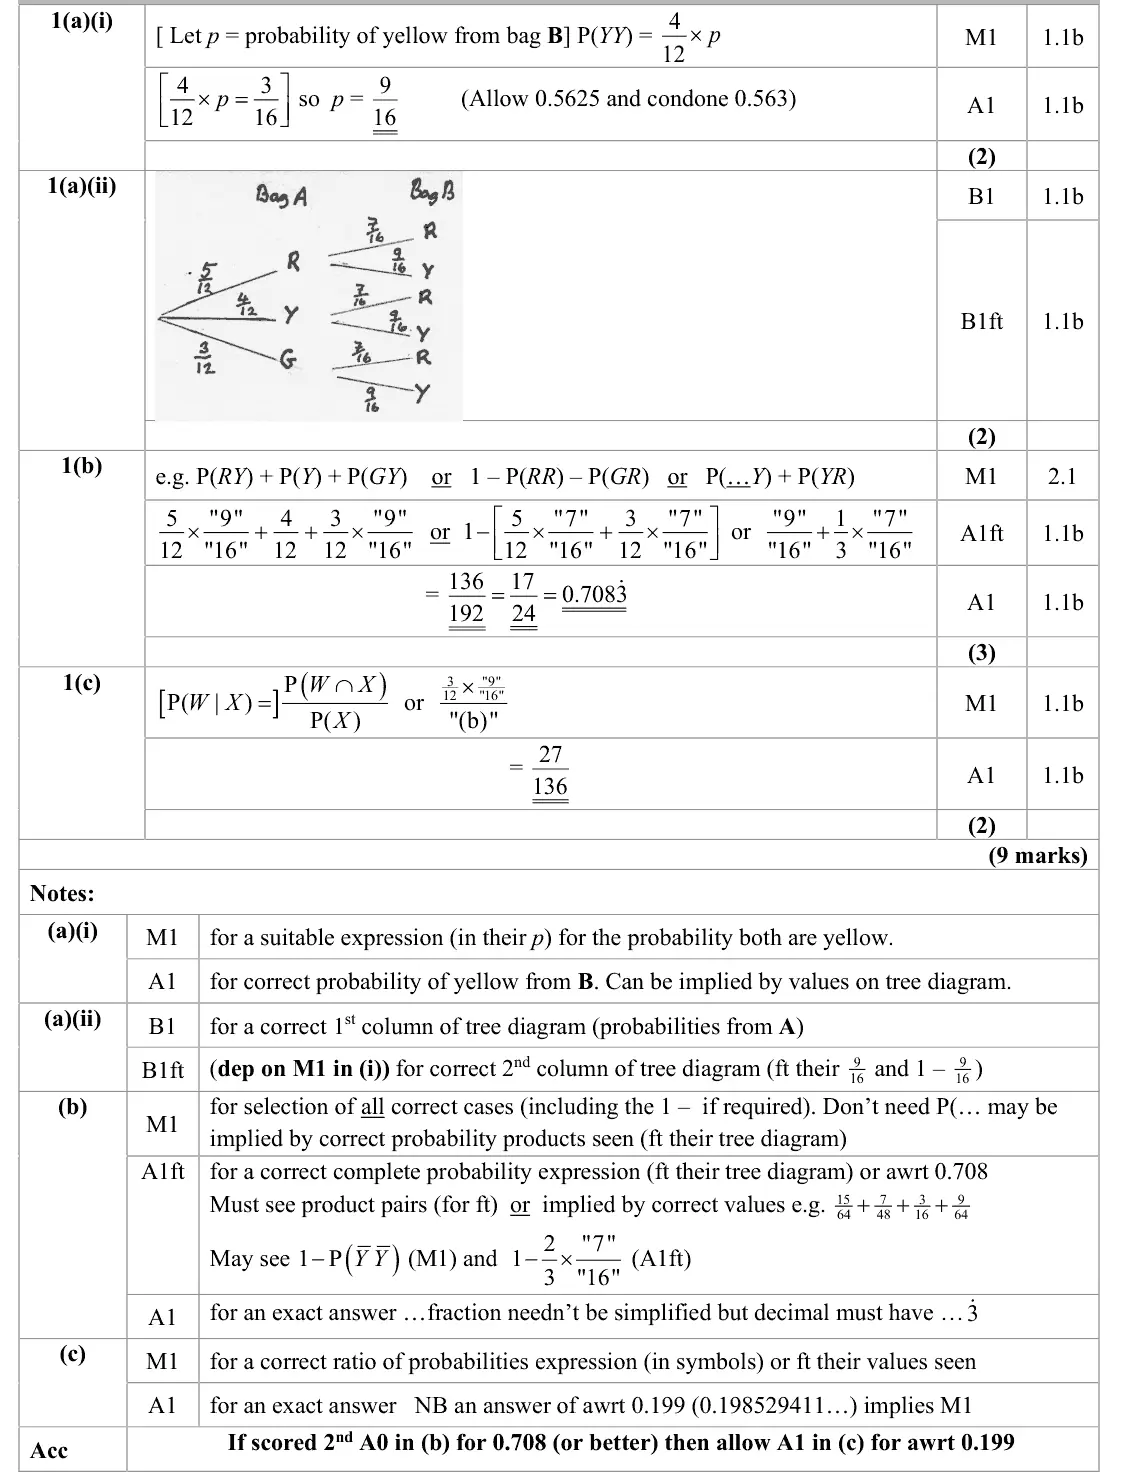
Most learners appeared comfortable working with tree diagrams and could find the probability of selecting a yellow bead from bag B correctly. A small minority wrote down a correct equation such as 4 3 but did not solve it correctly but the vast majority p x = 12 16 obtained p = 9 and were able to go on and complete the tree diagram correctly. A few 16 responses had different pairs of probabilities on the branches for bag B.
Common mistakes
independent selections: P(YY) = (4/12) × p = 3/16 so p = 9/16
June 2025 · Paper 3 (Statistics) · Q1(a)(ii)2 marks
Mark scheme (whole question; this part is marked with the orange bar)
Examiner's comment
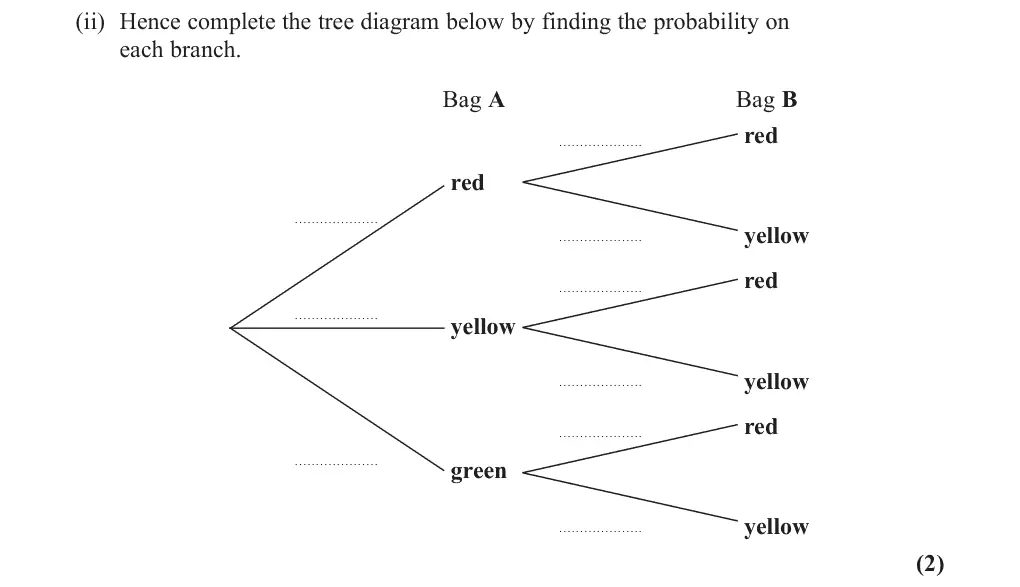
Most learners appeared comfortable working with tree diagrams and could find the probability of selecting a yellow bead from bag B correctly. A small minority wrote down a correct equation such as 4 3 but did not solve it correctly but the vast majority p x = 12 16 obtained p = 9 and were able to go on and complete the tree diagram correctly. A few 16 responses had different pairs of probabilities on the branches for bag B.
Common mistakes
bag A branches 5/12, 4/12, 3/12
bag B branches 7/16 (red) and 9/16 (yellow) on every pair
do not use different pairs of probabilities for bag B
June 2025 · Paper 3 (Statistics) · Q1(b)3 marks
Mark scheme (whole question; this part is marked with the orange bar)
Examiner's comment
Part (b) was usually answered well, but the most common error was to overlook the “at least” condition and omit the case for two yellows. The most popular approach was to identify the 4 2 7 ( ) and some used cases from the tree diagram but a few used 1 P 1 Y Y - = - x 3 16 ( ) ( ) 1 P P RR GR - - . Few responses did not present their answers in (b) and (c) as exact fractions as required. (b) or 9 appearing in both the numerator and denominator and leading to an incorrect 16 answer of 1 . 4
Common mistakes
"at least one" includes YY: P(RY) + P(Y from A) + P(GY) or 1 − P(RR) − P(GR)
exact answer 17/24
June 2025 · Paper 3 (Statistics) · Q5(c)3 marks
Mark scheme (whole question; this part is marked with the orange bar)
Examiner's comment
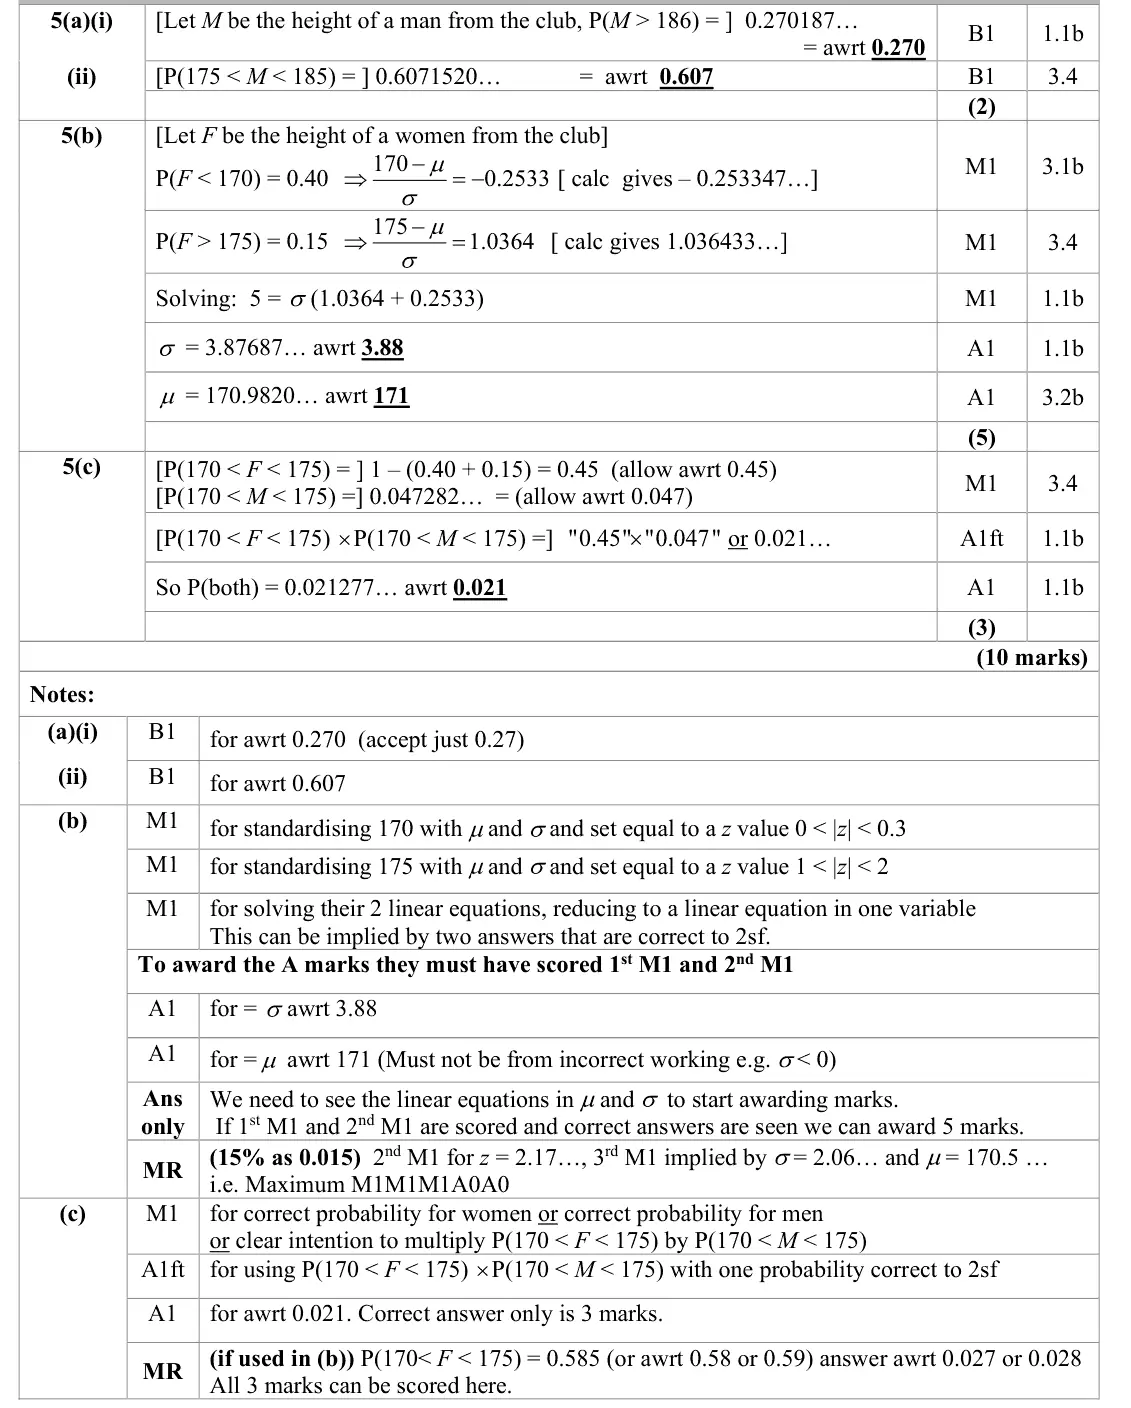
This question was answered very well. Most knew how to use their calculators to answer part variables and in part (i) calculated P(𝑀𝑀⩾187) whilst others incorrectly applied a continuity (a) though some didn’t appreciate the difference between discrete and continuous random correction. Part (c) was completed successfully by many learners though many used their calculated mean and standard deviation from part (b) to calculate P(170 < F < 175) rather than using the
Common mistakes
P(170 < F < 175) = 1 − (0.40 + 0.15) = 0.45 directly from the given percentages
multiply (independent), do not add
0.45 × 0.0473 = 0.021
June 2024 · AS Paper 2 (Statistics) · Q5(b)2 marks
Mark scheme (whole question; this part is marked with the orange bar)
Examiner's comment
Part (a) and part (b) was generally done well by the vast majority of students. A large number of students overcomplicated their workings by calculating probabilities for all 9 possibilities rather than simply calculating P(𝑛𝑜𝑡 7) x P(𝑛𝑜𝑡 7) x P(7). Many students still do not understand the concept of a probability distribution and many attempts were made to calculate a single probability, usually from a binomial distribution, in
Common mistakes
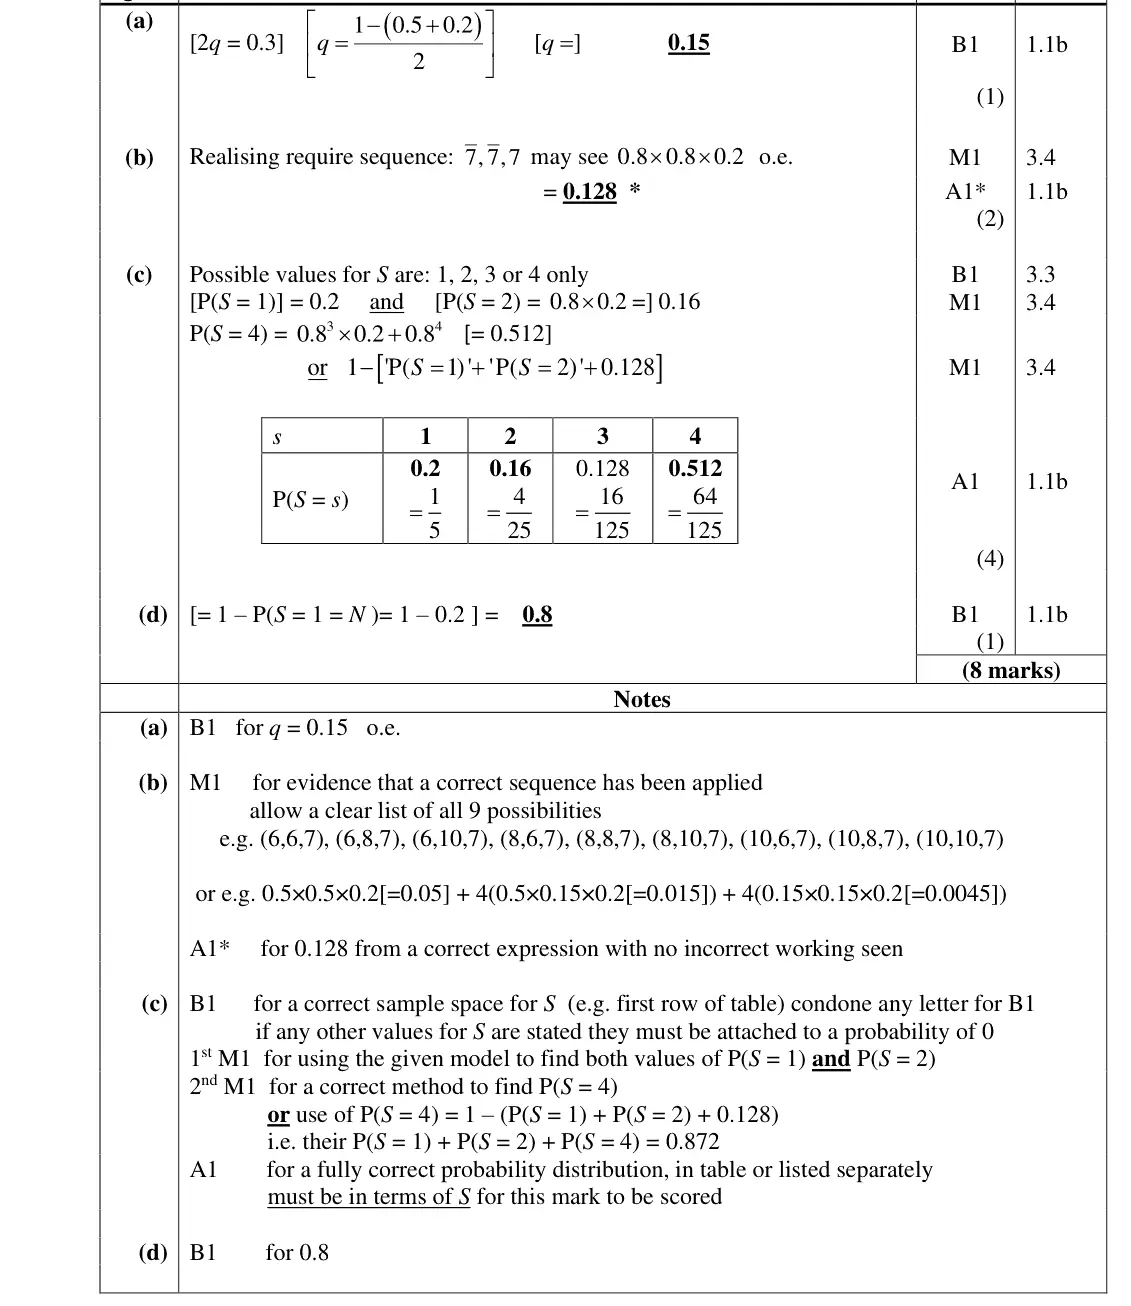
stops after the 3rd spin means not 7, not 7, then 7: 0.8 × 0.8 × 0.2 = 0.128
listing all nine sequences is unnecessary
June 2024 · AS Paper 2 (Statistics) · Q5(c)4 marks
Mark scheme (whole question; this part is marked with the orange bar)
Examiner's comment
The final question on the paper, as expected, proved to be the most demanding and parts (c) and (d) were only completed by the most able students. part (c). Some students were able to make a good attempt at the probability distribution, but a large number failed to correctly calculate P(𝑆= 4) as they didn't account for the spinner failing to land on a 7 four times. Most students left out part (d) as they were unable to interpret what this probability
Common mistakes
S takes values 1, 2, 3, 4 only
P(S = 1) = 0.2, P(S = 2) = 0.16, P(S = 3) = 0.128, P(S = 4) = 0.8³ = 0.512 (she stops after 4 spins whether or not she gets a 7)
P(S = 4) = 0.8³ × 0.2 alone is the common error
trying a binomial
June 2024 · AS Paper 2 (Statistics) · Q5(d)1 mark
Mark scheme (whole question; this part is marked with the orange bar)
Examiner's comment
and (d) were only completed by the most able students. Most students left out part (d) as they were unable to interpret what this probability represented. Of those who did try, many complicated probability expressions were seen often leading to an incorrect answer.
Common mistakes
S > N unless she gets a 7 on the first spin (S = N = 1): 1 − 0.2 = 0.8
most omitted or overcomplicated this
June 2024 · Paper 3 (Statistics) · Q5(b)1 mark
Mark scheme (whole question; this part is marked with the orange bar)
Examiner's comment
Part (a) was answered very well by most students and in part (b) a good proportion also recognised the need for the events to be independent. Some students failed to score the mark in part (b) because they did not use correct mathematical language: we saw comments such as “they are not affected by each other” or “the events are not mutually exclusive” and a few simply said “it is continuous data” or “they must take part in both events”. Many students answered part (c) successfully, but some made errors when trying to find P(T < 300) either by
Common mistakes
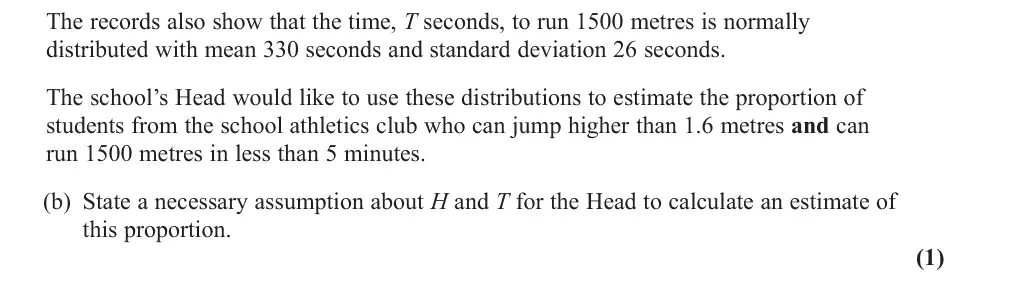
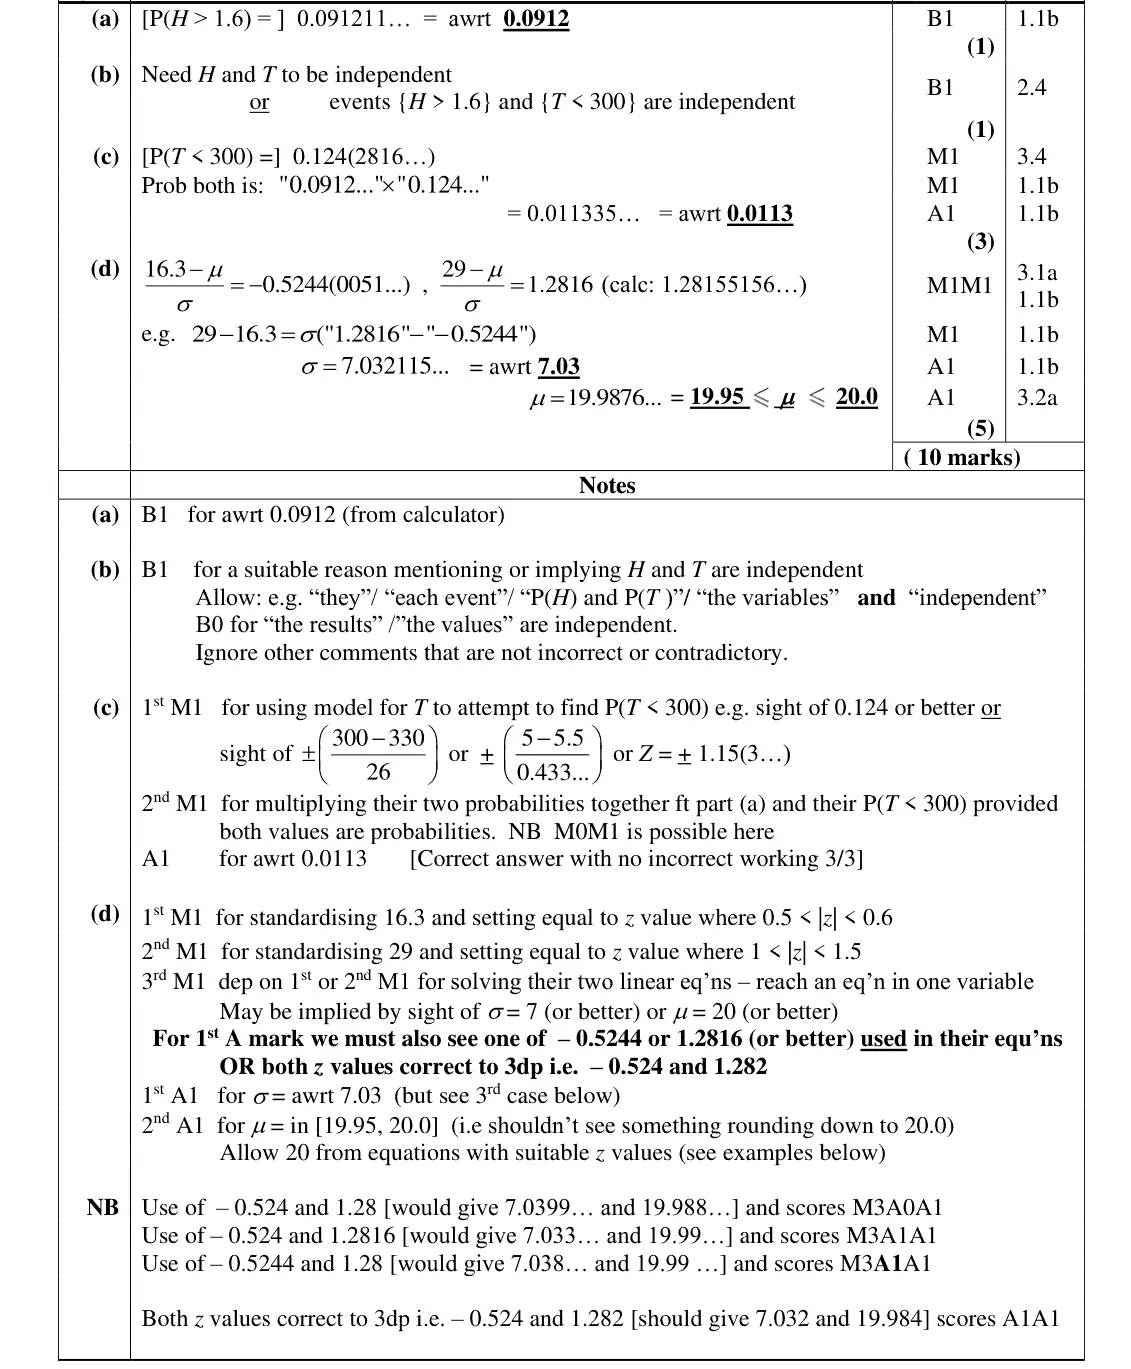
H and T (or the two events) must be independent
"not mutually exclusive", "not affected by each other" or "the results are independent" not accepted
June 2024 · Paper 3 (Statistics) · Q5(c)3 marks
Mark scheme (whole question; this part is marked with the orange bar)
Examiner's comment
answered part (c) successfully, but some made errors when trying to find P(T < 300) either by using a continuity correction and finding P(T < 299.5) or failing to convert minutes to seconds and trying to find P(T < 5). There were many good attempts at part (d). Most students could start the problem and write
Common mistakes
5 minutes = 300 s
P(T < 300) = 0.124 (no continuity correction)
multiply by 0.0912 to get 0.0113
June 2024 · Paper 3 (Statistics) · Q6(a)1 mark
Mark scheme (whole question; this part is marked with the orange bar)
Examiner's comment
Part (a) was answered very well with many giving all 3 pairs which was fine provided they were all correct. Part (b) was answered well too with most successfully finding p = 0.13 although a event which was unfortunate as they had usually not made this mistake in part (a).
Common mistakes
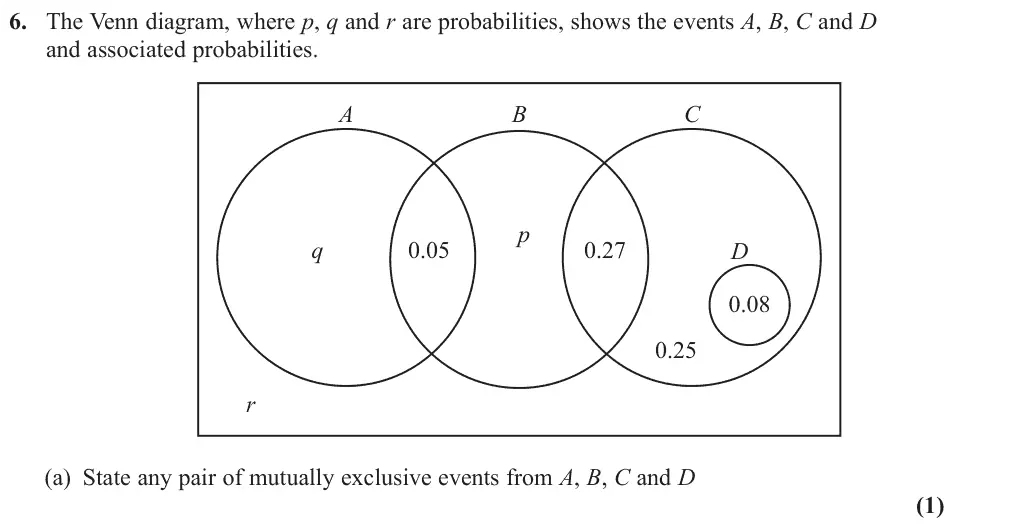
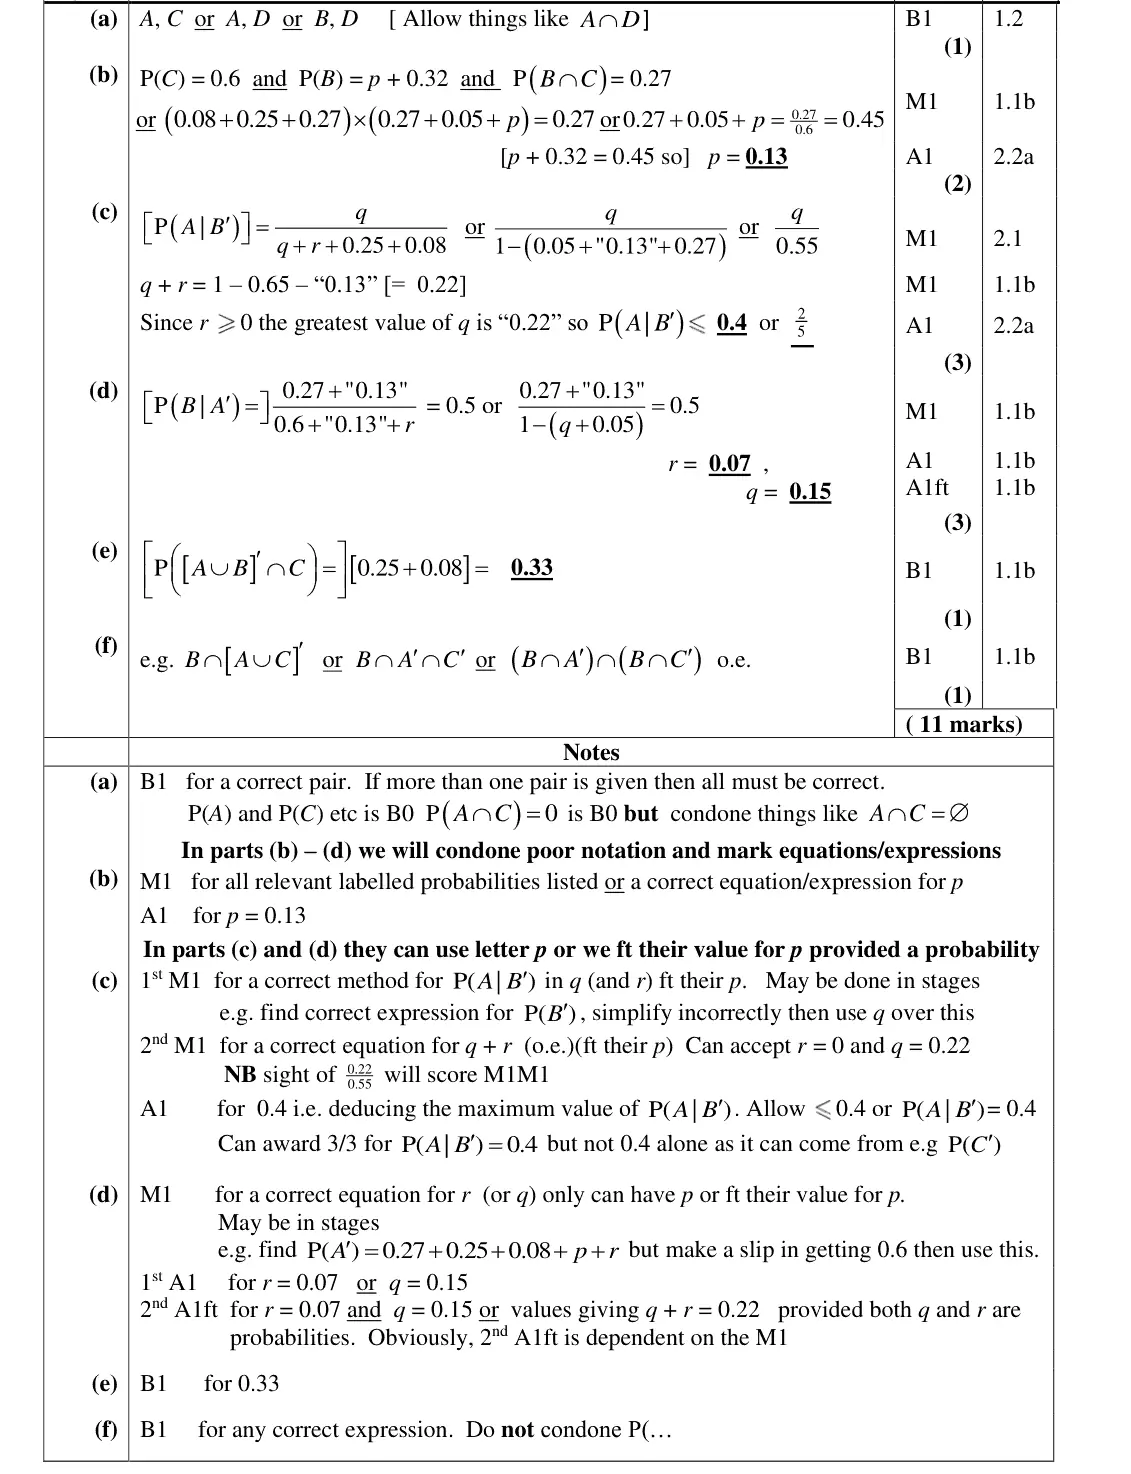
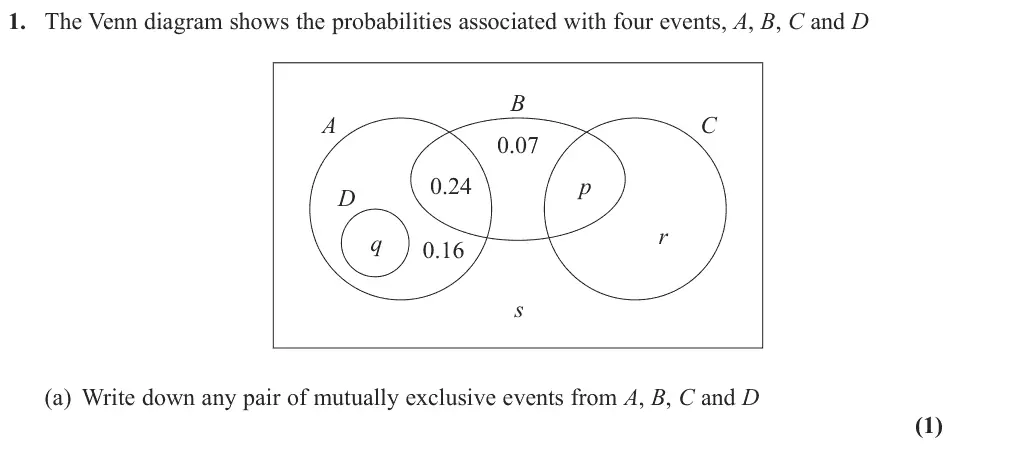
A and C, A and D, or B and D (all pairs given must be correct)
not P(A) and P(C)
June 2024 · Paper 3 (Statistics) · Q6(b)2 marks
Mark scheme (whole question; this part is marked with the orange bar)
Examiner's comment
all correct. Part (b) was answered well too with most successfully finding p = 0.13 although a few students omitted the 0.08 from P(C). Part (c) proved more discriminating. Whilst many
Common mistakes
independence: P(B ∩ C) = P(B)P(C) so 0.27 = 0.6(p + 0.32), p = 0.13
include 0.08 in P(C)
June 2024 · Paper 3 (Statistics) · Q6(e)1 mark
Mark scheme (whole question; this part is marked with the orange bar)
Examiner's comment
0.4 r = 0.5 common to see leading to the correct values for r and q. When part (e) was + 0.73 attempted, it was usually correct however a few students multiplied 0.25 and 0.08 instead of adding them. Part (f) proved to be one of the most discriminating parts of the paper. There were
Common mistakes
region in C outside A and B: 0.25 + 0.08 = 0.33 (add, not multiply)
June 2024 · Paper 3 (Statistics) · Q6(f)1 mark
Mark scheme (whole question; this part is marked with the orange bar)
Examiner's comment
adding them. Part (f) proved to be one of the most discriminating parts of the paper. There were many blank responses, and some simply gave an answer of p = 0.13. Some though could find the correct region but gave the answer as a probability e.g. ( ) P B A C rather than an event which was unfortunate as they had usually not made this mistake in part (a).
Common mistakes
B ∩ (A ∪ C)′ or B ∩ A′ ∩ C′
write an event, not a probability P(...) or "p = 0.13"
June 2023 · AS Paper 2 (Statistics) · Q3(a)2 marks
Mark scheme (whole question; this part is marked with the orange bar)
Examiner's comment
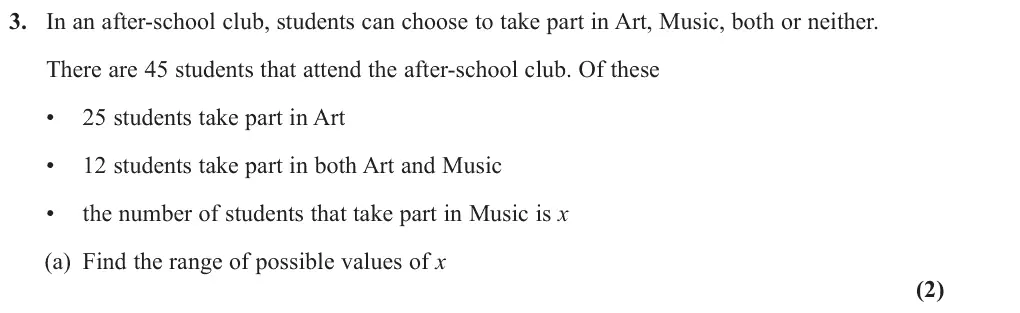
This was the second most demanding question on the paper. In this question there was some confusion between the number of students who study Art and the number of students who study Art but not Music. This often led to incorrect Venn diagrams and subsequent errors in both parts of the question. In part (a), students often found that at most 20 students studied Music but not Art, but then went no further. Very few were able to find both required end-points.
Common mistakes
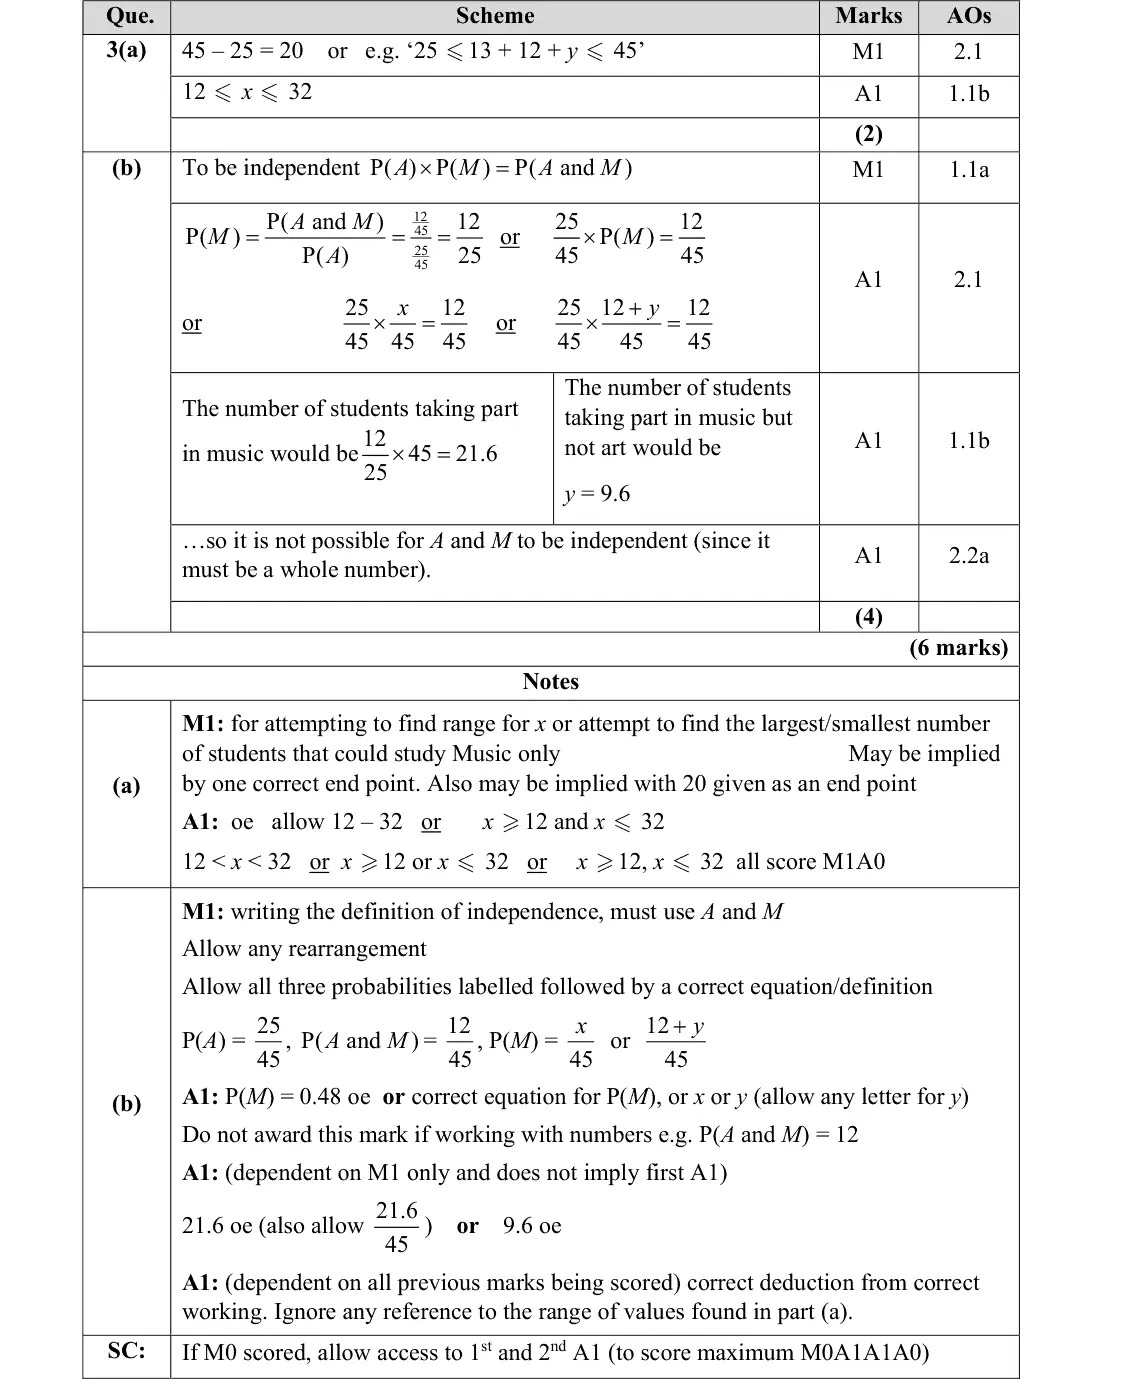
Venn reasoning: smallest x = 12 (all in both), largest 12 + (45 − 25) = 32
answer 12 ≤ x ≤ 32 with "and" (strict or "or" loses the A mark)
confusion between Art and Art-but-not-Music
June 2023 · AS Paper 2 (Statistics) · Q3(b)4 marks
Mark scheme (whole question; this part is marked with the orange bar)
Examiner's comment
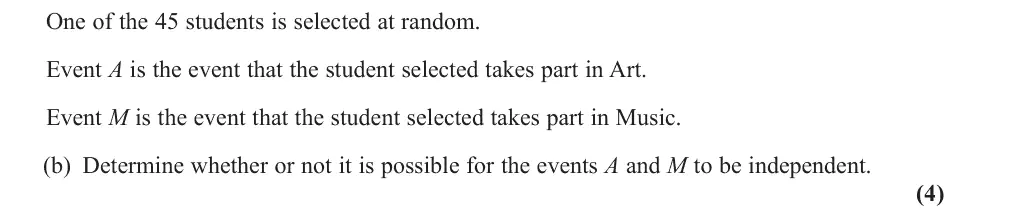
This was the second most demanding question on the paper. In this question there was some confusion between the number of students who study Art and the number of students who study Art but not Music. This often led to incorrect Venn diagrams and subsequent errors in both parts of the question. The rule for independence is given to students on the formulae booklet, but many quoted it in terms of A and B rather than the events A and M as required in part (b) of this question. Students making little progress often tended to use numbers rather than probabilities throughout. Only a small minority arrived at the correct result of x = 21.6, but some then concluded that A and M were independent as 21.6 was in the range, ignoring the fact that x had to be an integer in this context.
Common mistakes
P(A) × P(M) = P(A and M) written with A and M (not A and B)
P(M) = 0.48 gives x = 21.6 (or 9.6 Music only)
not an integer, so not possible
working with numbers instead of probabilities
concluding independent because 21.6 is in the range from (a)
June 2023 · AS Paper 2 (Statistics) · Q5(a)5 marks
Mark scheme (whole question; this part is marked with the orange bar)
Examiner's comment
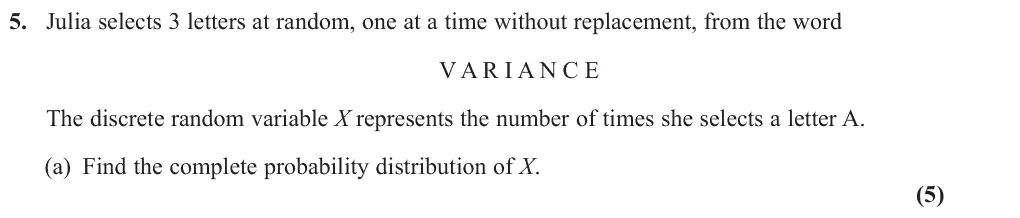
The final question on the paper, as expected, proved to be the most demanding as many students were unable to make any progress at all here. Part (a) was the most discriminating with many students leaving this part blank. Students often thought that X followed a binomial distribution. Some tried to work out individual probabilities for each letter rather than focusing on the number of A’s that could be selected. A large number of tree diagrams were seen but some could not get from the diagram to a probability distribution as they were unable to give a probability for each of the different values of X. Students who correctly worked out the probability of obtaining 1 or 2 A's sometimes did not recognise that the answer needed multiplying by 3.
multiply by 3 for the arrangements (often forgotten)
X is not binomial
June 2023 · Paper 3 (Statistics) · Q1(a)1 mark
Mark scheme (whole question; this part is marked with the orange bar)
Examiner's comment
This proved to be a positive and accessible start to the paper. Part (a) was nearly always correct and most knew how to write down a suitable expression for independence for part (b) which usually resulted in a correct equation for p. Those
Common mistakes
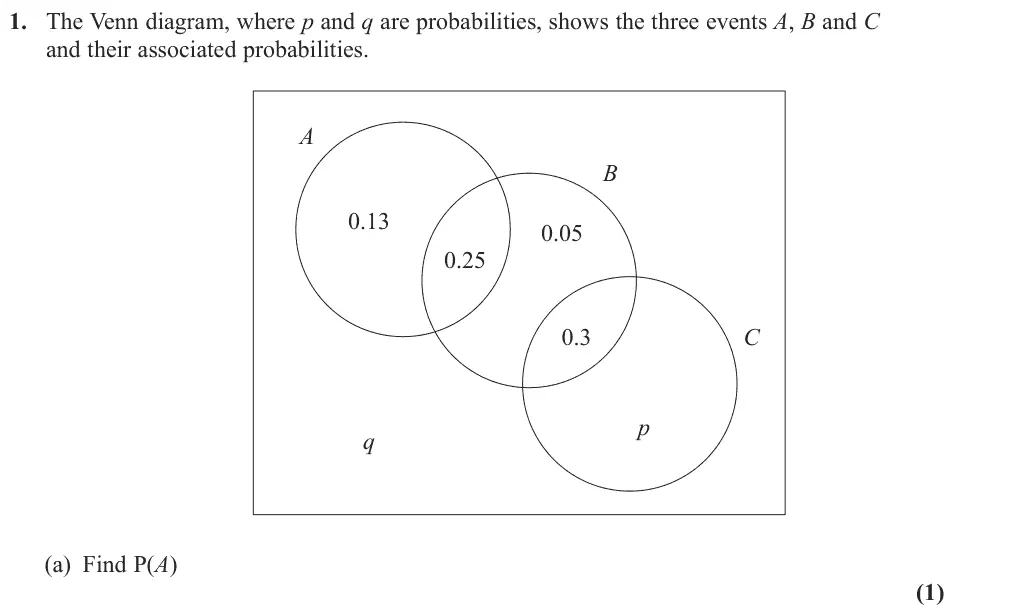
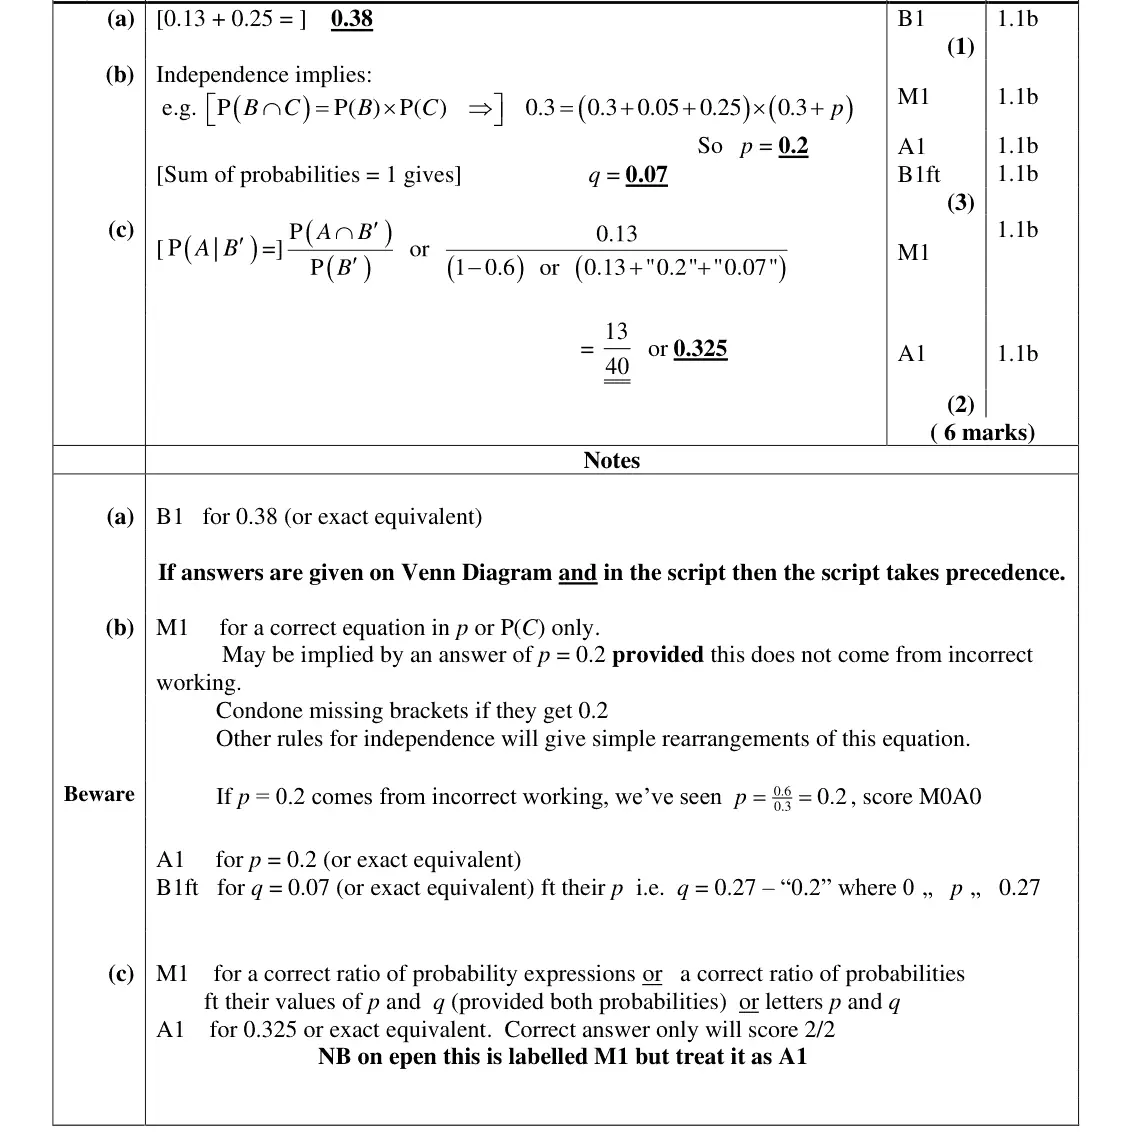
add the two regions of A: 0.13 + 0.25 = 0.38
script answer takes precedence over the Venn diagram
June 2023 · Paper 3 (Statistics) · Q1(b)3 marks
Mark scheme (whole question; this part is marked with the orange bar)
Examiner's comment
This proved to be a positive and accessible start to the paper. for independence for part (b) which usually resulted in a correct equation for p. Those that didn’t achieve this often thought that P(C) = 0.3 or 0.3p or even just p. Solving for p was mostly completed correctly and even those who had an incorrect value for p could often score the follow through for q provided their p + q = 0.27
Common mistakes
P(B ∩ C) = P(B) × P(C) gives 0.3 = 0.6(0.3 + p) so p = 0.2
P(C) is not 0.3 or p
q = 0.27 − p from total probability 1
June 2023 · Paper 3 (Statistics) · Q6(e)(ii)2 marks
Mark scheme (whole question; this part is marked with the orange bar)
Examiner's comment
This question also proved to be quite challenging.
Common mistakes
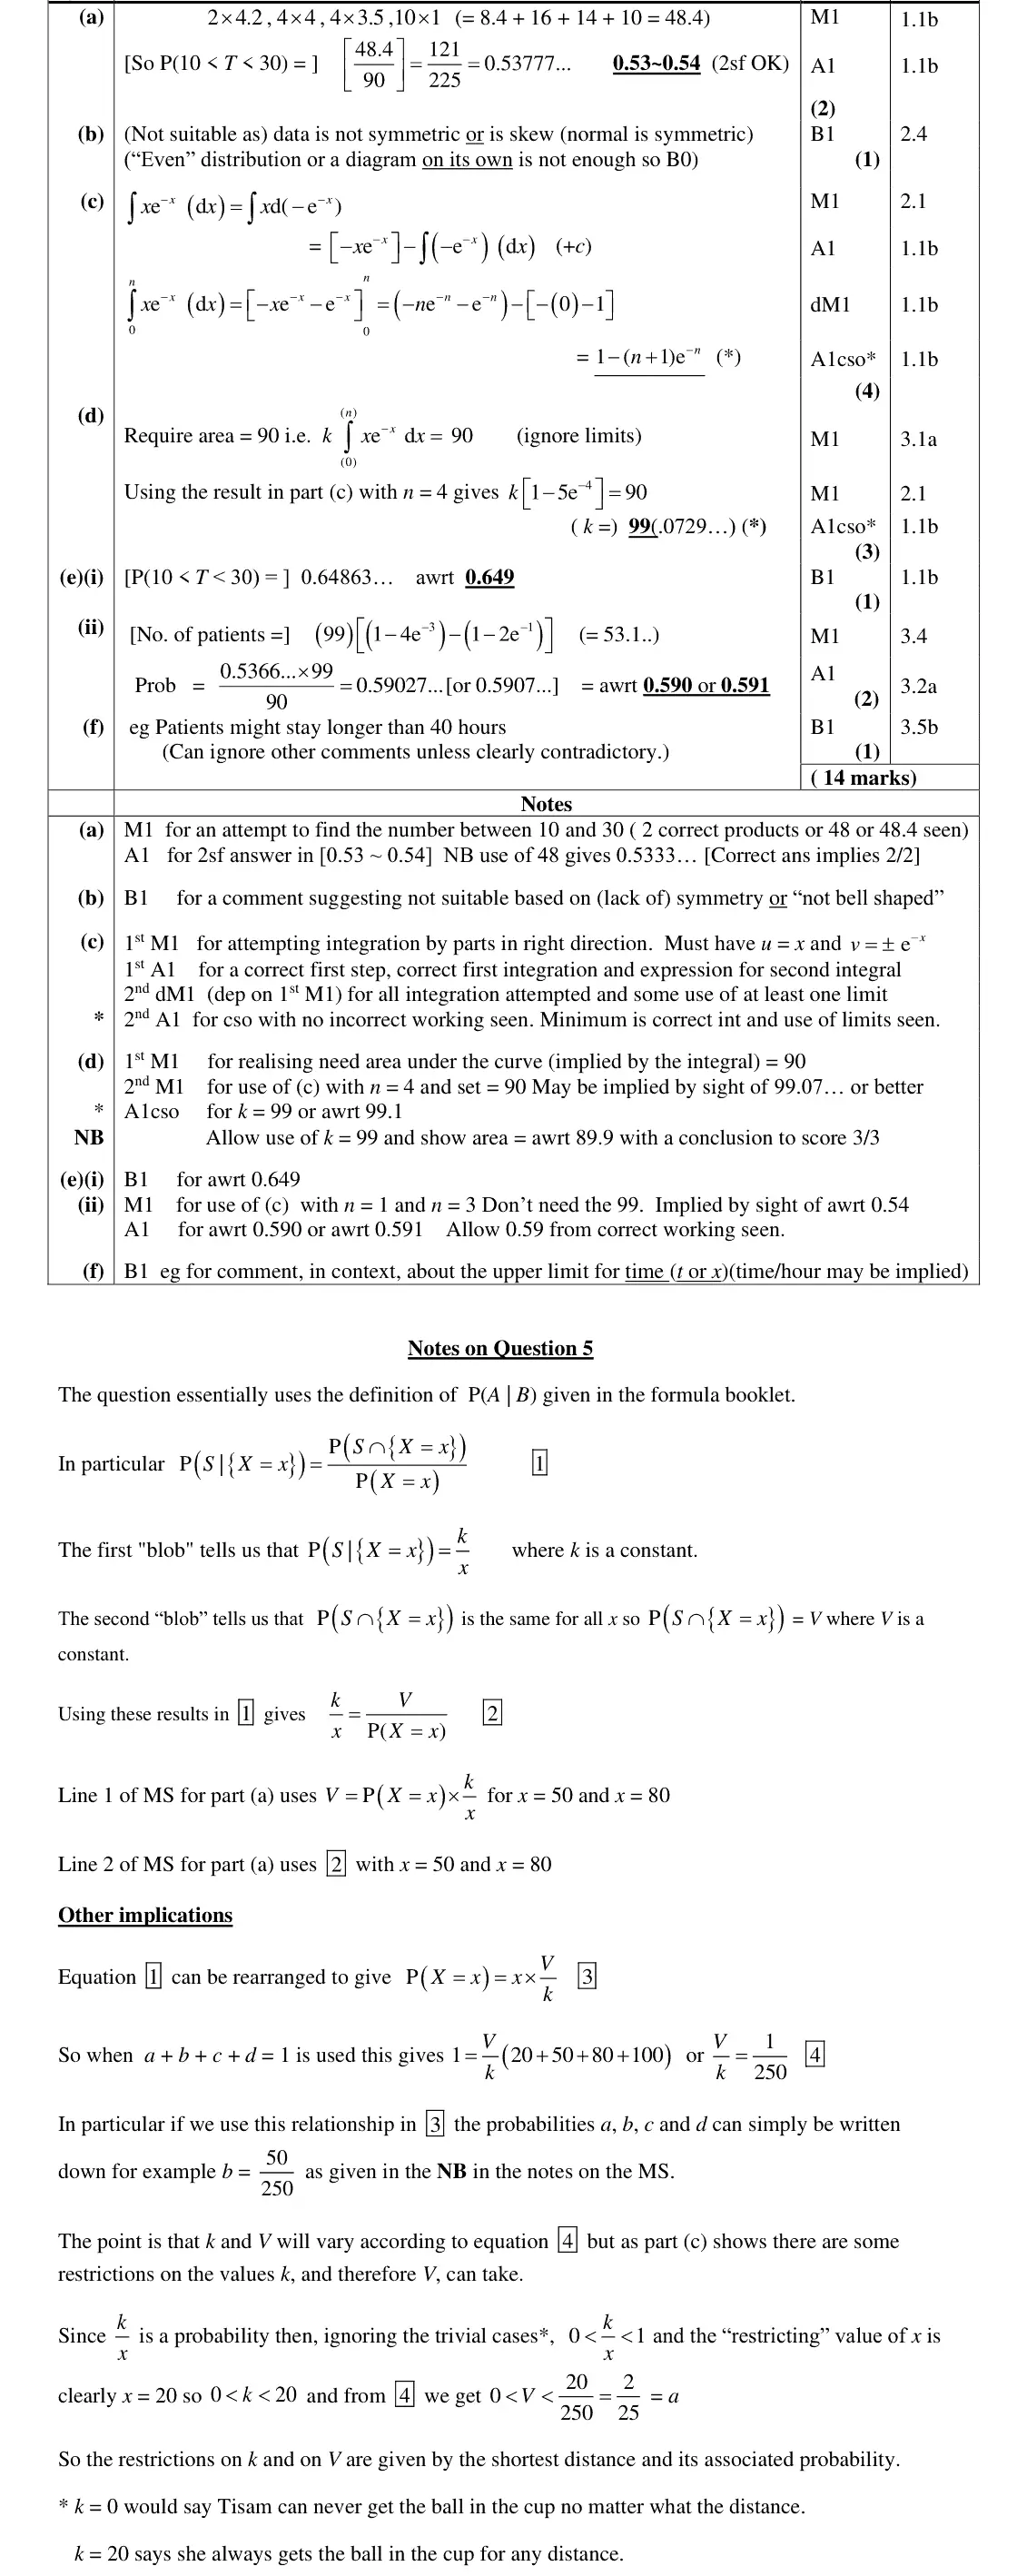
use (c) with n = 3 and n = 1 (not 30 and 10) to get 53.1 patients, then divide by 90 for the probability 0.590
June 2022 · AS Paper 2 (Statistics) · Q5(a)3 marks
Mark scheme (whole question; this part is marked with the orange bar)
Examiner's comment
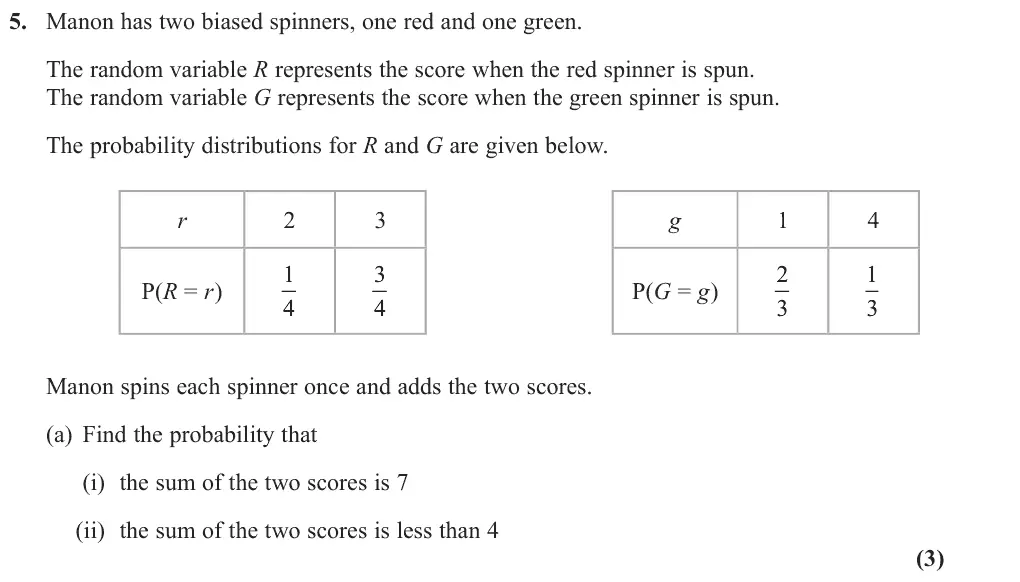
Part (a) was answered well by most candidates but often there was little explanation offered to explain where their probabilities came from, nevertheless the correct answers to (i) and (ii) were + but they had at often seen. Some thought that, for example, in (i) the answer should be 3 3 1 1 4 3 3 4 least realised that the red spinner must have landed on 3 and the green spinner on 4 and scored the first mark. Part (b) was designed as a problem solving question and it was good to see a number of
Common mistakes
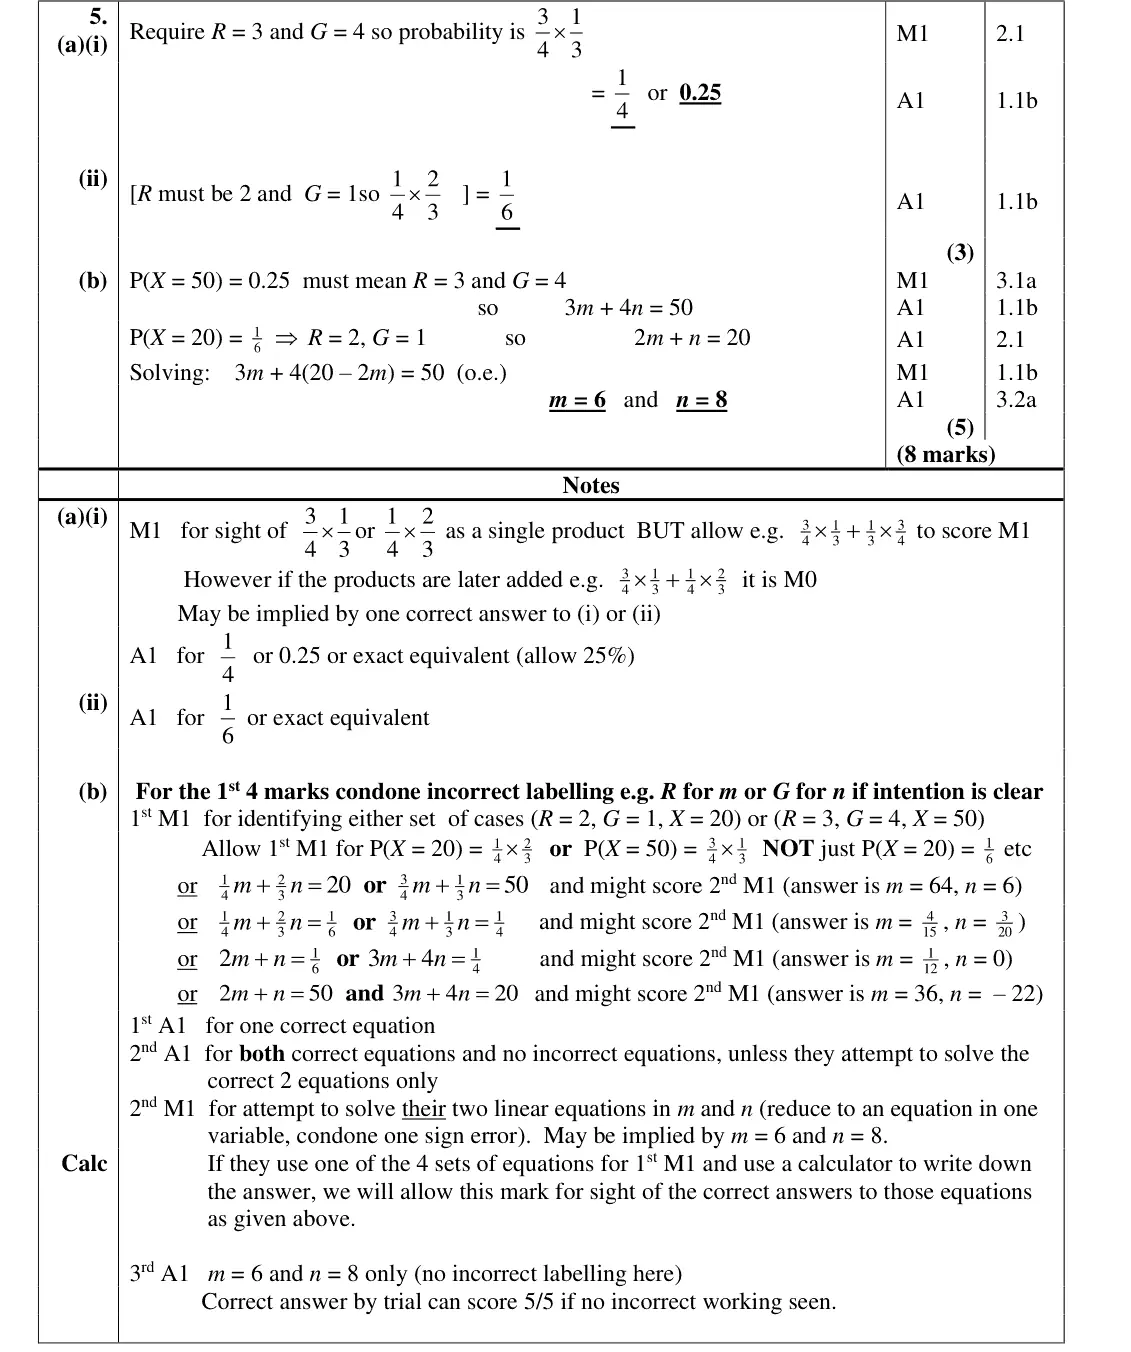
sum 7 needs R = 3 and G = 4: ¾ × ⅓ = ¼
less than 4 needs R = 2, G = 1: ¼ × ⅔ = 1/6
do not add products of other cases
June 2022 · AS Paper 2 (Statistics) · Q5(b)5 marksMedium
Mark scheme (whole question; this part is marked with the orange bar)
Examiner's comment
first mark. Part (b) was designed as a problem solving question and it was good to see a number of students trying it though understandable that many felt there were easier pickings available in paper 22 and moved onto that. Most attempts involved setting up two linear equations and solving them but there was some confusion over values of the random variables and probabilities associated with these values. However over 10% of candidates scored full marks on this question and shoed a good understanding of this topic.
Common mistakes
P(X = 50) = ¼ means R = 3, G = 4 so 3m + 4n = 50
P(X = 20) = 1/6 means R = 2, G = 1 so 2m + n = 20
m = 6, n = 8
confusion between values of X and probabilities (e.g. ¼m + ⅔n = 20)
June 2022 · Paper 3 (Statistics) · Q5(a)1 mark
Mark scheme (whole question; this part is marked with the orange bar)
Examiner's comment
Part (a) was well answered with most students able to gain the mark for a correct answer. A simplified fraction or the correct decimal value was often seen. Whilst the majority of students continued to score well in part (b) the most common
Common mistakes
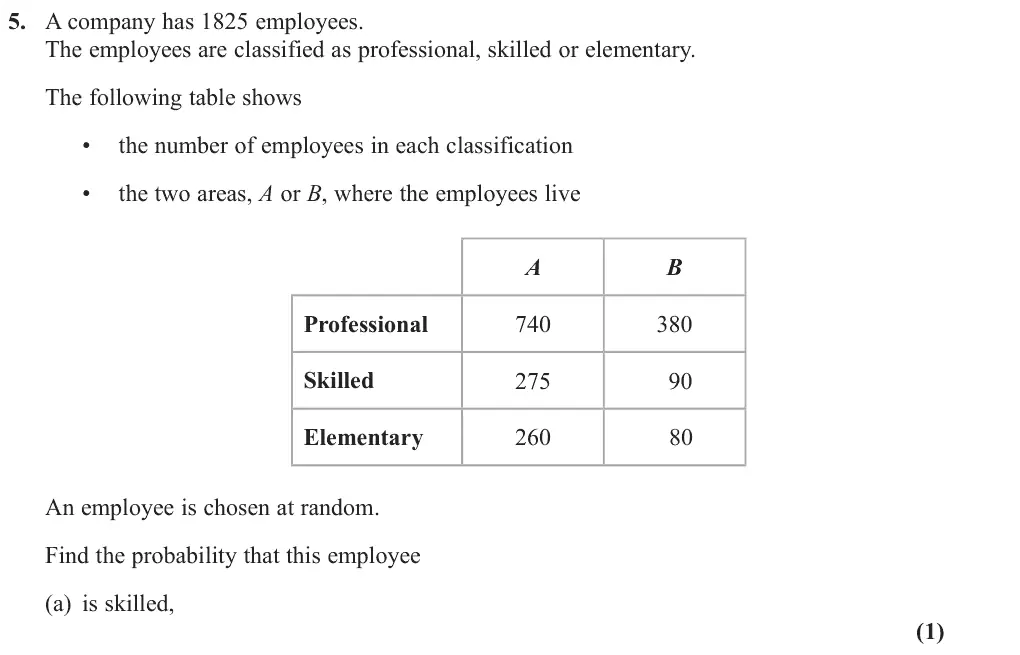
365/1825 = 1/5
June 2022 · Paper 3 (Statistics) · Q5(b)1 mark
Mark scheme (whole question; this part is marked with the orange bar)
Examiner's comment
Whilst the majority of students continued to score well in part (b) the most common incorrect answer came from students who thought the question was conditional, giving 170 550 , i.e. the probability of not being a professional given they live in area B. Some students attempted a product of probabilities assuming independence, which was not given and not correct.
Common mistakes
170/1825 = 0.093
not conditional (170/550) and not a product assuming independence
June 2022 · Paper 3 (Statistics) · Q5(c)4 marks
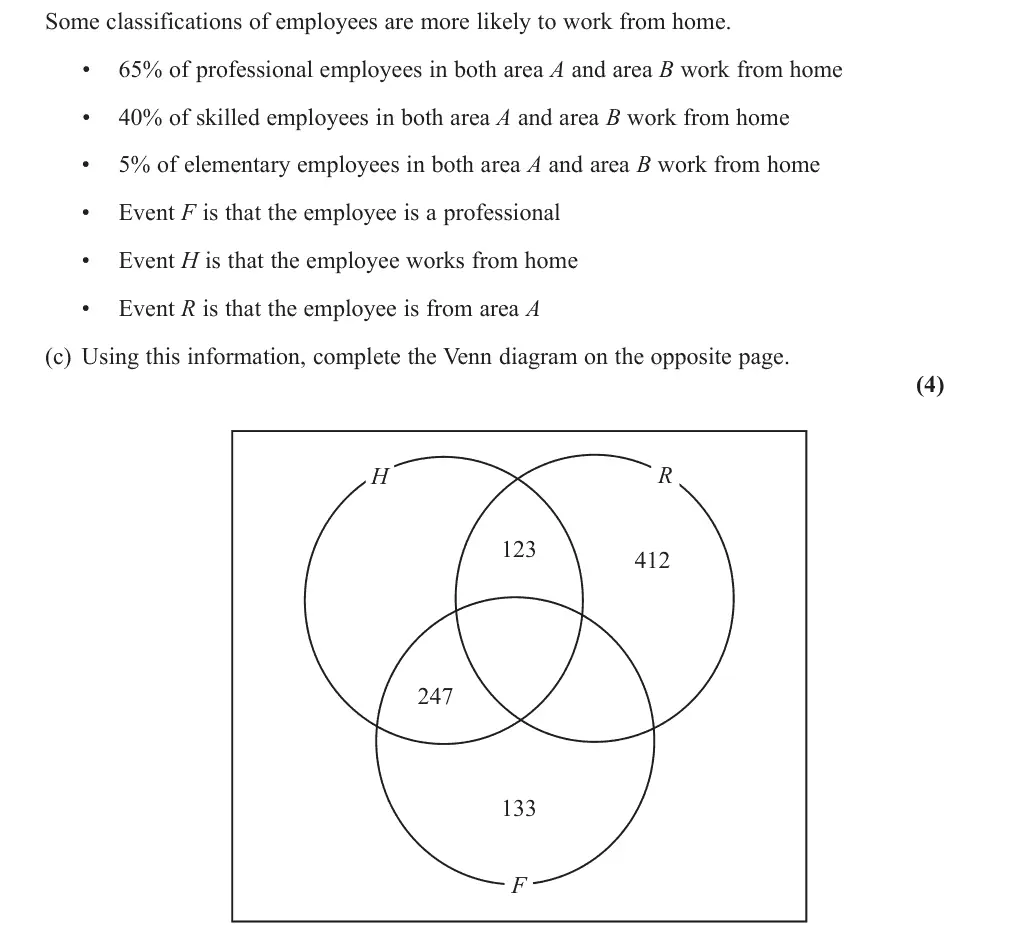
Mark scheme (whole question; this part is marked with the orange bar)
Examiner's comment
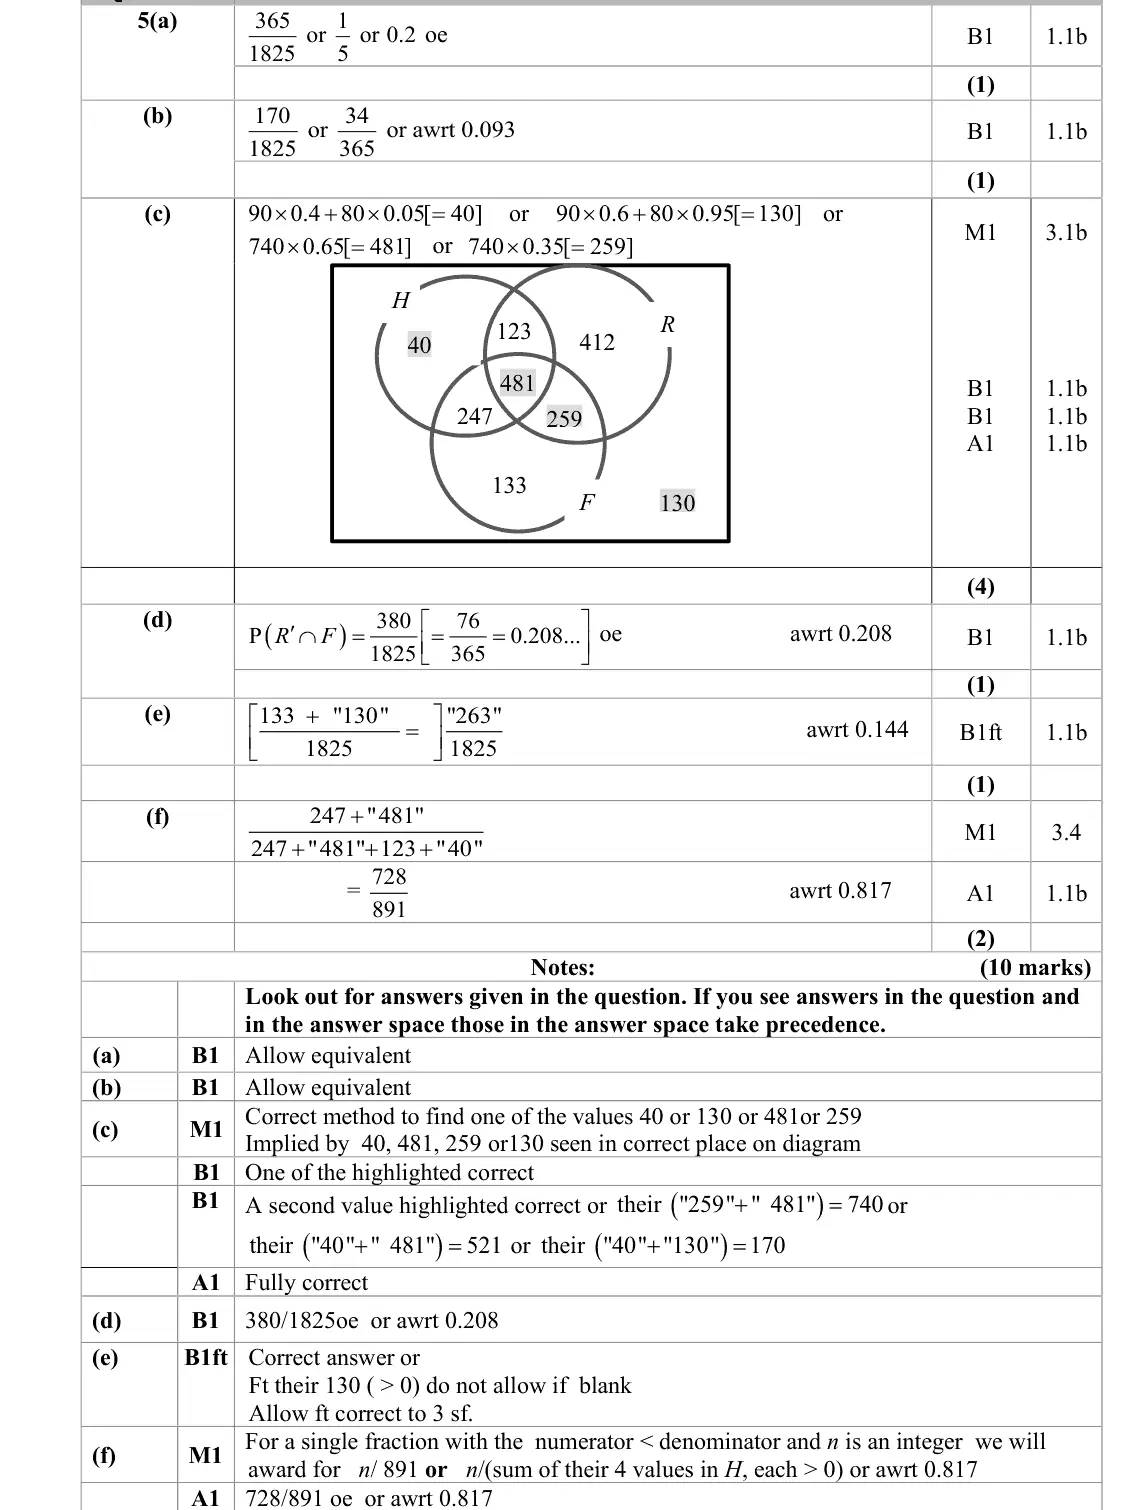
In part (c) there was mixed success in the interpretation of the information given in the question with only about half of students getting the Venn diagram completely correct. Some correct diagrams followed minimal working whilst others filled at least a page. A ′∩′∩ ′ blank. The method mark was common omission was to leave the region H R F most commonly given when implied by one correct value in the Venn diagram, rather than for the student’s working, which was commonly unclear. Some working indicated incorrect use of the given percentages. Where only one value was correct in the Venn diagram it was usually the 481 or 259, for ‘professionals from area A’. When none or only one of the four correct values was seen many students benefited from being able to achieve 1 mark for the sums of certain pairs of values in their diagram. There were a number of students who simply abandoned the Venn diagram which often resulted in no attempts being made at the remaining parts of the question.
Common mistakes
40 = 90 × 0.4 + 80 × 0.05 (skilled and elementary from B at home), 481 = 740 × 0.65, 259 = 740 × 0.35, 130 outside all circles
do not leave a region blank
June 2022 · Paper 3 (Statistics) · Q5(d)1 mark
Mark scheme (whole question; this part is marked with the orange bar)
Examiner's comment
Part (d) had a mixed response with many correct answers. This part could be answered independently of whether or not (c) had been attempted and it was good to see most students doing so successfully through mark could only be scored by students who had some value in the region 𝐻𝐻′ ∩ 𝑅𝑅′ ∩𝐹𝐹′ so that this value could be added to the 133 in their calculation. A common Whilst many realised the 133 given in the Venn diagram was required, the follow- non-scoring answer of 133 1825 was often seen. Most students realised that part (d) was a conditional probability question with many taking the simpler approach of using numbers rather than probabilities in their ratio. Those with a correct Venn diagram usually scored both marks here. As is often the case, a noticeable number of students had the incorrect event, namely F, as the denominator in their probability expression rather than H.
Common mistakes
R′ ∩ F is professionals in area B: 380/1825 = 0.208
June 2022 · Paper 3 (Statistics) · Q5(e)1 mark
Mark scheme (whole question; this part is marked with the orange bar)
Examiner's comment
Part (a) was well answered with most students able to gain the mark for a correct answer. A simplified fraction or the correct decimal value was often seen. Whilst the majority of students continued to score well in part (b) the most common incorrect answer came from students who thought the question was conditional, giving 170 550 , i.e. the probability of not being a professional given they live in area B. Some students attempted a product of probabilities assuming independence, which was not given and not correct. In part (c) there was mixed success in the interpretation of the information given in the question with only about half of students getting the Venn diagram completely correct. Some correct diagrams followed minimal working whilst others filled at least a page. A ′∩′∩ ′ blank. The method mark was common omission was to leave the region H R F most commonly given when implied by one correct value in the Venn diagram, rather than for the student’s working, which was commonly unclear. Some working indicated incorrect use of the given percentages. Where only one value was correct in the Venn diagram it was usually the 481 or 259, for ‘professionals from area A’. When none or only one of the four correct values was seen many students benefited from being able to achieve 1 mark for the sums of certain pairs of values in their diagram. There were a number of students who simply abandoned the Venn diagram which often resulted in no attempts being made at the remaining parts of the question. Part (d) had a mixed response with many correct answers. This part could be answered independently of whether or not (c) had been attempted and it was good to see most students doing so successfully through mark could only be scored by students who had some value in the region 𝐻𝐻′ ∩ 𝑅𝑅′ ∩𝐹𝐹′ so that this value could be added to the 133 in their calculation. A common Whilst many realised the 133 given in the Venn diagram was required, the follow- non-scoring answer of 133 1825 was often seen. Most students realised that part (d) was a conditional probability question with many taking the simpler approach of using numbers rather than probabilities in their ratio. Those with a correct Venn diagram usually scored both marks here. As is often the case, a noticeable number of students had the incorrect event, namely F, as the denominator in their probability expression rather than H.
Common mistakes
(133 + 130)/1825 = 0.144
133/1825 alone is wrong – include the region outside all circles
Oct 2021 · AS Paper 2 (Statistics) · Q1(a)1 mark
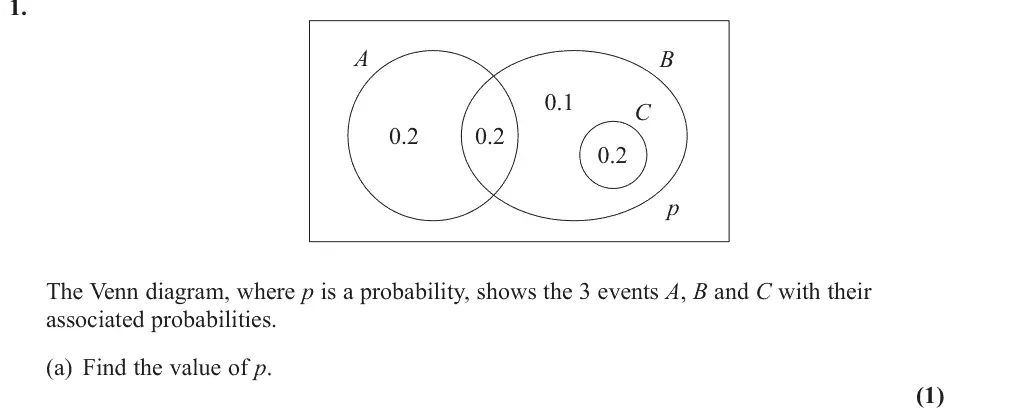
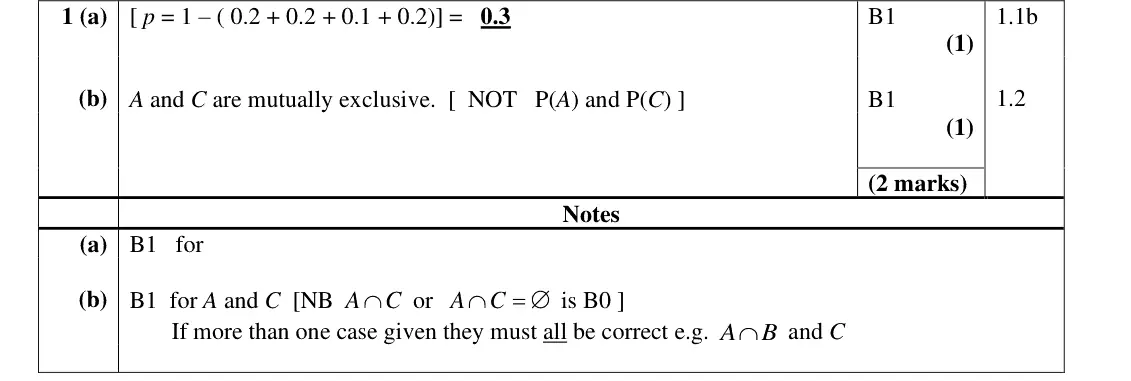
Mark scheme (whole question; this part is marked with the orange bar)
Examiner's comment
The vast majority were able to find the correct value for p but under half managed to identify a pair of mutually exclusive events. Some lost the mark for confusing events with probabilities of events and others thought the answer was A and B or B and C.
Common mistakes
probabilities in a Venn diagram sum to 1
p = 1 − 0.7 = 0.3
Oct 2021 · AS Paper 2 (Statistics) · Q1(b)1 mark
Mark scheme (whole question; this part is marked with the orange bar)
Examiner's comment
The vast majority were able to find the correct value for p but under half managed to identify a pair of mutually exclusive events. Some lost the mark for confusing events with probabilities of events and others thought the answer was A and B or B and C.
Common mistakes
answer is the events A and C, not P(A) and P(C) or A ∩ C = ∅
A and B or B and C (overlapping) are common wrong answers
C inside B is not exclusive
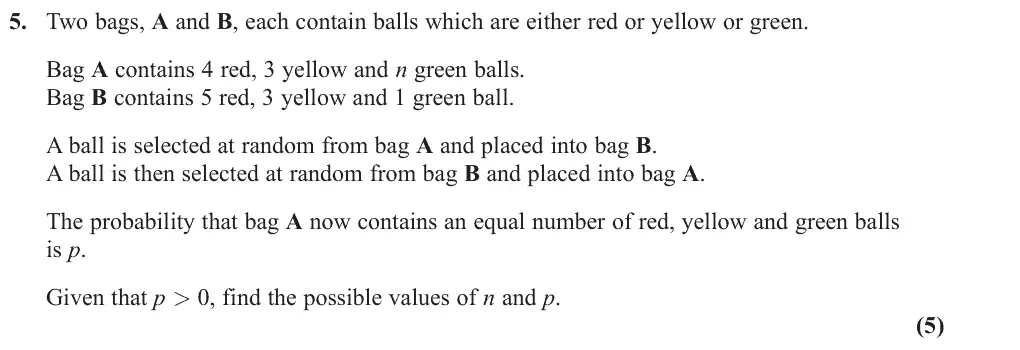
Oct 2021 · AS Paper 2 (Statistics) · Q55 marks
Mark scheme (whole question; this part is marked with the orange bar)
Examiner's comment
Sadly two thirds of the candidates were not able to make any progress with this question. Those who did pause for a moment and consider the situation often realised that there were two possible cases to consider. The majority of these failed to give the correct probabilities though as they did not realise that after the initial transfer from bag A there were 10, rather than 9, balls in bag B. A handful of the students did negotiate the problem successfully though some then added together their probabilities (instead of giving the two pairings of n and p) and lost the final mark.
Common mistakes
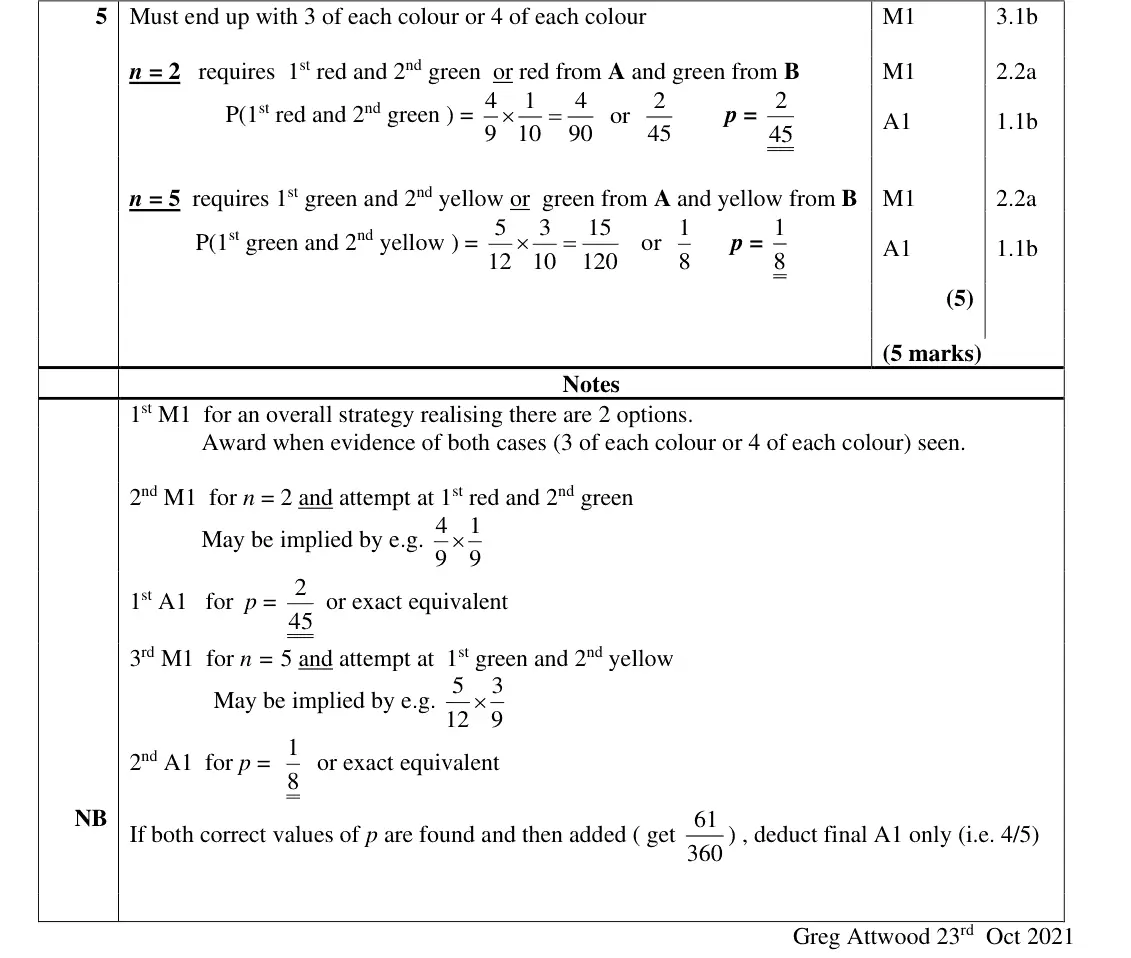
two cases: 3 of each colour (n = 2, red then green, p = 2/45) or 4 of each (n = 5, green then yellow, p = 1/8)
bag B has 10 balls after the first transfer, not 9
give the pairs, do not add the probabilities
Oct 2021 · Paper 3 (Statistics) · Q4(a)1 markHard
Mark scheme (whole question; this part is marked with the orange bar)
Examiner's comment
This proved to be a good source of marks for most candidates with only 2% failing to score and over 18% scoring full marks. Most students navigated parts (a) and (b) successfully but a few missed the information that “No students read all three magazines” and wasted a lot of time trying to find two equations in p and q. The conditional probability in part (c) proved to be a challenge for some; there were those who effectively
Common mistakes
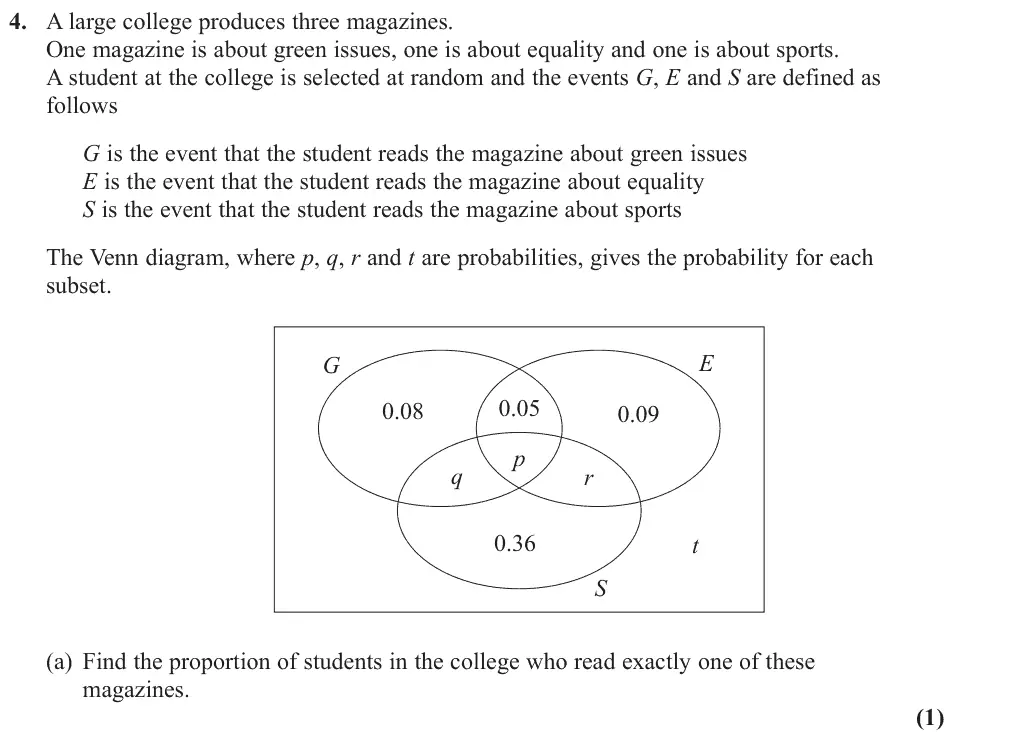
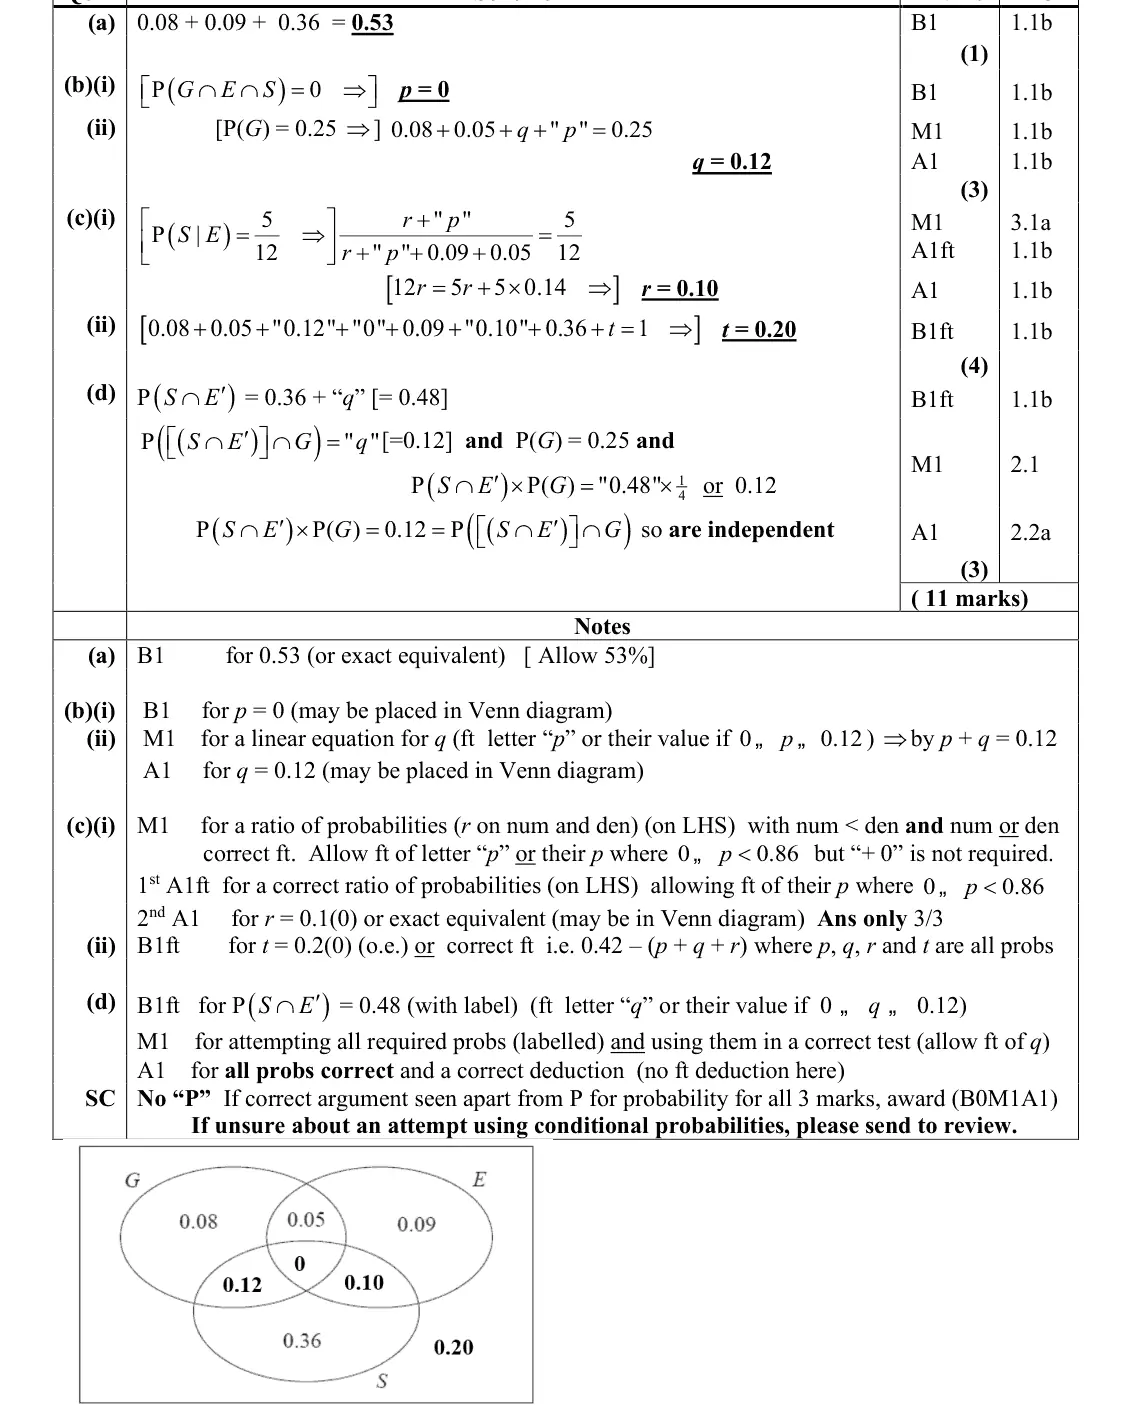
exactly one magazine = 0.08 + 0.09 + 0.36 = 0.53
Oct 2021 · Paper 3 (Statistics) · Q4(b)3 marksMedium
Mark scheme (whole question; this part is marked with the orange bar)
Examiner's comment
This proved to be a good source of marks for most candidates with only 2% failing to score and over 18% scoring full marks. Most students navigated parts (a) and (b) successfully but a few missed the information that “No students read all three magazines” and wasted a lot of time trying to find two equations in p and q. The conditional probability in part (c) proved to be a challenge for some; there were those who effectively
Common mistakes
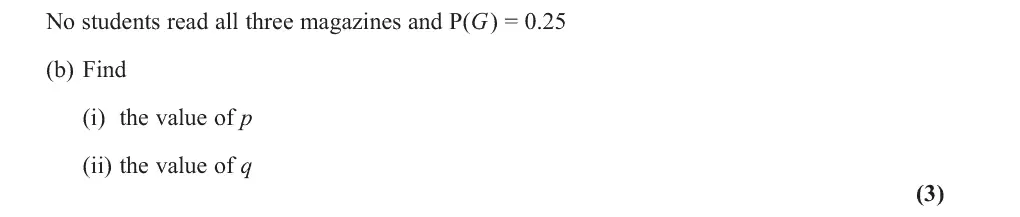
no student reads all three so p = 0
P(G) = 0.25 gives q = 0.12
missing the "no students read all three" information
Oct 2021 · Paper 3 (Statistics) · Q4(c)4 marksEasy
Mark scheme (whole question; this part is marked with the orange bar)
Examiner's comment
This proved to be a good source of marks for most candidates with only 2% failing to score and over 18% The conditional probability in part (c) proved to be a challenge for some; there were those who effectively used P(E | S) and others were miscopying values from their Venn diagram. Those who failed to make any progress in (i) were often able to pick up a mark for a correct follow through when finding the value of t.
Common mistakes
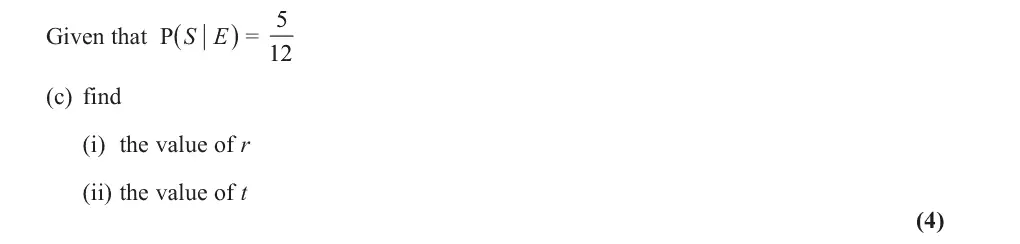
P(S given E) = (r + p)/(r + p + 0.09 + 0.05) = 5/12 gives r = 0.10
not P(E given S)
total probability 1 gives t = 0.20
Oct 2021 · Paper 3 (Statistics) · Q4(d)3 marksEasy
Mark scheme (whole question; this part is marked with the orange bar)
Examiner's comment
This proved to be a good source of marks for most candidates with only 2% failing to score and over 18% Part (d) was the least successful part of the question often due to poor use of the notation. There were a curiously large number of students who confused events with the probability of events; for example we saw E′ E′ a number of cases of students writing S = 0.48 instead of P( S ) = 0.48. Another source of errors ∩ ∩ and was confusing the symbols ∪ in their expressions. There was a demand to show clear working here ∩ and this meant that we needed to see probabilities correctly labelled and an appropriate test clearly shown and a number of attempts lacked these features but there were plenty of good solutions to this part too.
Oct 2021 · Paper 3 (Statistics) · Q6(b)2 marksHard
Mark scheme (whole question; this part is marked with the orange bar)
Examiner's comment
students found the correct set of values with varying degrees of explanation on the way. Part (b) was often left blank though the first mark was available without values for a, b and c provided brackets were used correctly for the expression. Nearly 10% managed to score full marks for the question.
Common mistakes
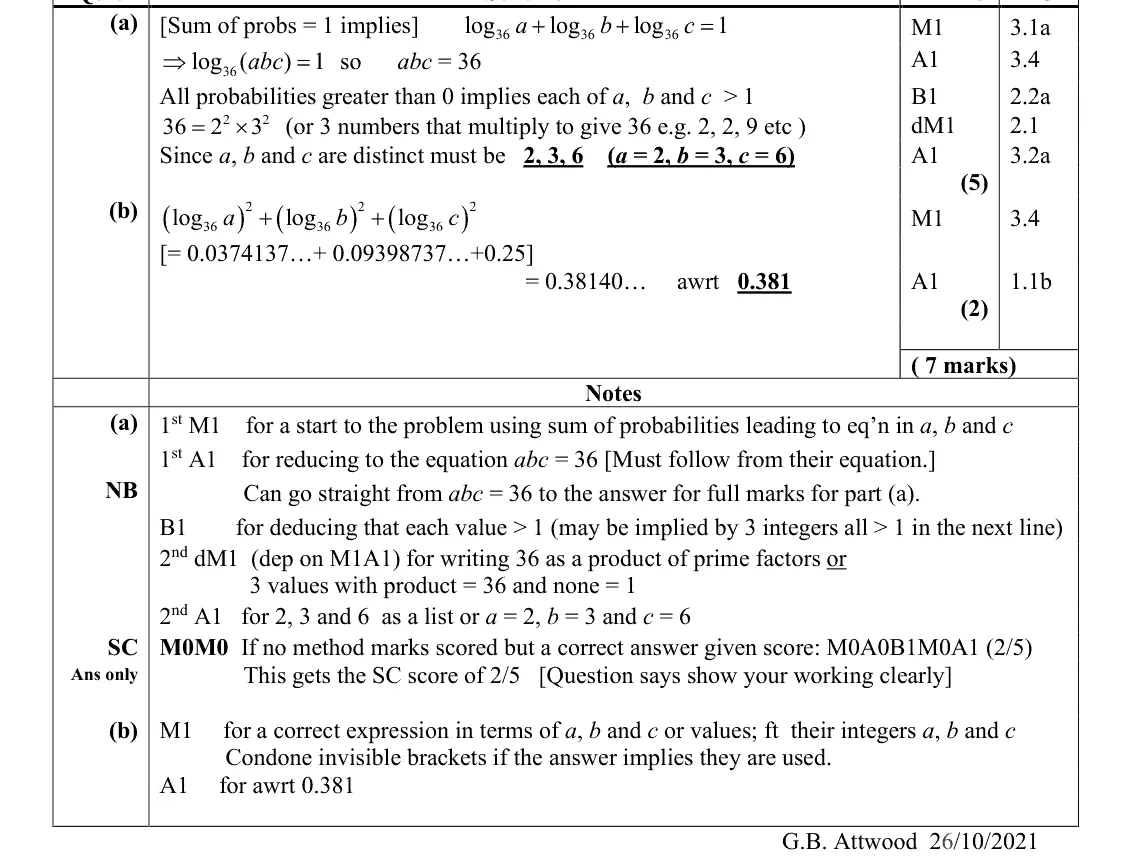
P(X₁ = X₂) = sum of squared probabilities (log₃₆a)² + (log₃₆b)² + (log₃₆c)² = 0.381
brackets needed
Oct 2020 · AS Paper 2 (Statistics) · Q36 marks
Mark scheme (whole question; this part is marked with the orange bar)
Examiner's comment
There were some very good solutions given to this question with clear and organised working but there were many others with a correct statement lurking amid a pile of detritus. Candidates need to plan a course of action before writing numbers down. The most common error was to double the wrong set of probabilities, but there were still marks to be gained in further working. There were too many candidates who did not see the need to use the sum of probabilities as part of a solution. The candidates who reached the latter stages generally found the correct ways in which to obtain a total of 6. One of the more frequent errors in finding the total of 6 was think that there are two ways of arranging 3,3.
Common mistakes
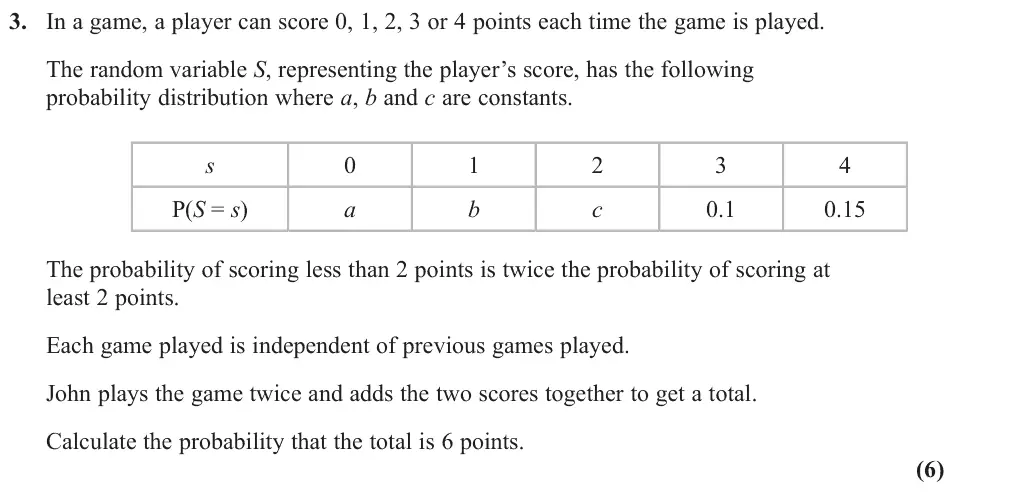
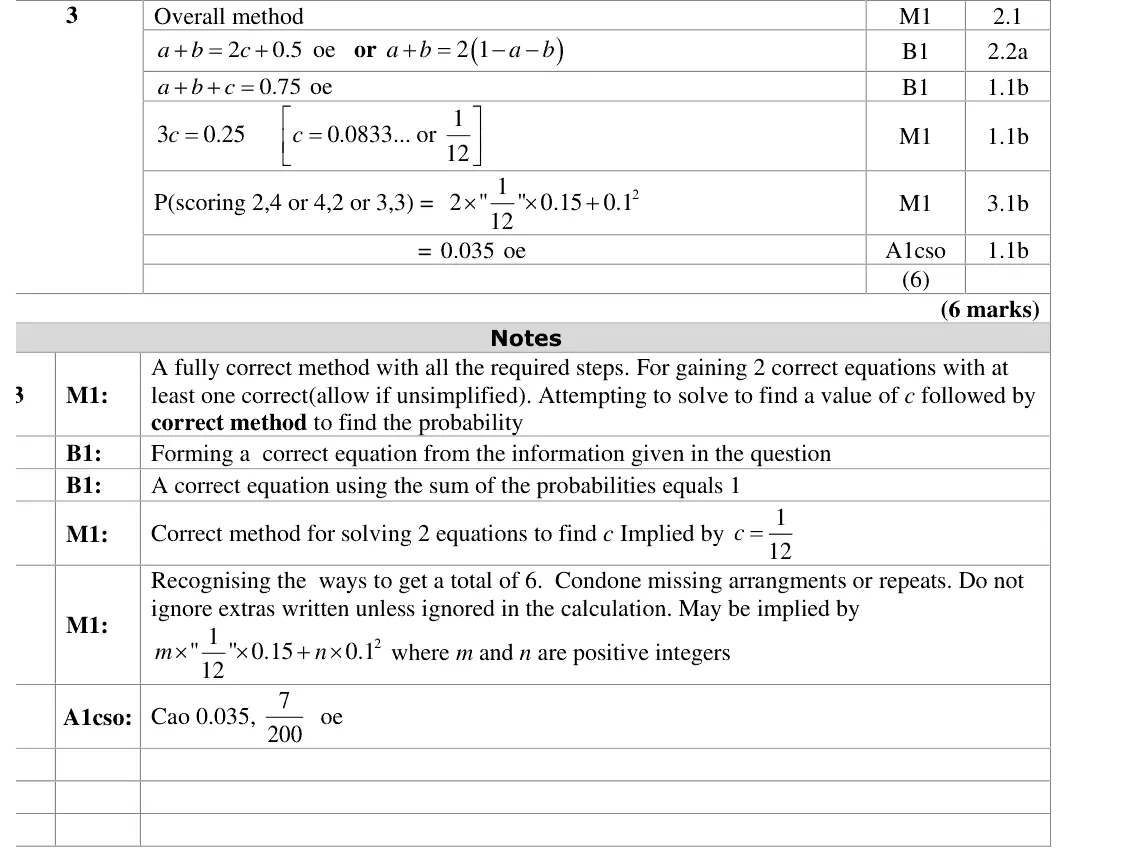
form a + b = 2(c + 0.25) and a + b + c = 0.75 (sum of probabilities = 1, often missed) to get c = 1/12
total 6 from (2,4), (4,2), (3,3): 2 × c × 0.15 + 0.1² = 0.035
doubling the wrong set of probabilities
(3,3) counted twice
Oct 2020 · Paper 3 (Statistics) · Q1(a)1 markMedium
Mark scheme (whole question; this part is marked with the orange bar)
Examiner's comment
This proved to be a popular start to the paper with over 35% of students scoring full marks. Part (a) was answered well with most understanding the term “mutually exclusive” and giving their answer as events not probabilities. Part (b) was very
Common mistakes
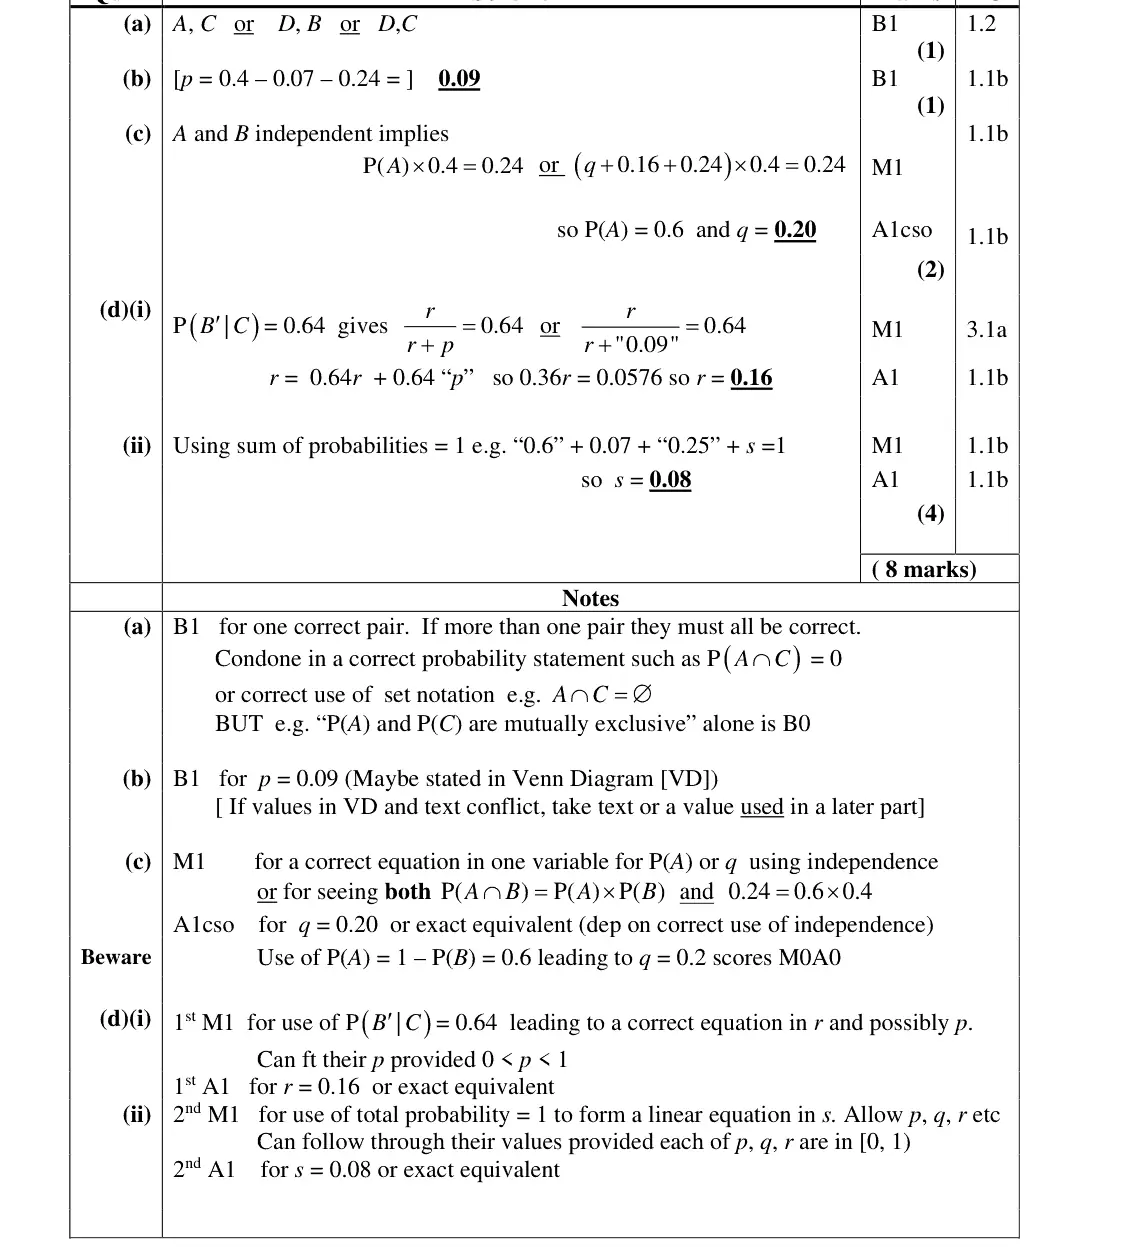
events, not probabilities (A and C, B and D, or C and D)
P(A ∩ C) = 0 or A ∩ C = ∅ accepted
all pairs given must be correct
Oct 2020 · Paper 3 (Statistics) · Q1(b)1 mark
Mark scheme (whole question; this part is marked with the orange bar)
Examiner's comment
This proved to be a popular start to the paper with over 35% of students scoring full exclusive” and giving their answer as events not probabilities. Part (b) was very straightforward and nearly all could interpret the Venn diagram correctly to answer this. Many knew a suitable rule for independence in part (c) and could use this to find P(A) =
Common mistakes
p = 0.4 − 0.07 − 0.24 = 0.09
Oct 2020 · Paper 3 (Statistics) · Q1(c)2 marks
Mark scheme (whole question; this part is marked with the orange bar)
Examiner's comment
This proved to be a popular start to the paper with over 35% of students scoring full Many knew a suitable rule for independence in part (c) and could use this to find P(A) = 0.6 or write down a suitable equation for q which was then solved correctly. Part (d)
Common mistakes
independence: P(A) × P(B) = P(A ∩ B) gives P(A) = 0.6, so q = 0.20
P(A) = 1 − P(B) = 0.6 is wrong reasoning and scores nothing
Oct 2020 · Paper 3 (Statistics) · Q1(d)4 marks
Mark scheme (whole question; this part is marked with the orange bar)
Examiner's comment
This proved to be a popular start to the paper with over 35% of students scoring full 0.6 or write down a suitable equation for q which was then solved correctly. Part (d) was more challenging as many could not use the given conditional probability correctly to obtain an equation for r but most knew how to use this answer to find s and were able to gain at least one mark in this part.
Common mistakes
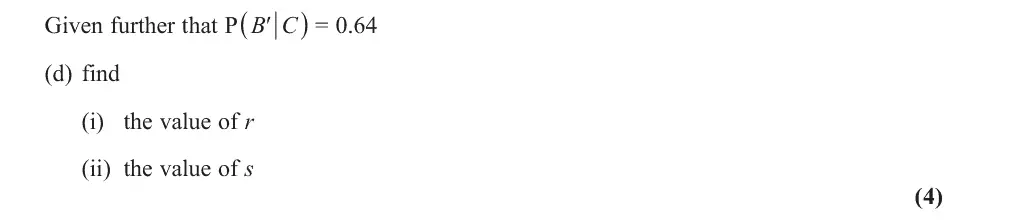
P(B′ given C) = r/(r + p) = 0.64 gives r = 0.16 (many could not form this equation)
total probability 1 gives s = 0.08
Oct 2020 · Paper 3 (Statistics) · Q4(b)3 marks
Mark scheme (whole question; this part is marked with the orange bar)
Examiner's comment
identify some, though rarely all, the cases in (b). Finding the probabilities was more of a problem with some using P(D = 50) + P(D = 30) rather than the product and those having correct probabilities for all 3 cases were quite rare. It was good to see many students who had faltered on (b) still making a start on part (c). Many identified the 4
Common mistakes
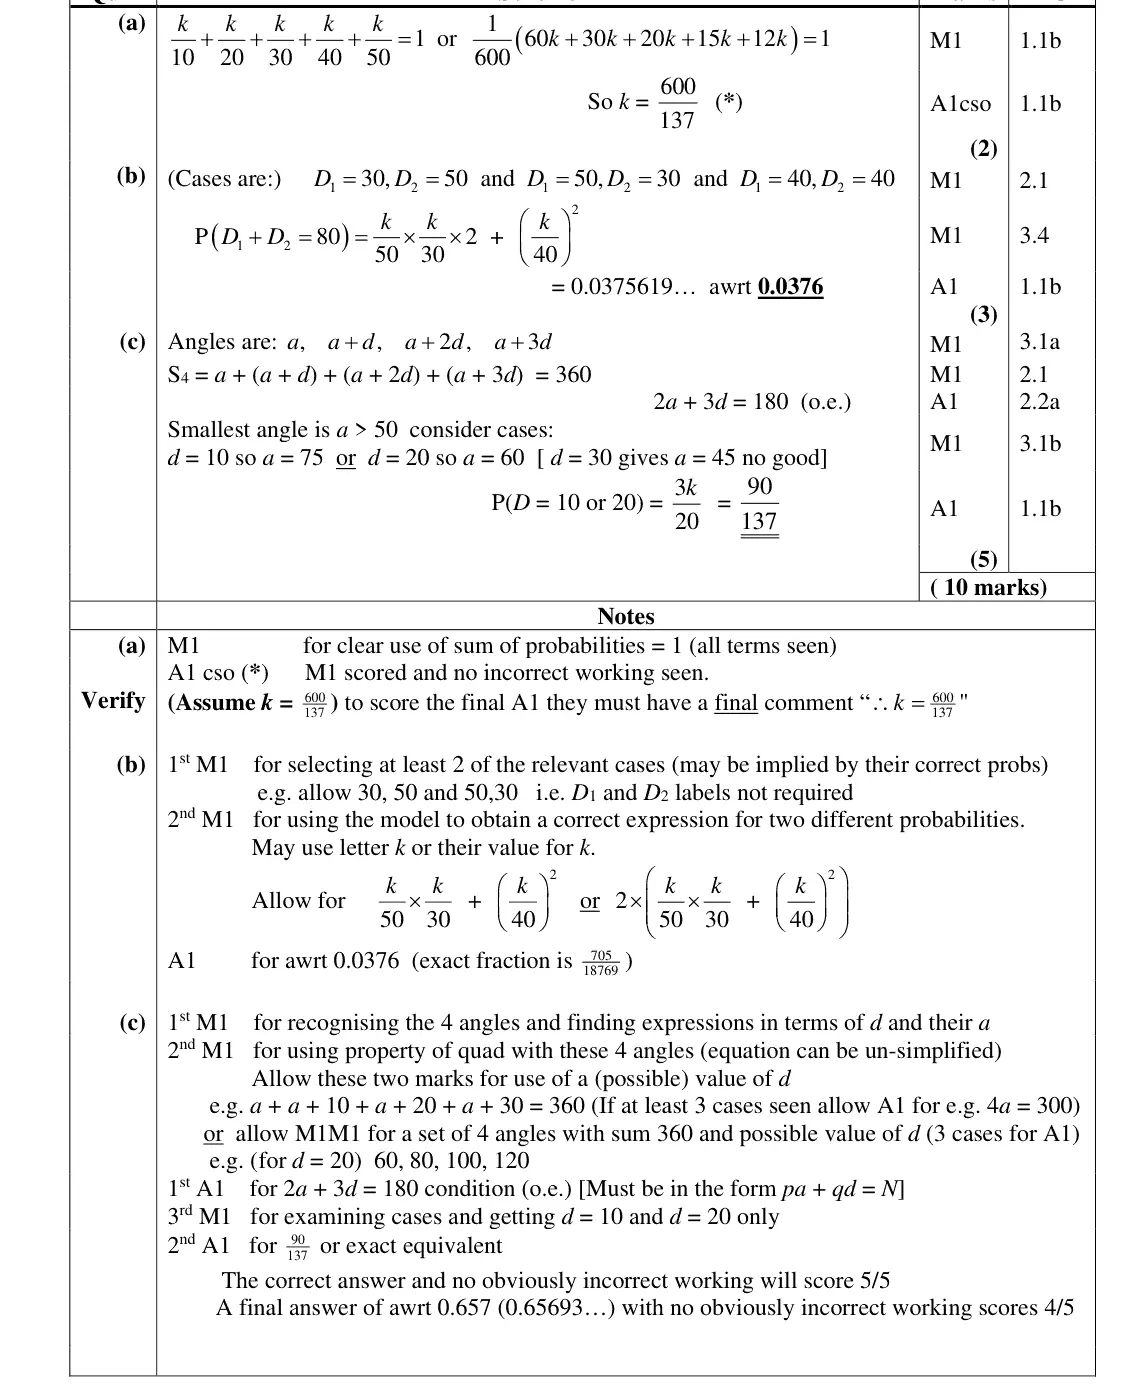
three cases: (30, 50), (50, 30), (40, 40)
multiply probabilities for independent events (not add)
0.0376
June 2019 · AS Paper 2 (Statistics) · Q25 marksMedium
Mark scheme (whole question; this part is marked with the orange bar)
Examiner's comment
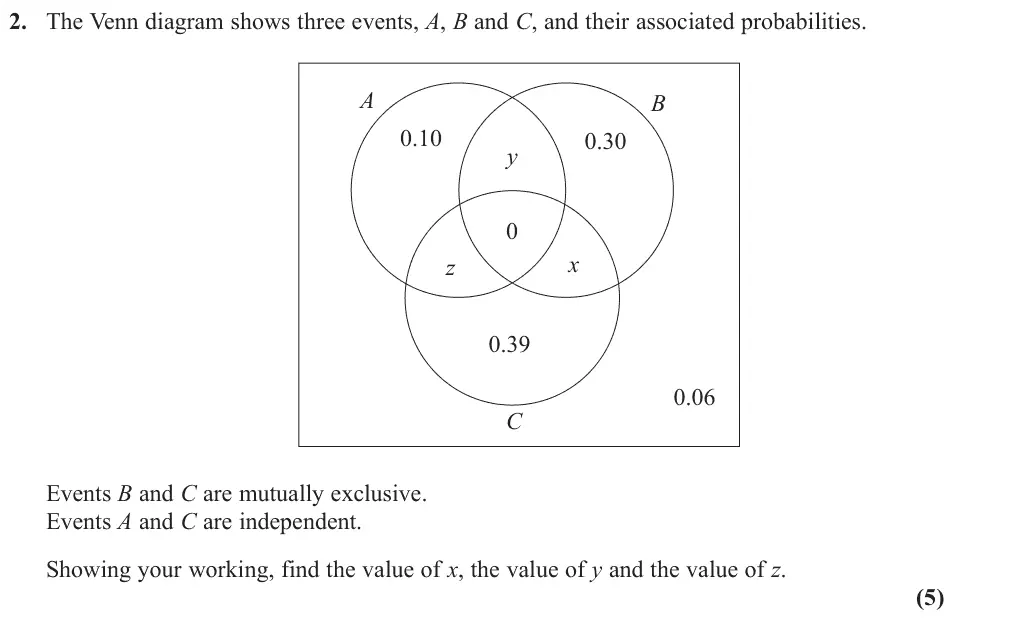
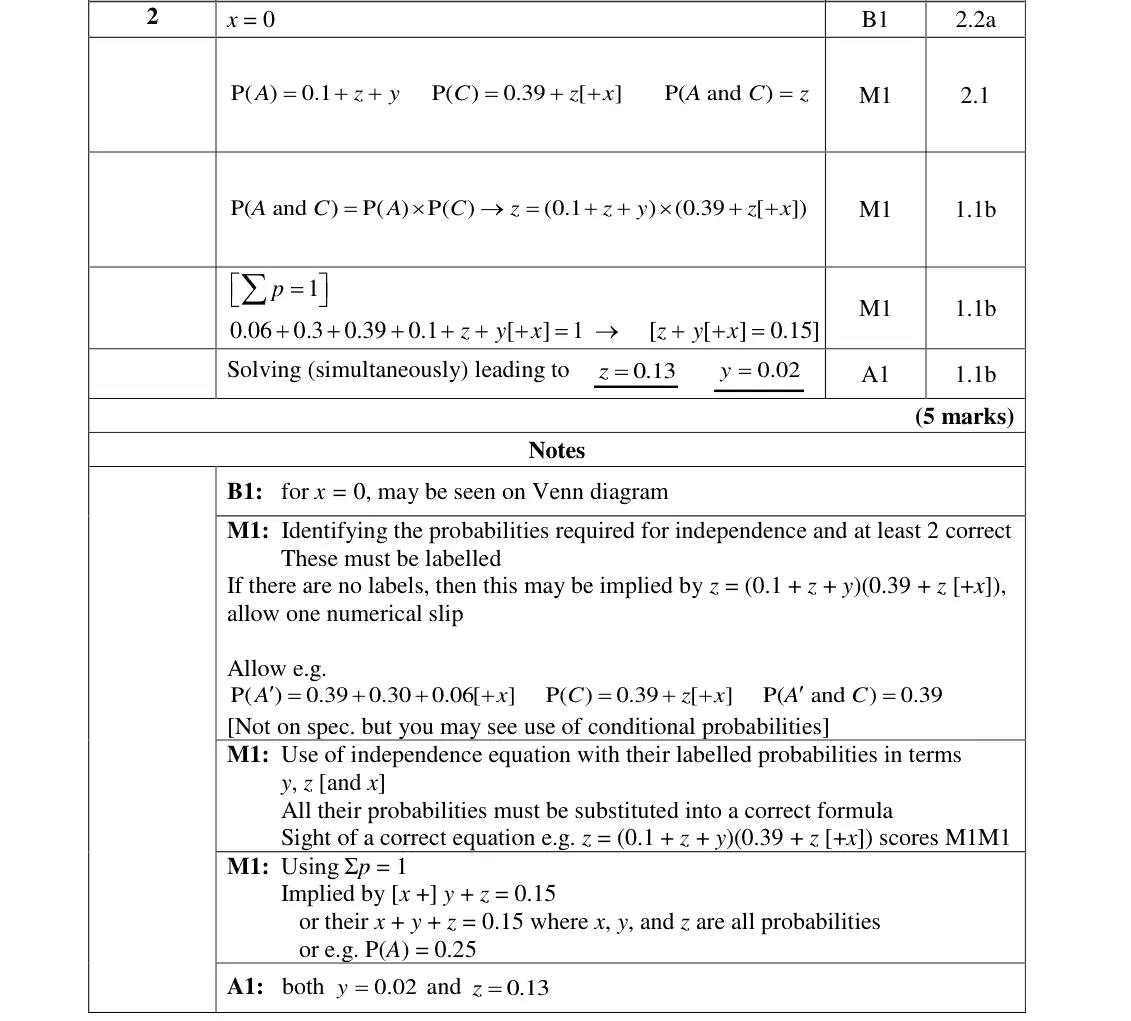
Only around 10% of candidates achieved full marks on this question, but there were many strong attempts made. Most scored the first mark for identifying that x = 0. The most common error across the question was to ignore the intersections and calculate P(A) x P(C) as 0.1 x 0.39. The majority of candidates scored the final method mark for a correct equation in y and z, demonstrating knowledge of probabilities summing to 1. Surprisingly, of candidates who did set up all of the equations required, many were unable to manipulate the algebra to solve them. Those who confused independent and mutually exclusive events tended to make no progress.
Common mistakes
B and C mutually exclusive so x = 0
independence: P(A ∩ C) = P(A) × P(C) with P(A) = 0.1 + y + z and P(C) = 0.39 + z (not 0.1 × 0.39 using only the outer regions)
probabilities sum to 1 gives y + z = 0.15
z = 0.13, y = 0.02
June 2019 · Paper 3 (Statistics) · Q4(a)1 mark
Mark scheme (whole question; this part is marked with the orange bar)
Examiner's comment
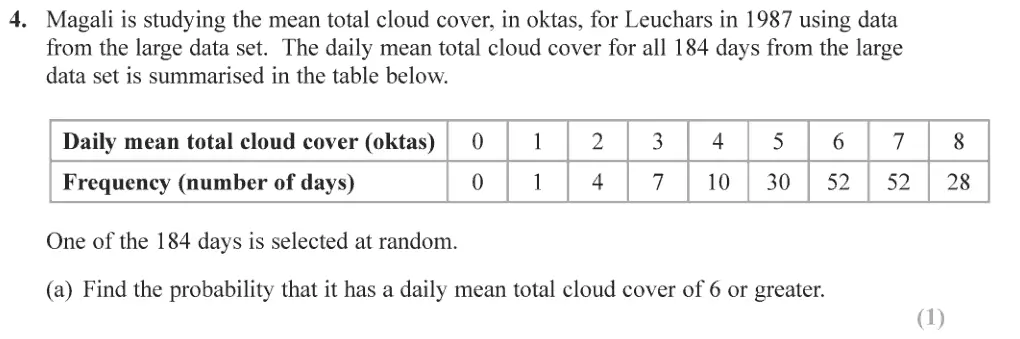
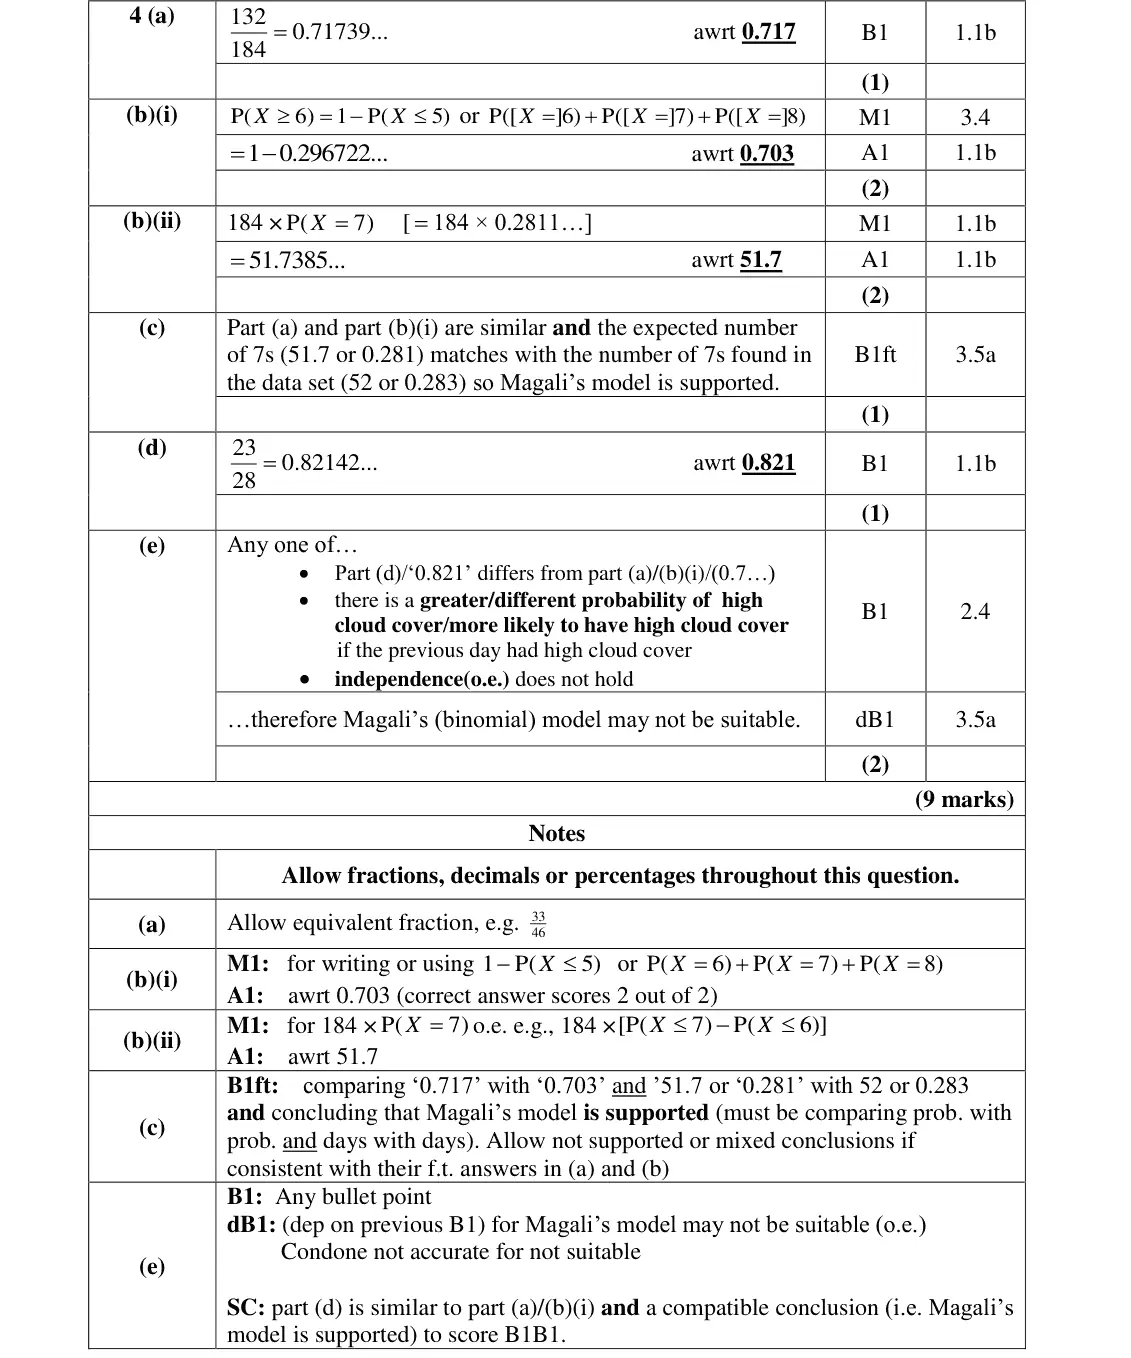
This question demonstrated that most candidates are confident in carrying out statistical calculations, particularly probabilities, but only the most able are confident in interpreting in context what these mean. Most earned the mark in part (a) except the few candidates who did not give an answer to the required degree of accuracy.
Common mistakes
132/184 = 0.717 to 3 s.f.
June 2019 · Paper 3 (Statistics) · Q4(d)1 mark
Mark scheme (whole question; this part is marked with the orange bar)
Examiner's comment
This question demonstrated that most candidates are confident in carrying out statistical calculations, particularly probabilities, but only the most able are confident in interpreting in Most who attempted part (d) scored the mark. was to compare the result in (d) to 0.76. The failure to focus on the fact that the model was Binomial, and whether therefore the conditions of independence had been met, demonstrated the general unfamiliarity with modelling.
Common mistakes
23/28 = 0.821
June 2018 · AS Paper 2 · Q2(a)3 marks
Mark scheme (whole question; this part is marked with the orange bar)
Examiner's comment
Despite the large number of students scoring zero here, about 1/3 managed to answer part (a) successfully. Part (b) required an explanation which means both words and a simple calculation were
Common mistakes
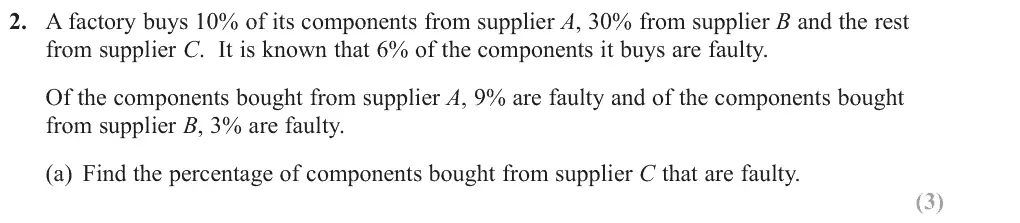
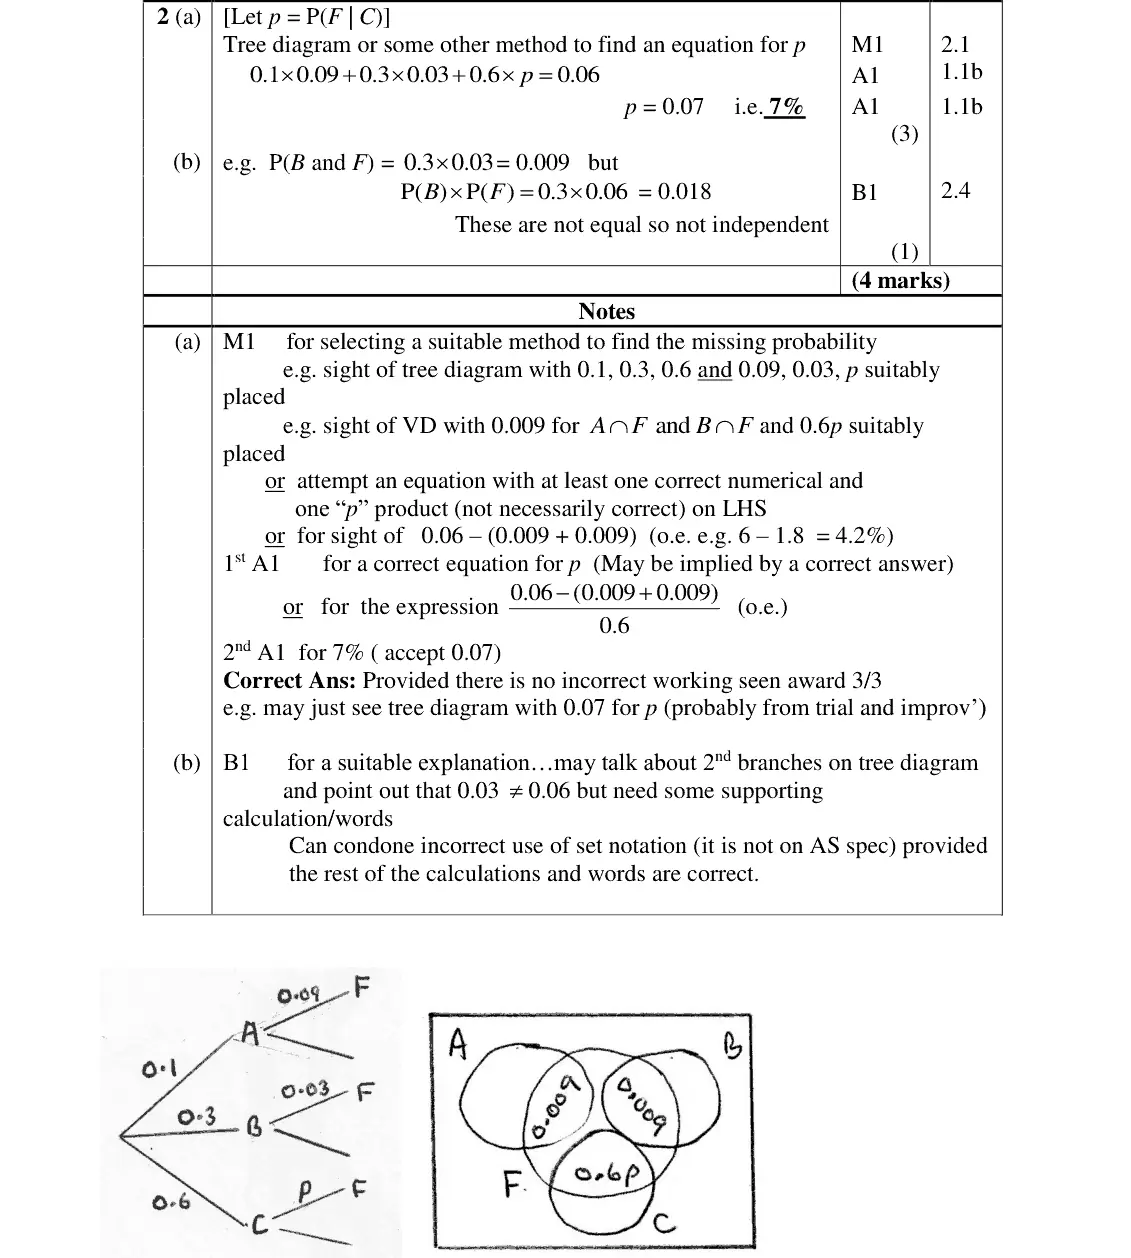
tree diagram: 0.1 × 0.09 + 0.3 × 0.03 + 0.6p = 0.06 gives p = 0.07, i.e. 7%
supplier C supplies 60%
about a third of students succeeded
June 2018 · AS Paper 2 · Q2(b)1 mark
Mark scheme (whole question; this part is marked with the orange bar)
Examiner's comment
successfully. Part (b) required an explanation which means both words and a simple calculation were required. Some found P(B) x P(F) = 0.018 and others gave the probability of the component coming from B and being faulty as 0.009 but both of these calculations and a concluding statement were needed to secure the mark.
Common mistakes
P(B and F) = 0.3 × 0.03 = 0.009 but P(B) × P(F) = 0.3 × 0.06 = 0.018
not equal so not independent
a calculation and a concluding statement are both needed (or P(F given B) = 0.03 ≠ 0.06)
June 2018 · Paper 3 · Q3(c)2 marks
Mark scheme (whole question; this part is marked with the orange bar)
Examiner's comment
Part (b) was answered fairly well, but in part (c) many carried on using the B(10, 0.1) model finding P(H = 5) rather than P(F = 5). Part (d) proved more challenging; those who carefully started to list P(F = 5) had to equal their answer to part (c) and made little progress in (d) but could often collect the mark in (e). Part (f) was not answered well; the question clearly steered students to comment on the
Common mistakes
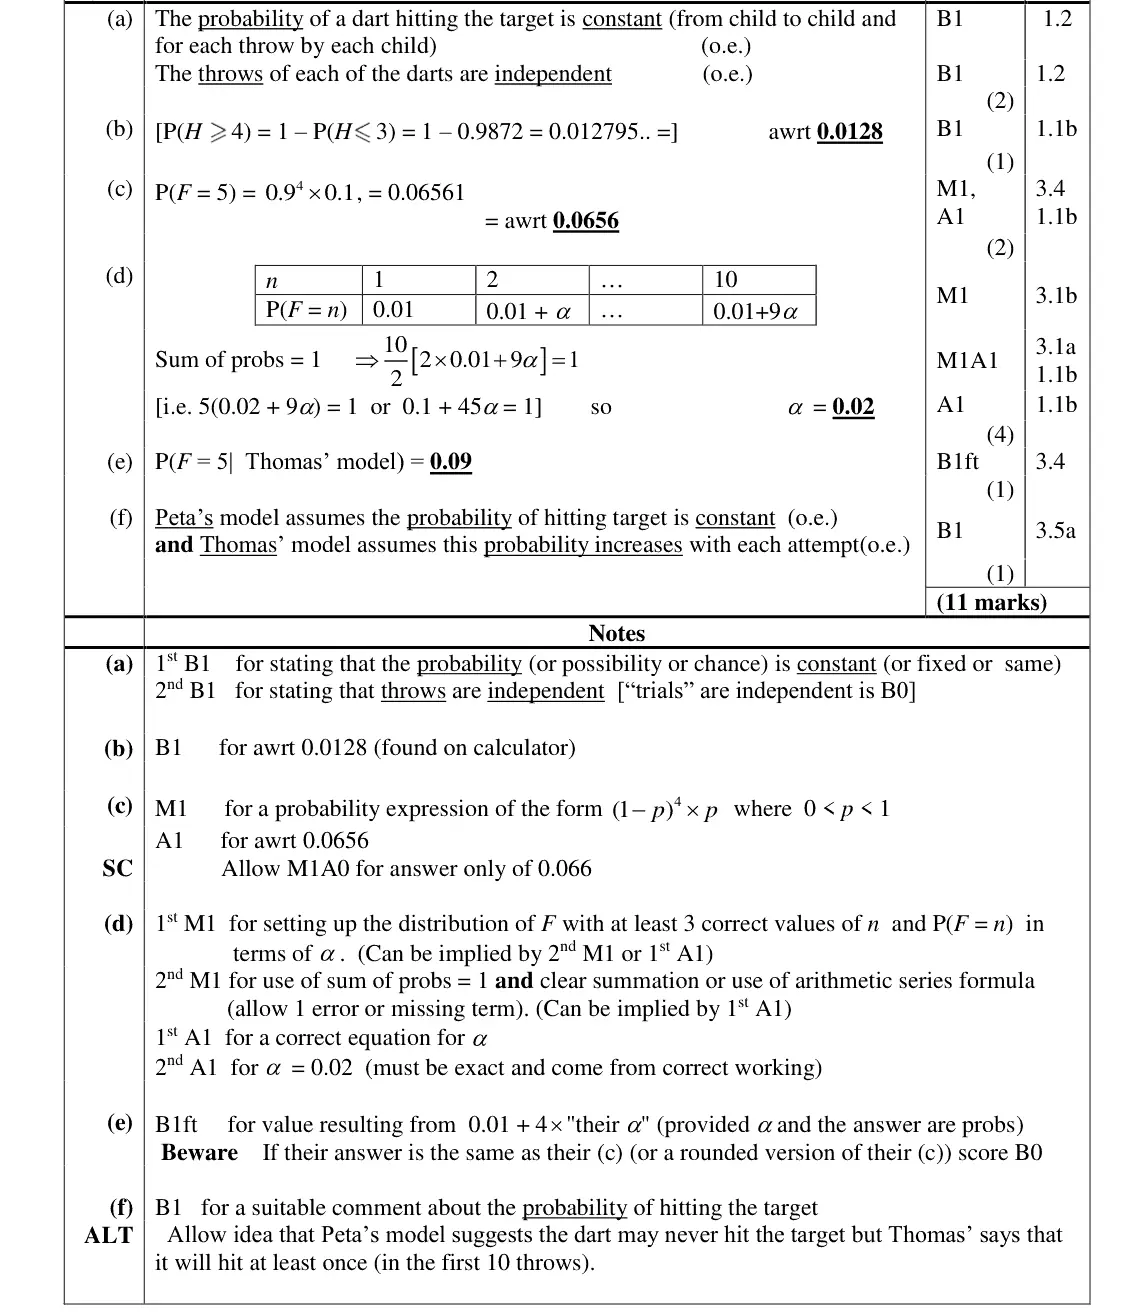
first hit on 5th throw: 0.9⁴ × 0.1 = 0.0656
common error: continuing with B(10, 0.1) to find P(H = 5)
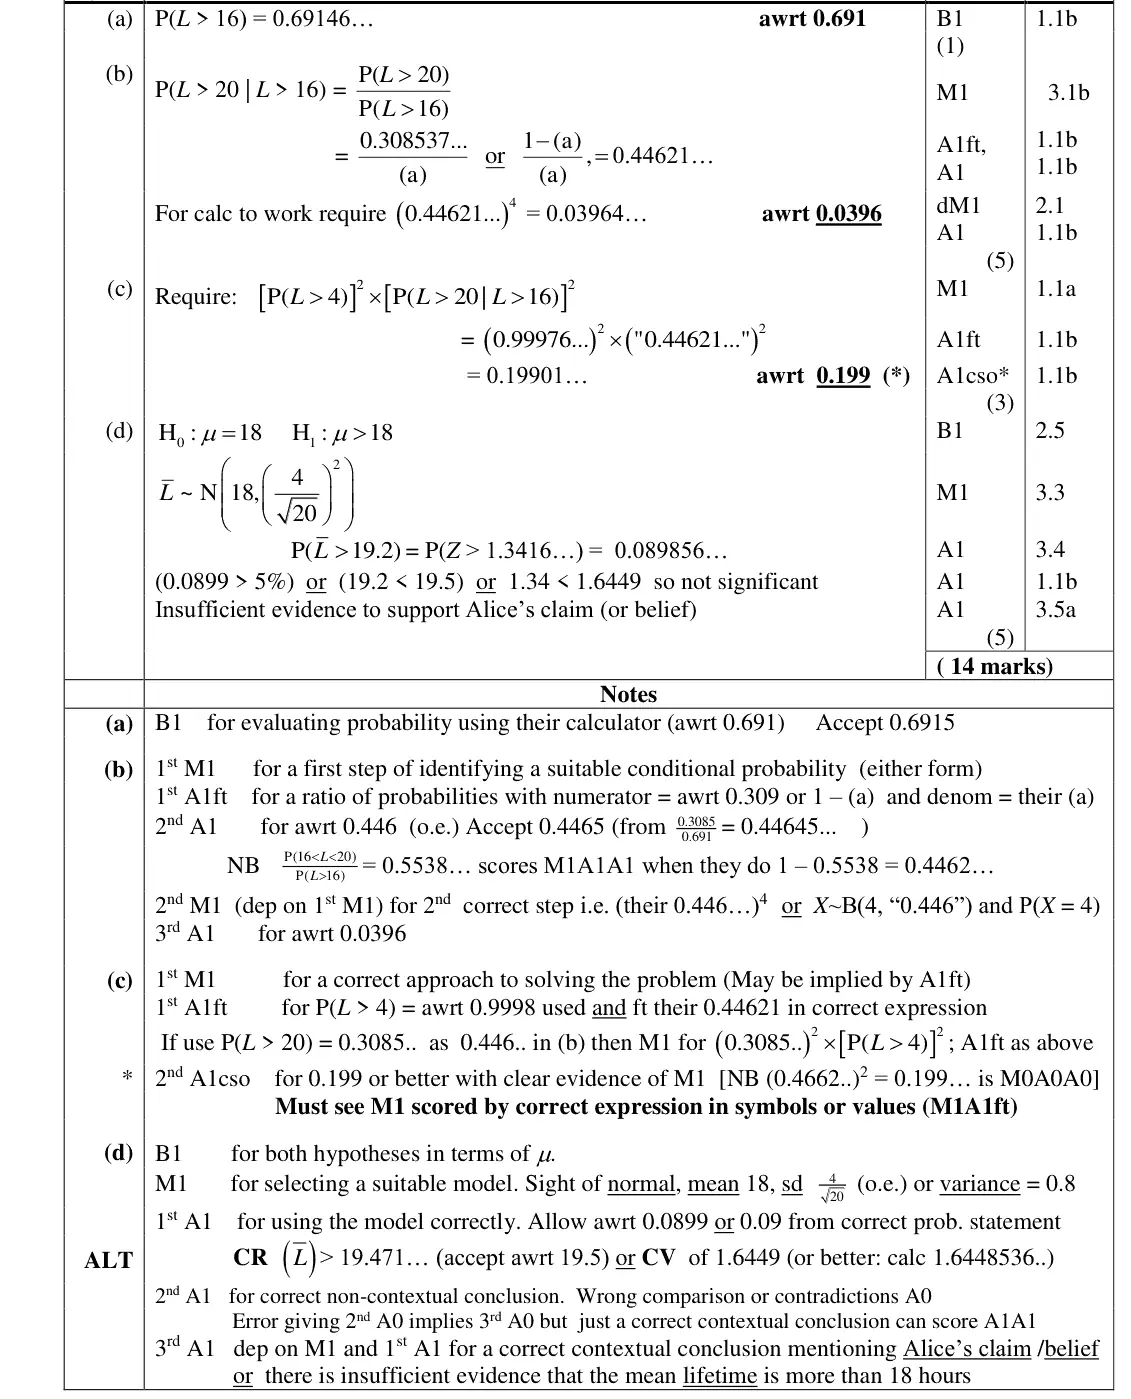
June 2018 · Paper 3 · Q5(b)5 marks
Mark scheme (whole question; this part is marked with the orange bar)
Examiner's comment
Whilst parts (a) and (d) were often answered well, parts (b) and (c) proved much more challenging and only the strongest 10% made significant progress here. Part (a) was answered well and most identified that a conditional probability was required in part (b) were often able to make progress, often obtaining the probability of 0.4462 and using that correctly to complete part (b) and make progress in (c).
Common mistakes
conditional probability P(L > 20 given L > 16) = 0.3085/0.6915 = 0.446
then all 4 batteries independent: 0.446⁴ = 0.0396
many missed the conditional step
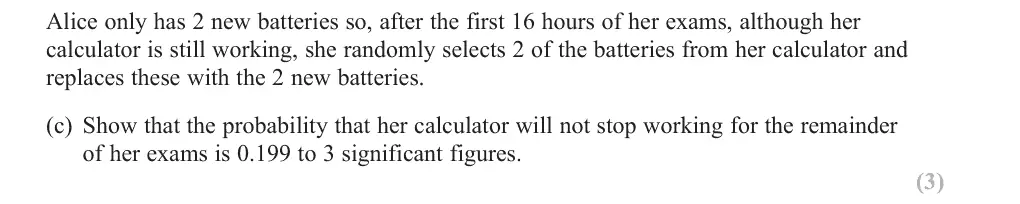
June 2018 · Paper 3 · Q5(c)3 marks
Mark scheme (whole question; this part is marked with the orange bar)
Examiner's comment
Whilst parts (a) and (d) were often answered well, parts (b) and (c) proved much more challenging and only the strongest 10% made significant progress here. Part (a) was answered well and most progress in (c). In part (c), some simply squared their probability of 0.4462 without realising the need to consider the two new batteries as well. Part (d) was often answered quite well with many stating the hypotheses
Common mistakes
two new batteries need P(L > 4)² = 0.9998² and two old ones 0.446²
squaring 0.446 alone is M0
correct expression must be seen for the given answer
Find an Edexcel maths tutor
Stuck on this? Book a trial session with an Edexcel specialist.