Understand the effect of simple transformations on the graph of y = f(x), including sketching associated graphs: y = af(x), y = f(x) + a, y = f(x + a), y = f(ax) and combinations of these transformations
Guidance
Students should be able to find the graphs of y = |f(x)| and y = |f(−x)|, given the graph of y = f(x). Students should be able to apply a combination of these transformations to any of the functions in the A Level specification (quadratics, cubics, quartics, reciprocal, a/x², |x|, sin x, cos x, tan x, eˣ and aˣ) and sketch the resulting graph. Given the graph of y = f(x), students should be able to sketch, e.g., y = 2f(3x) or y = f(−x) + 1, and should be able to sketch (for example) y = 3 + sin 2x, y = −cos(x + π/4).
A-level only
graphs of y = |f(x)| and y = |f(−x)|; transformations of the A-level-only functions
Mark scheme (whole question; this part is marked with the orange bar)
Examiner's comment
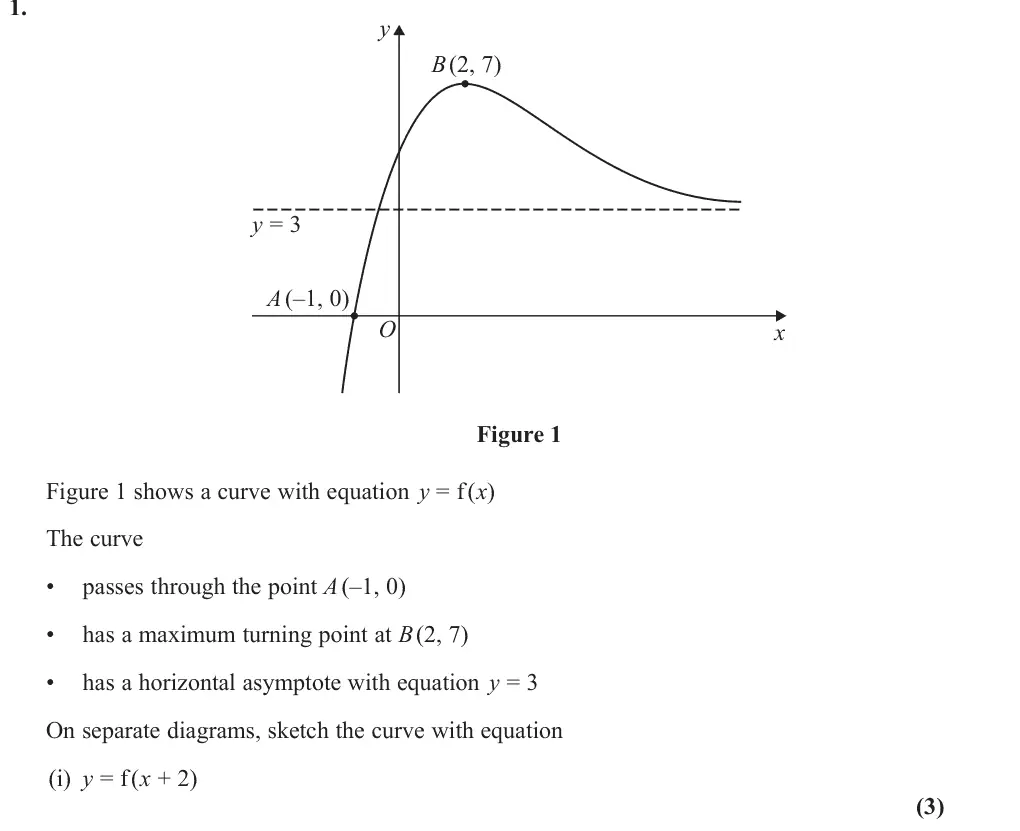
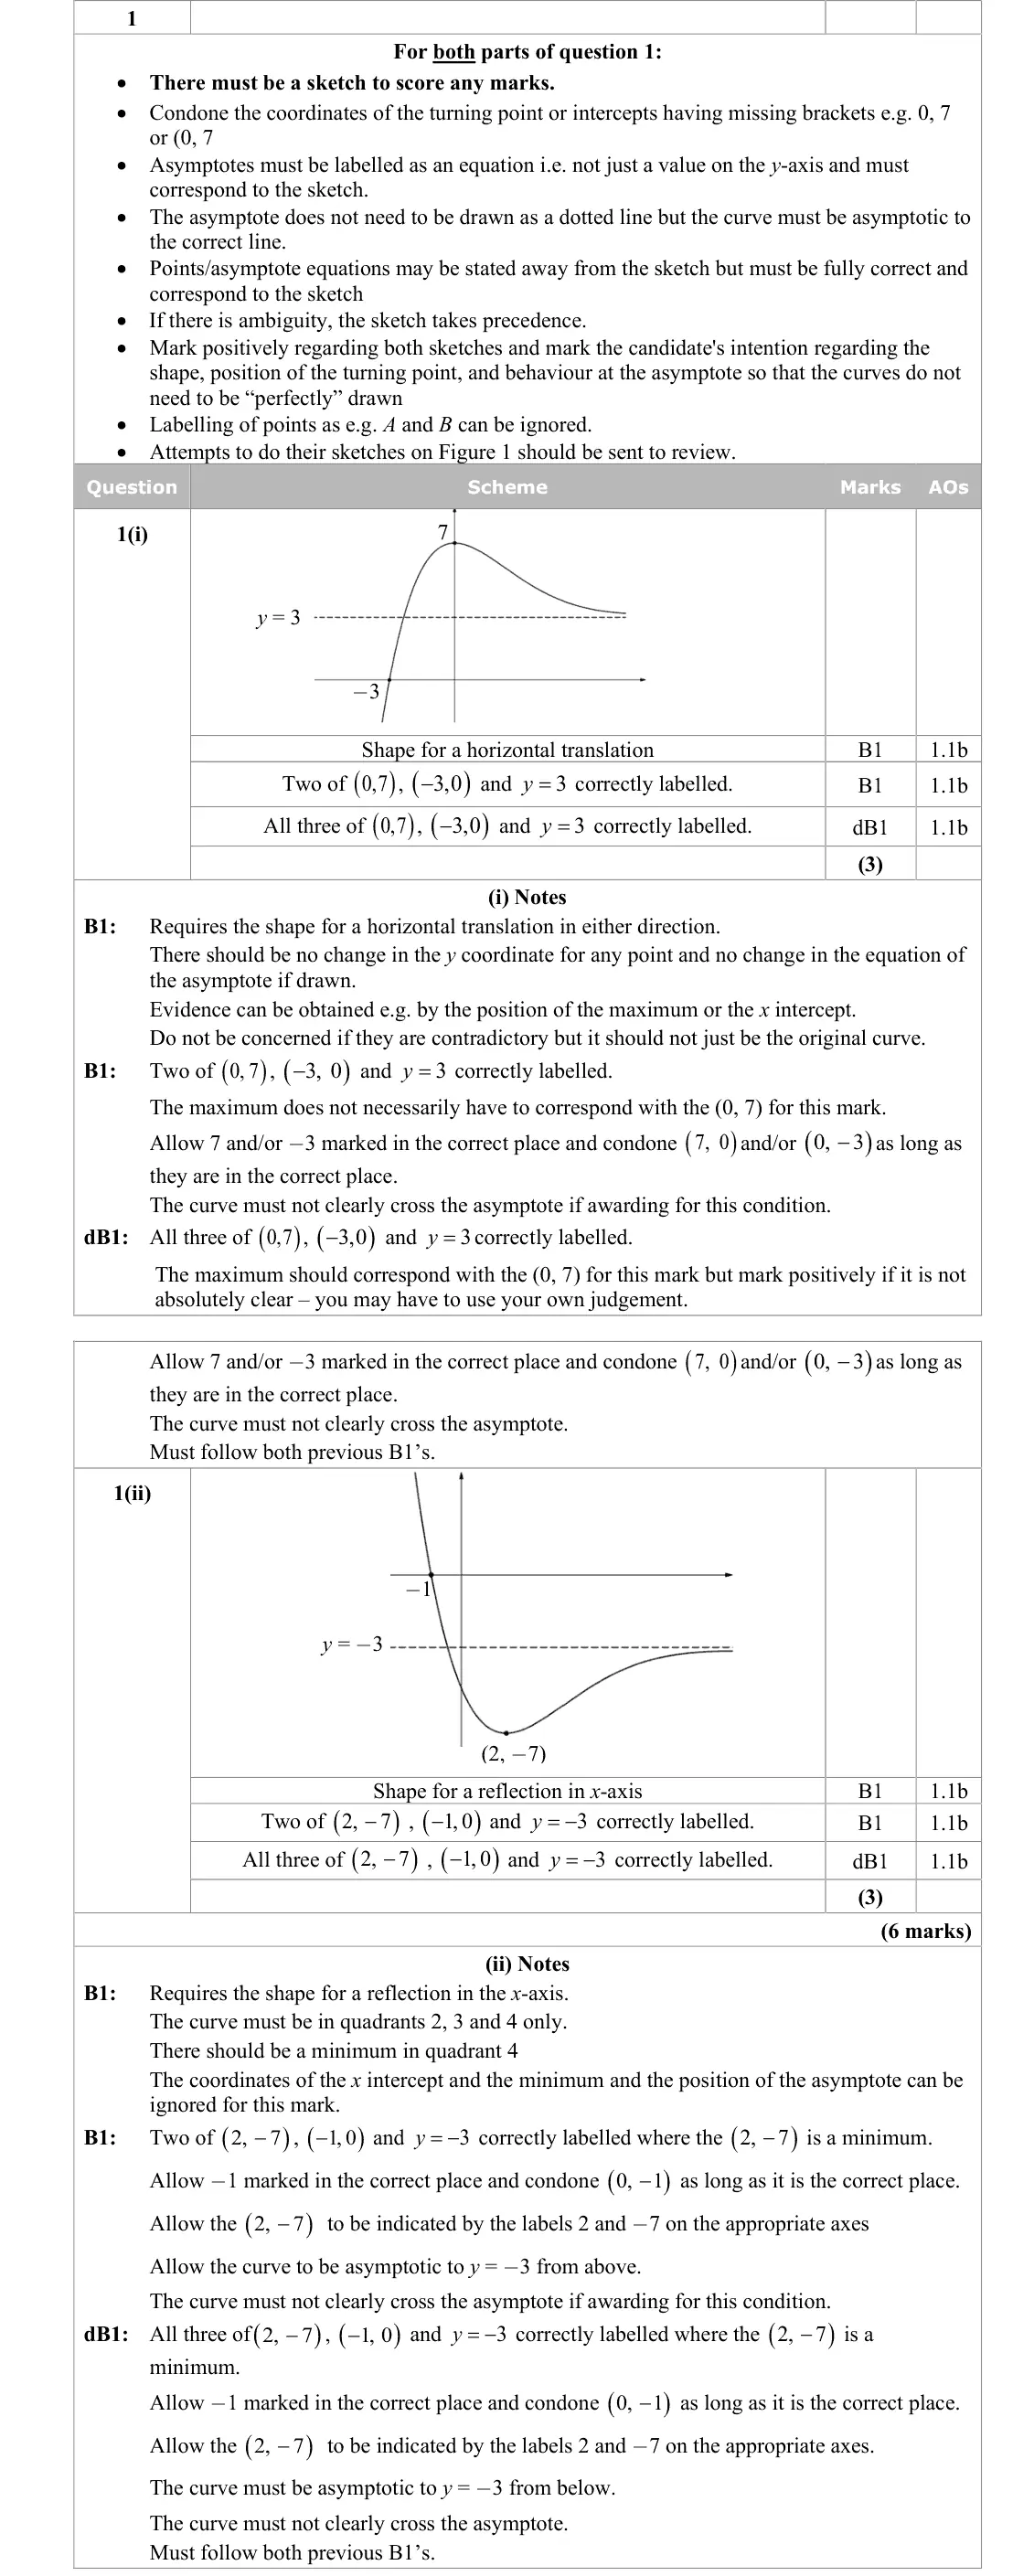
For part (i), y = f (x + 2) was generally drawn well, with most candidates achieving the correct horizontal translation with correct points and the correct asymptote labelled. The most common mistake was to translate the curve to the right, and therefore only scoring the first mark. A few students added 2 to the y-coordinates of each point, attempting an upwards translation. While there were many good sketches with many candidates scoring full marks on this part of the question, there were also a lot of careless sketches with the maximum not clearly being on the y-axis and curves crossing or curving away from the asymptote. Most wrote their coordinates and the equation of the asymptote correctly. Part (ii) was not answered as well as part (i) with a variety of different mistakes for the curve y = -f (x), the most common being to reflect the curve in the y-axis. Some candidates correctly reflected the curve in the x-axis but did not change the asymptote from y = 3 to y = -3. Sometimes this mistake lost all 3 marks because the curve was partly drawn in quadrant 1. Others translated the curve or found incorrect coordinates. Again, some curves were drawn poorly, so that the main features were not clearly identifiable and the coordinates unclear. The point (2,-7) was often not at the minimum point and frequently the curve did not tend towards the asymptote.
Common mistakes
f(x + 2) is a translation 2 to the LEFT: maximum at (0, 7), x-intercept (−3, 0), asymptote still y = 3
translating right or adding 2 to y
maximum not clearly on the y-axis
curve crossing or curving away from the asymptote
asymptote must be labelled as an equation
June 2025 · AS Paper 1 · Q1(ii)3 marks
Mark scheme (whole question; this part is marked with the orange bar)
Examiner's comment
For part (i), y = f (x + 2) was generally drawn well, with most candidates achieving the correct horizontal translation with correct points and the correct asymptote labelled. The most common mistake was to translate the curve to the right, and therefore only scoring the first mark. A few students added 2 to the y-coordinates of each point, attempting an upwards translation. While there were many good sketches with many candidates scoring full marks on this part of the question, there were also a lot of careless sketches with the maximum not clearly being on the y-axis and curves crossing or curving away from the asymptote. Most wrote their coordinates and the equation of the asymptote correctly. Part (ii) was not answered as well as part (i) with a variety of different mistakes for the curve y = -f (x), the most common being to reflect the curve in the y-axis. Some candidates correctly reflected the curve in the x-axis but did not change the asymptote from y = 3 to y = -3. Sometimes this mistake lost all 3 marks because the curve was partly drawn in quadrant 1. Others translated the curve or found incorrect coordinates. Again, some curves were drawn poorly, so that the main features were not clearly identifiable and the coordinates unclear. The point (2,-7) was often not at the minimum point and frequently the curve did not tend towards the asymptote.
Common mistakes
−f(x) is a reflection in the x-axis: minimum (2, −7), intercept (−1, 0), asymptote y = −3
reflecting in the y-axis is the commonest error
June 2025 · Paper 1 · Q1(a)1 mark
Mark scheme (whole question; this part is marked with the orange bar)
Examiner's comment
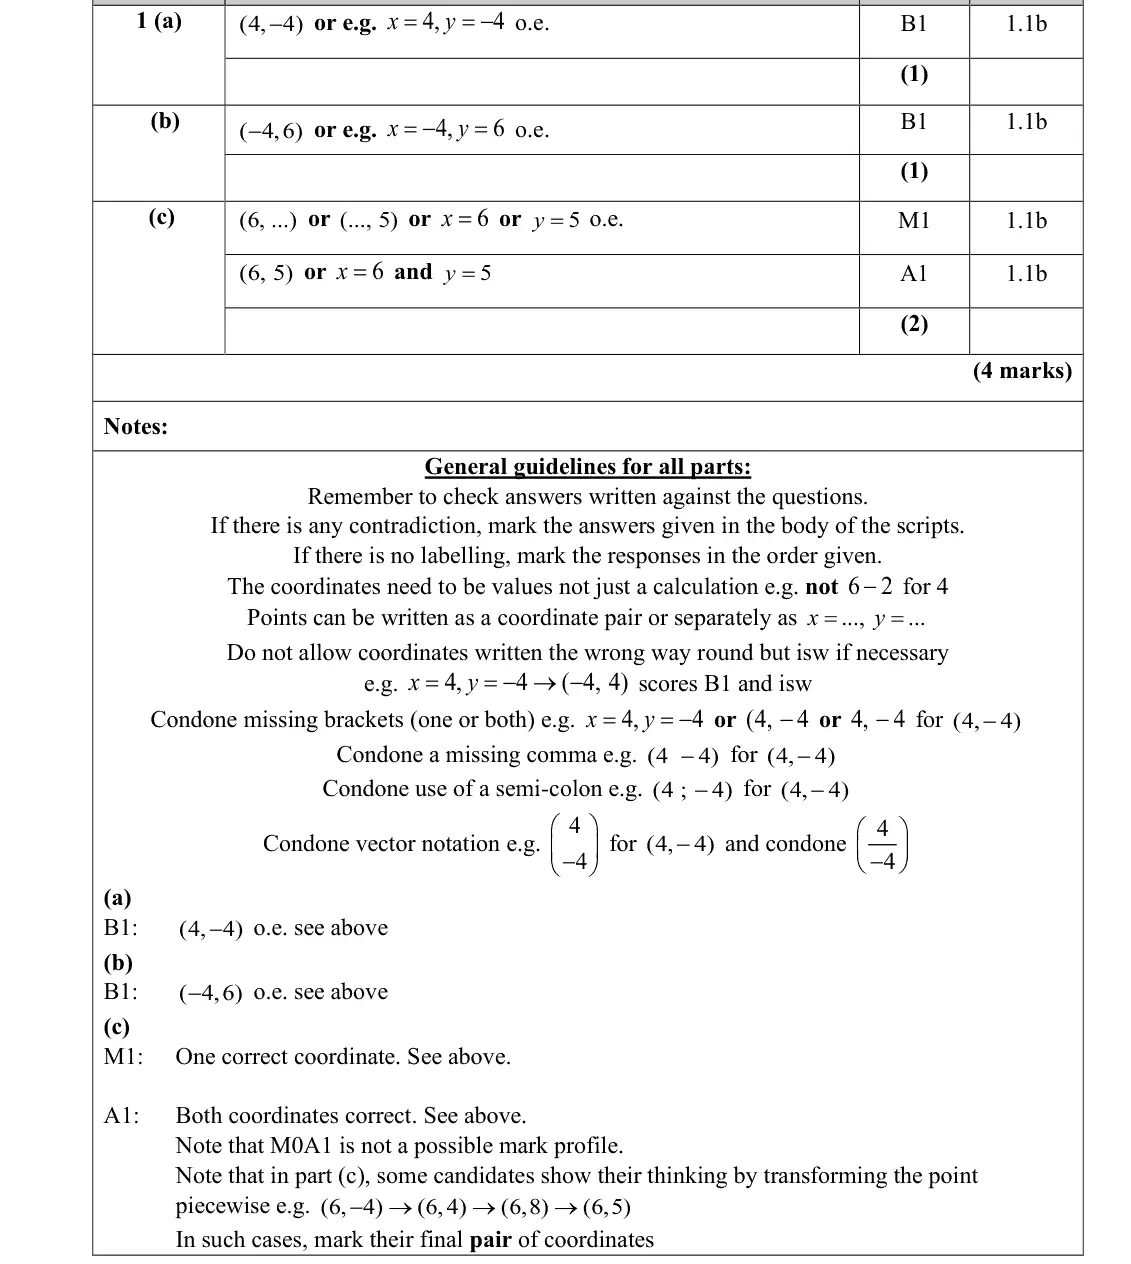
This question required learners to apply a transformation to a point in an unknown function and identify the new coordinates. However, many found it more challenging than was likely intended. In part (a), the majority of responses scored the first mark for their coordinate (4, 4) - . Where errors were seen, these were usually because the learner had translated in the y- direction or the wrong x-direction.
Common mistakes
f(x + 2) is a translation of 2 to the left: (6, −4) → (4, −4)
errors translating in the y-direction or to the right
June 2025 · Paper 1 · Q1(b)1 mark
Mark scheme (whole question; this part is marked with the orange bar)
Examiner's comment
This question required learners to apply a transformation to a point in an unknown function and identify the new coordinates. However, many found it more challenging than was likely intended. Part (b) proved to be the most challenging element of the question. A significant number of responses did not recognise that finding the inverse function required reflecting a point in the line y x = , where they just needed to swap the coordinates. Instead, many attempted incorrect transformations, such as reflecting in the x- or y-axis, swapping signs, or confusing the inverse with the reciprocal function. Common incorrect responses included ( ) 6, 4 - , ( ) 4, 6 - , 1 6, 4 - , and 1 1 , 6 4 - , indicating misunderstanding of the effect of an inverse function on a coordinate. The notation also appeared to cause confusion for some. Overall, very few correct responses were seen, and this part of the question successfully discriminated between stronger and weaker learners.
Common mistakes
the graph of the inverse is the reflection in y = x, so swap the coordinates: (−4, 6)
common errors (6, 4), (−4, −6), reciprocals such as (1/6, −1/4) (confusing inverse with reciprocal)
very few correct
June 2025 · Paper 1 · Q1(c)2 marks
Mark scheme (whole question; this part is marked with the orange bar)
Examiner's comment
This question required learners to apply a transformation to a point in an unknown function and identify the new coordinates. However, many found it more challenging than was likely intended. Part (c) required learners to apply a sequence of transformations to a coordinate. Although full methods were not required, those who sketched diagrams or worked step by step were generally more successful, often gaining credit for identifying the correct x coordinate. A few responses showed initiative by creating their own version of the function to support their working. However, many responses did not have a clear structure, which limited access to full marks. A common error was not applying the modulus correctly. Many learners evaluated ( ) 2 4 3 11 x - - = - giving the incorrect coordinate ( ) 6, 11 , - rather than applying the modulus: 2 4 3 5 x - -= ∣∣ , giving the correct y coordinate. This suggests that while the structure of the transformation was understood, accuracy in execution was sometimes lacking. Other frequent incorrect answers included: ( ) 12, 5 , where the x-value was incorrectly doubled, ( ) 6, 3 , from adding rather than multiplying and ( ) 9, 4 - , due to changing x instead of y. 5
Common mistakes
modulus first: 2 × (modulus of −4) − 3 = 5, so (6, 5)
common errors (6, −11) ignoring the modulus, (12, 5) doubling x, (6, 3), (9, −4)
working step by step helps
June 2025 · Paper 1 · Q7(c)2 marks
Mark scheme (whole question; this part is marked with the orange bar)
Examiner's comment
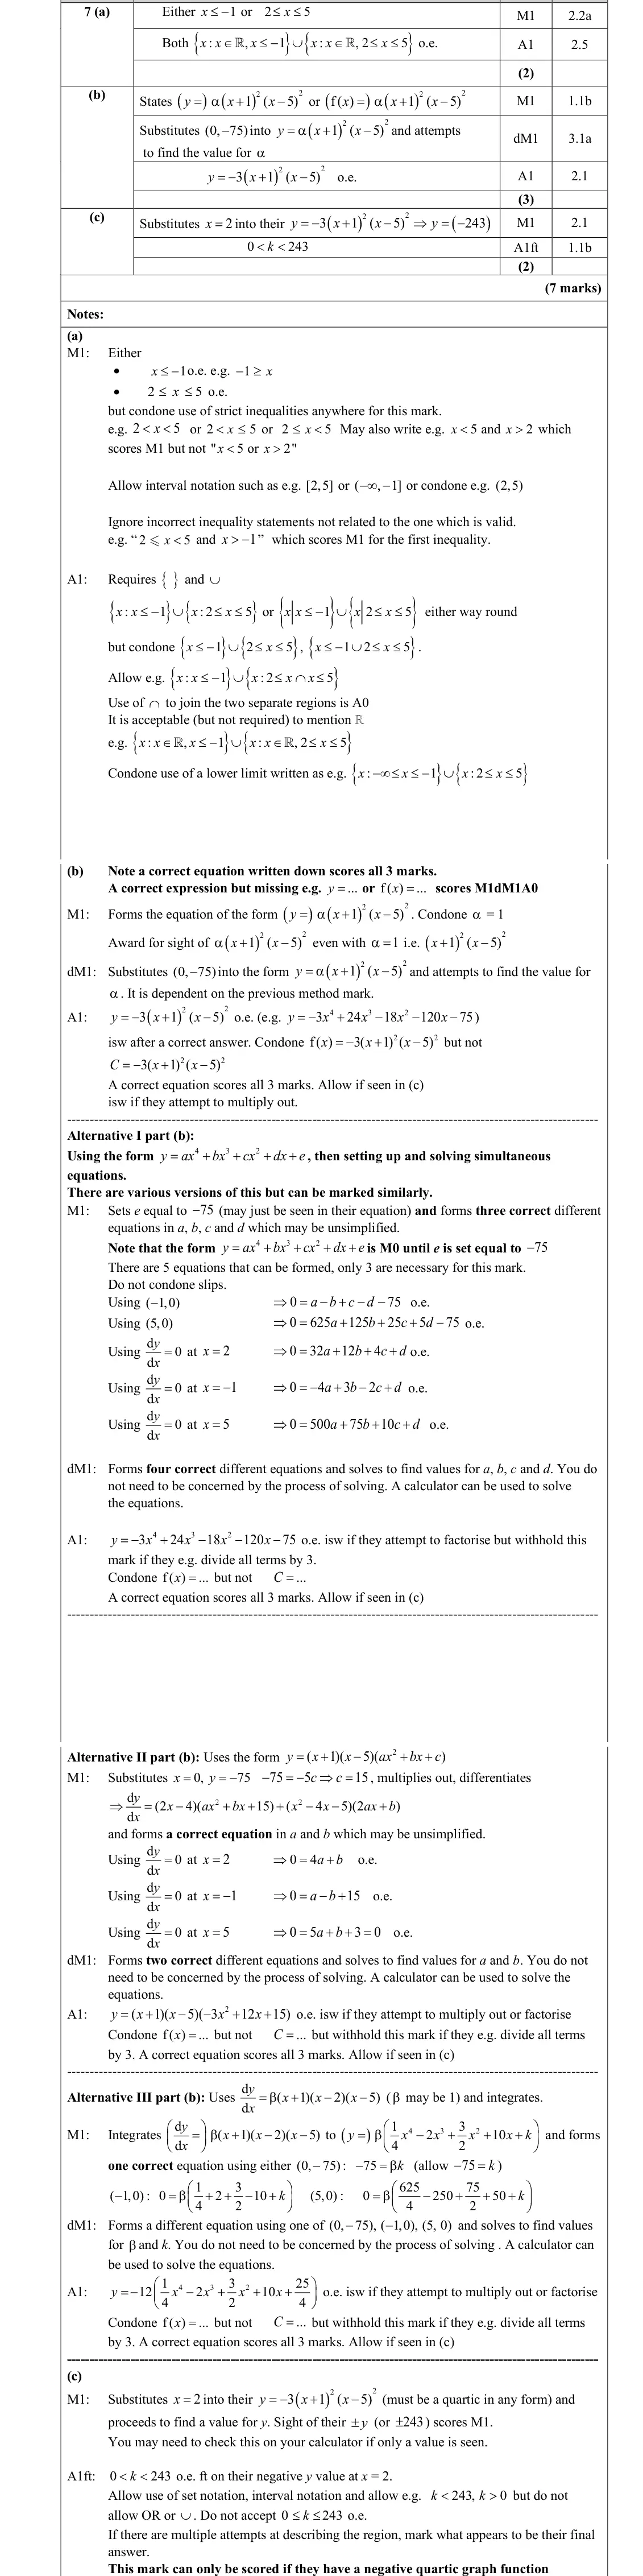
This was the first question on the paper where there was wide discrimination between the marks of responses, and many struggled with knowing how to handle a quartic function. Part (c) involved assuming that the quartic intersects the x-axis at exactly four places with the aim to find the range of possible translation factors of the curve. Many responses found the y coordinate of the local minimum. Those who found a quartic in part (b) were often successful at this. Common errors were not appropriately using the y coordinate to describe the translation factor or not considering the minimum value. Those with positive quartic functions could not score the final mark as the figure provided already showed that this was not the case. 12
Common mistakes
minimum at x = 2 has y = −243, so shift up by between 0 and 243: 0 < k < 243 (strict)
needs a negative quartic from (b)
June 2025 · Paper 2 · Q12(c)4 marks
Mark scheme (whole question; this part is marked with the orange bar)
Examiner's comment
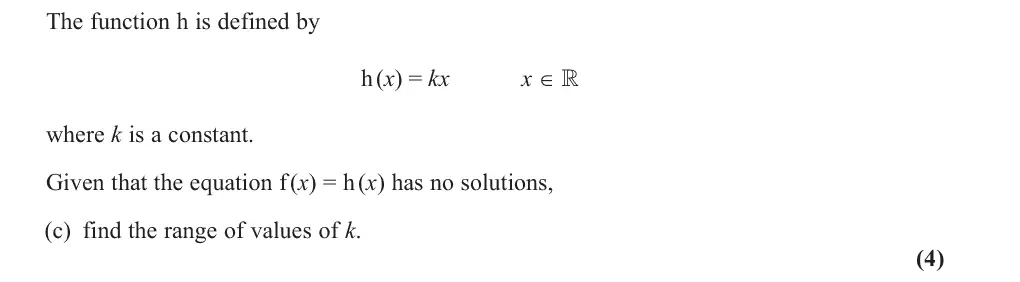
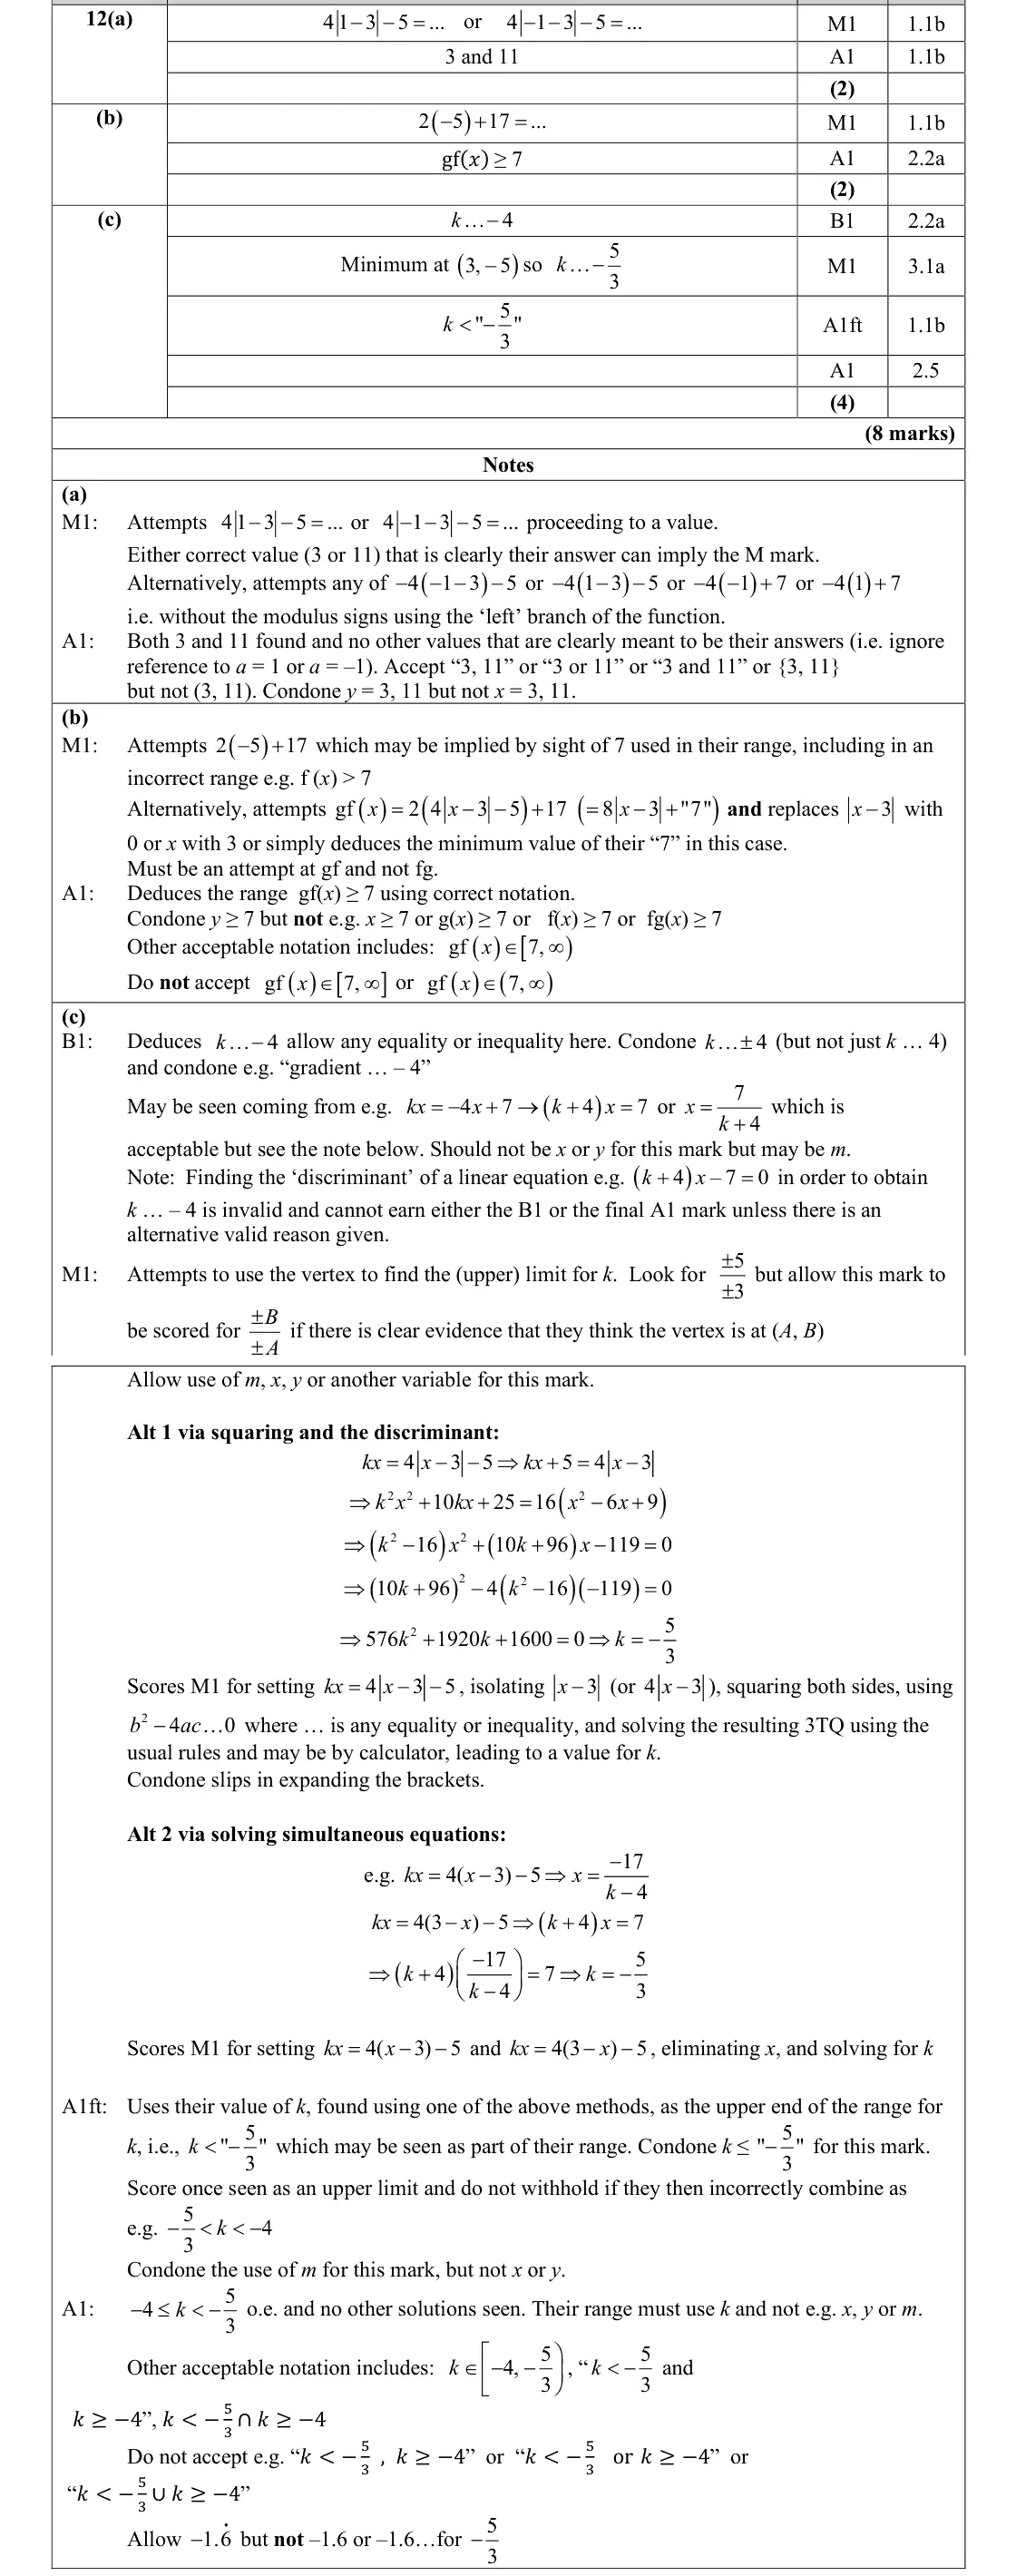
This question, assessing understanding of modulus functions, composite functions and the range, was accessible to almost all learners. Generally, responses scored well on the first two parts but did not find a simple strategy for the last part. Learners found part (c) difficult, and many scored few marks as a result. This part is not dissimilar to questions from previous series but the idea of there being no solutions clearly caused greater difficulties for some. Those who were most successful approached the question thinking graphically, drawing on the given graph a line from the origin to the vertex, finding the gradient, then realising the gradient was between this value and –4 (inclusive of –4). Often the strict inequality for –4 was given and did not gain the final mark, but on the whole this approach was quick and successful. Other responses showed one of the more difficult routes to finding the upper limit for k and invariably had processing errors at some stage. Finally, many responses considered that a discriminant had to be involved because the question mentioned there being “no solutions”, however for most this ended up with them trying to find the discriminant of expressions that were not quadratic.
Common mistakes
lines y = kx through O: parallel to the left branch at k = −4 (no solutions, included) up to the line through the vertex (3, −5), k = −5/3
−4 ≤ k < −5/3 (strict −4 loses the final mark)
discriminant of a linear equation is invalid
June 2024 · AS Paper 1 · Q2(c)2 marks
Mark scheme (whole question; this part is marked with the orange bar)
Examiner's comment
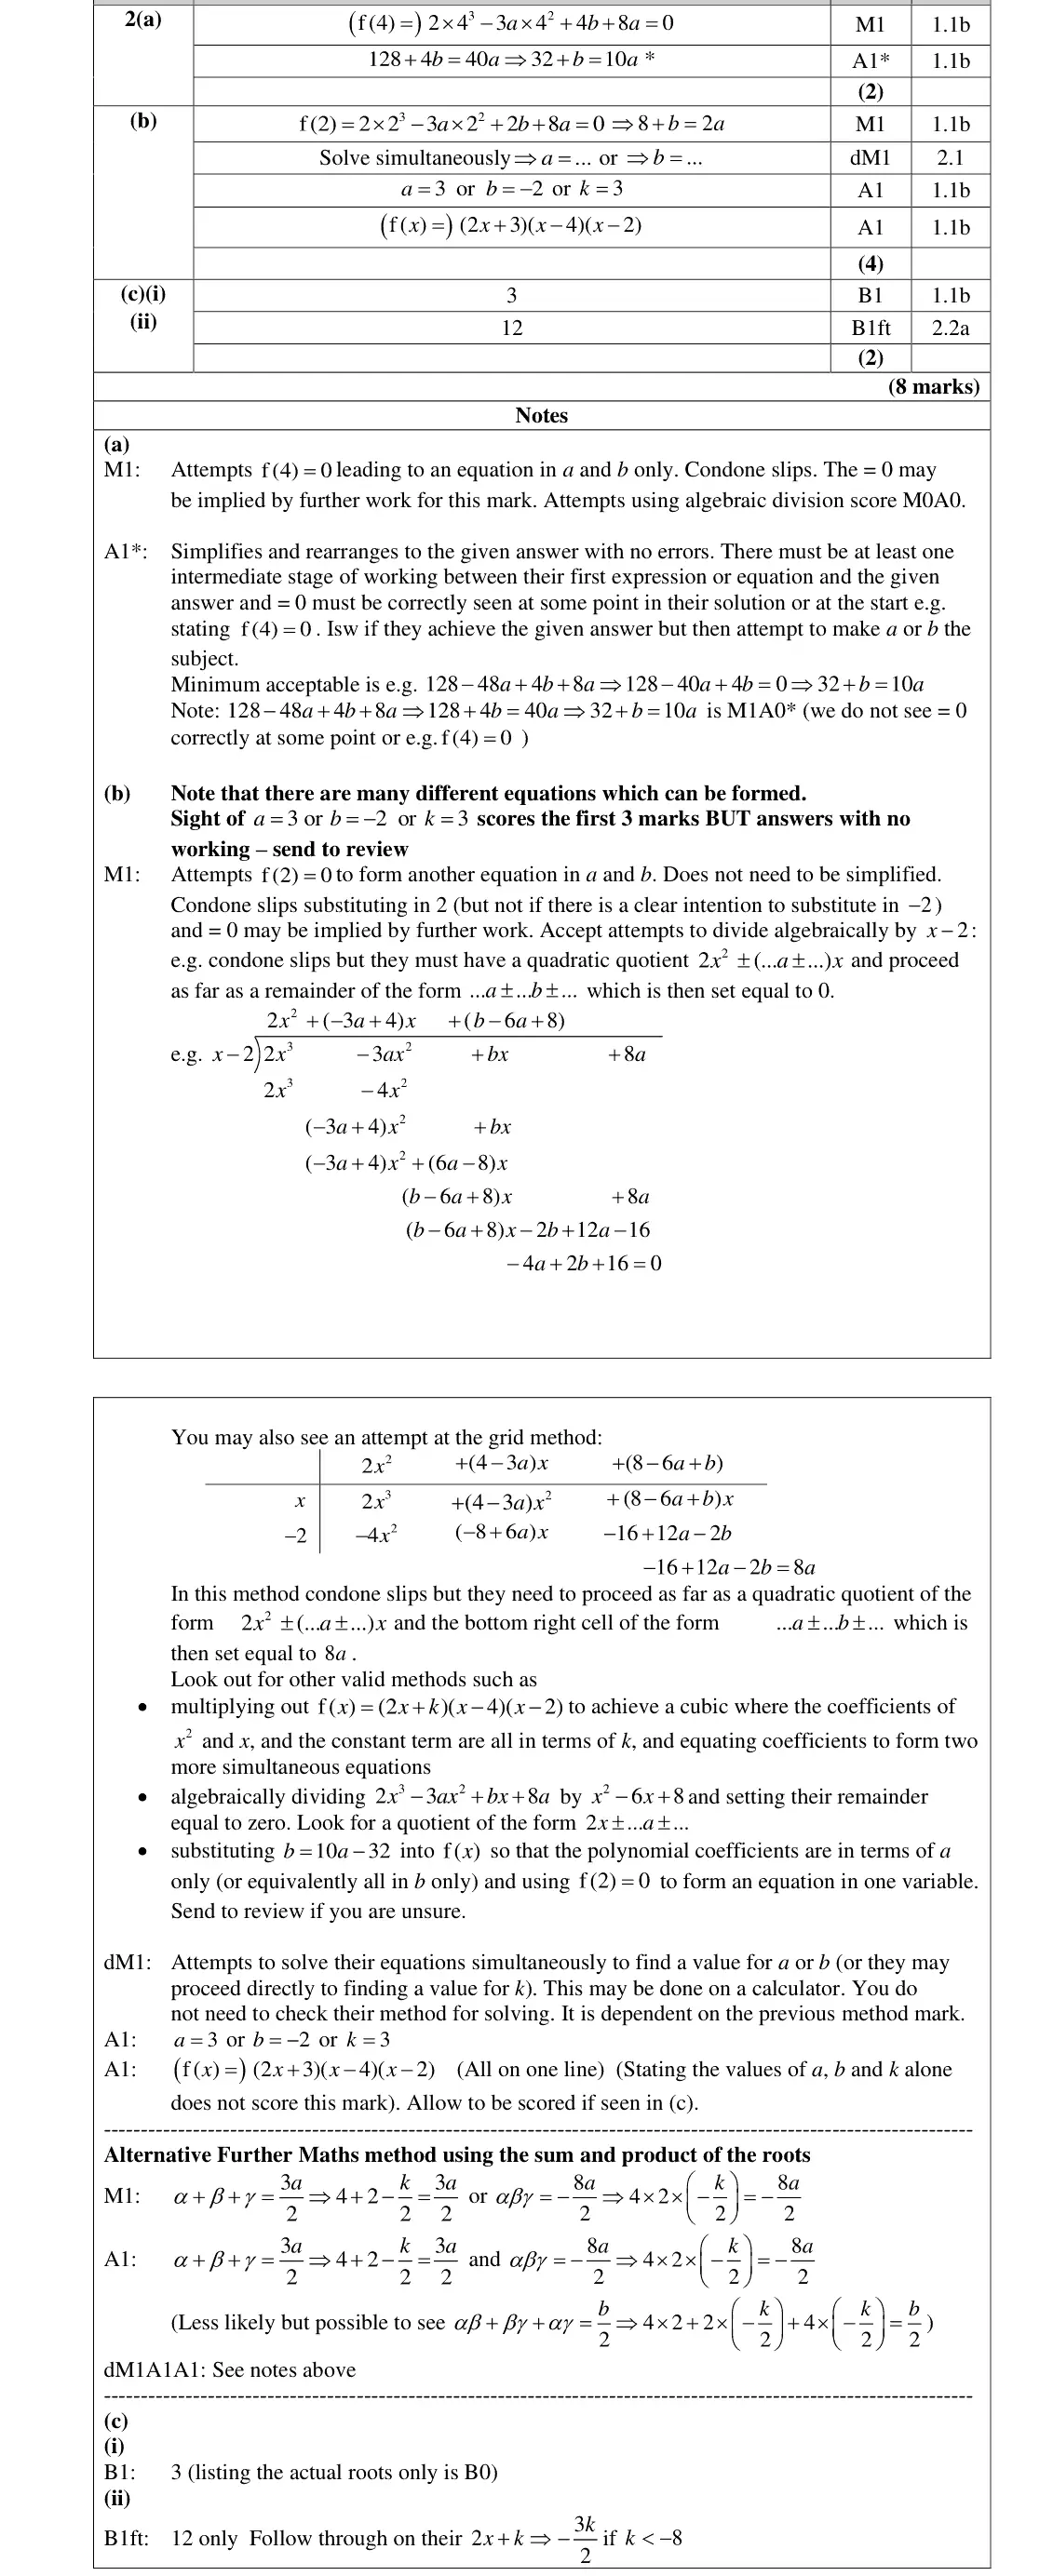
This question which required use of the factor theorem and solving simultaneous equations provided an opportunity to score a good number of marks. Some candidates found this question to be accessible and scored full marks or nearly full marks. Others however, encountered difficulties, particularly with part (b) and dropped marks accordingly. Some candidates lost marks because they did not pay heed to the instruction to show all stages of their working. Part (c) was answered quite well, even by those who had made little or no progress in part (a) or part (b). In part (i) many identified that there were three real roots, although stating that there were two real roots was a common incorrect answer. Some also lost the mark because they listed the roots without stating how many there were. In part (ii) many realised that the largest root was 12, although 4 3 was a common incorrect answer.
Common mistakes
(i) state "3", listing the roots alone scores 0
2 is a common wrong answer
(ii) f(x/3) = 0 is a stretch scale factor 3 so largest root 3 × 4 = 12 (4/3 is a common wrong answer)
June 2024 · AS Paper 1 · Q5(a)3 marks
Mark scheme (whole question; this part is marked with the orange bar)
Examiner's comment
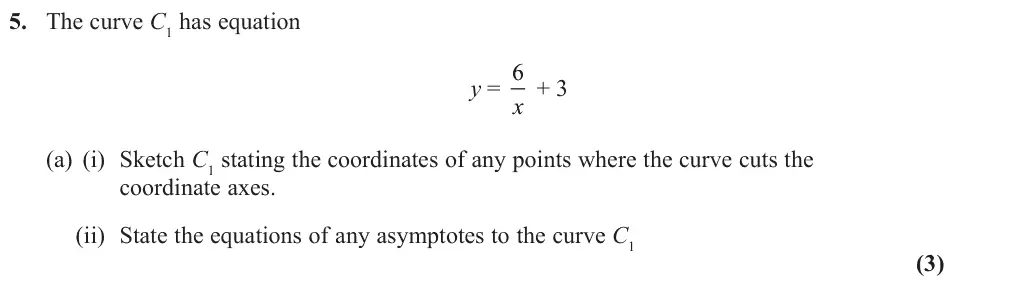
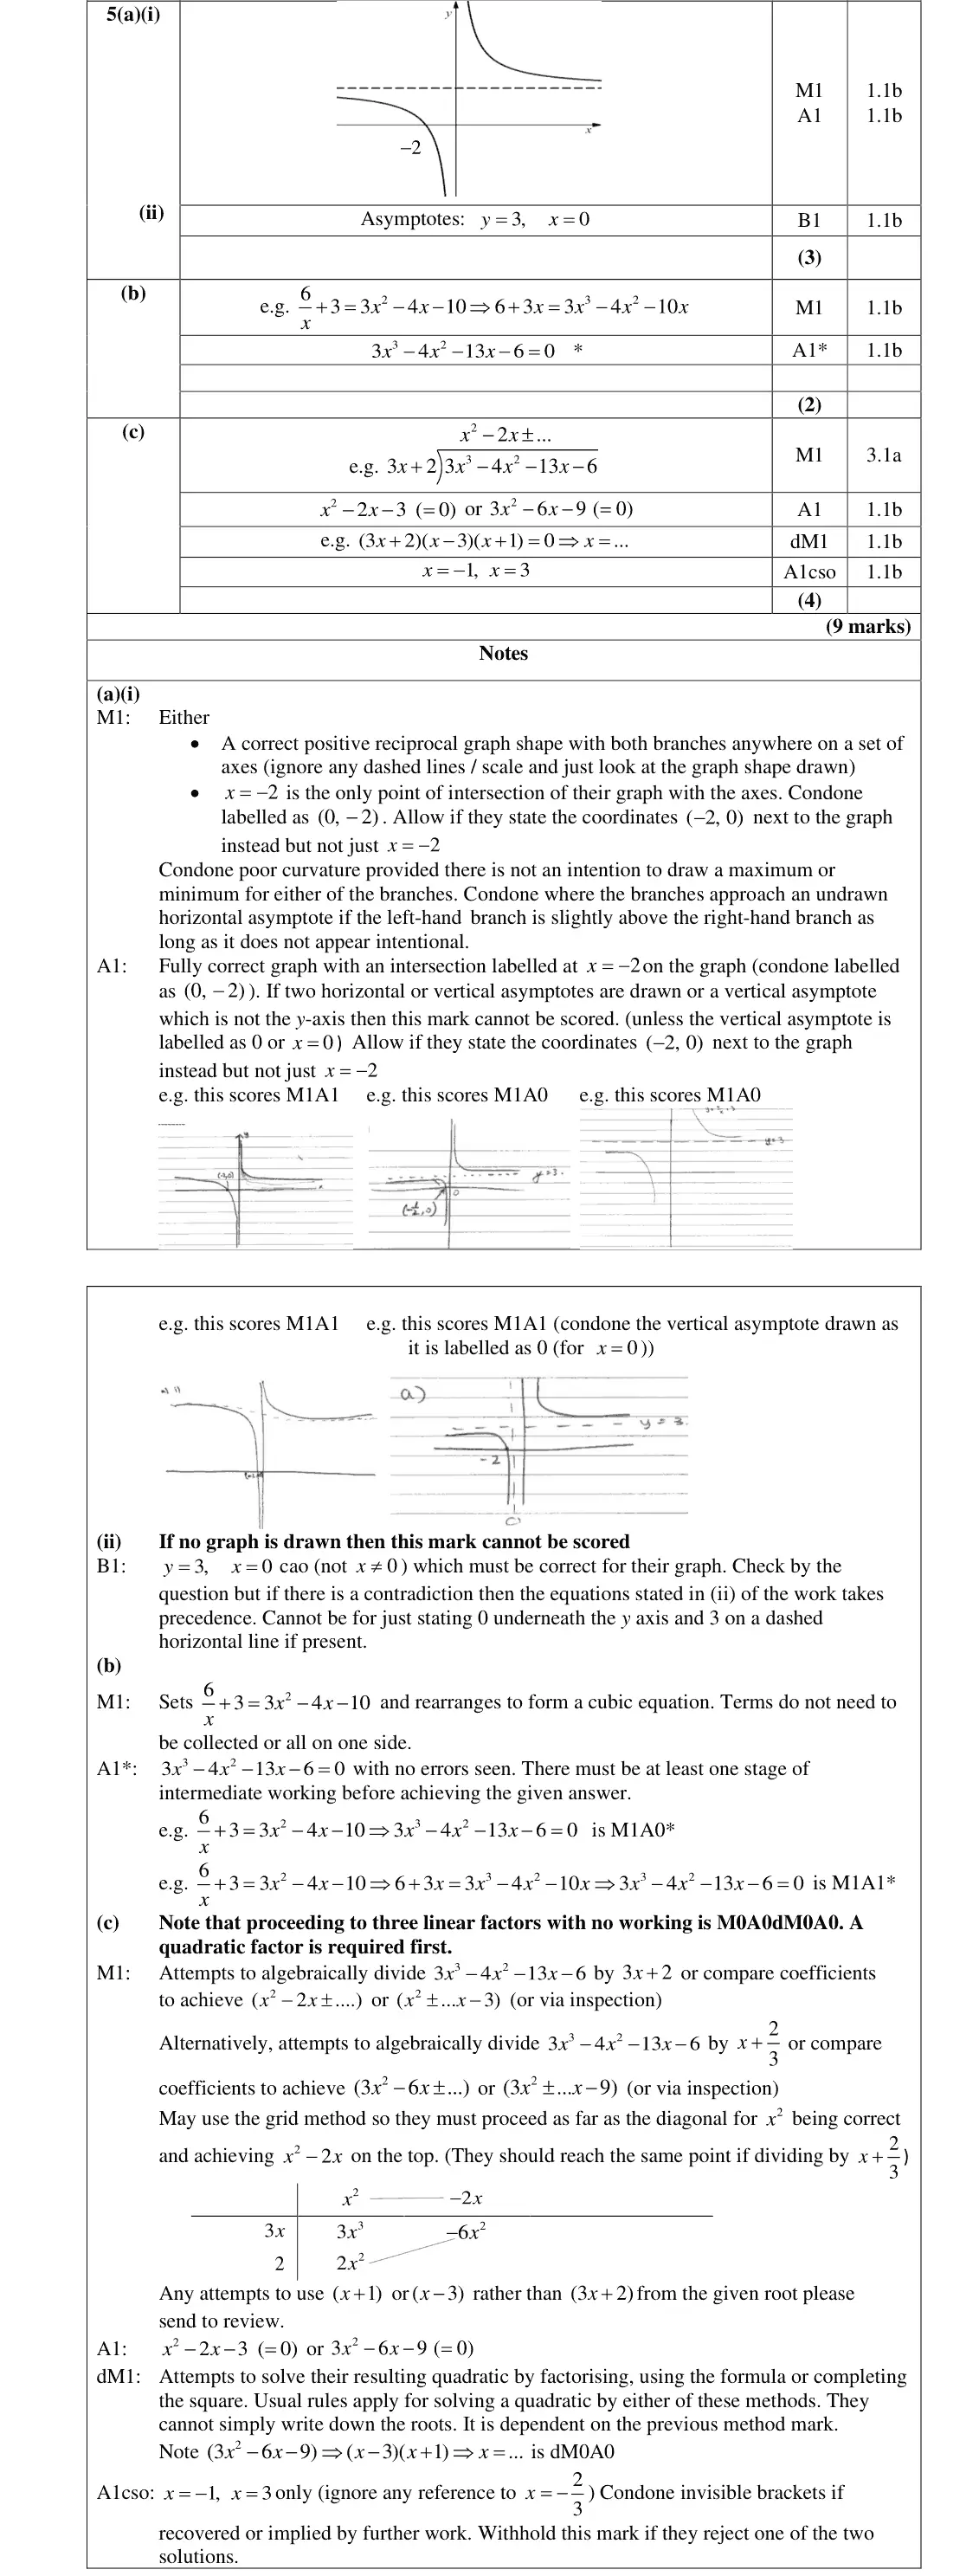
This question tested candidates’ ability to sketch graphs and to be able to divide polynomials. Part (a) required the sketching of a reciprocal graph. A significant proportion of candidates did not even attempt to sketch the graph; those that did often produced a good positive reciprocal graph with both branches, scoring the first mark. The second mark proved harder with many graphs being in the wrong place, with an extra asymptote and the x intercept not labelled. The y- axis with a dashed line next to it also resulted in losing the second mark as candidates were not aware that this was implying that their asymptote was not the y-axis. Part (a)(ii) required both the y = x = 3 0 equations of both asymptotes: was common but was not seen as often.
Common mistakes
y = 6/x translated up 3: both branches, crossing the x-axis only at (−2, 0)
asymptotes y = 3 and x = 0 (the y-axis, not a separate dashed line)
x ≠ 0 is not an equation
June 2024 · Paper 1 · Q6(a)2 marks
Mark scheme (whole question; this part is marked with the orange bar)
Examiner's comment
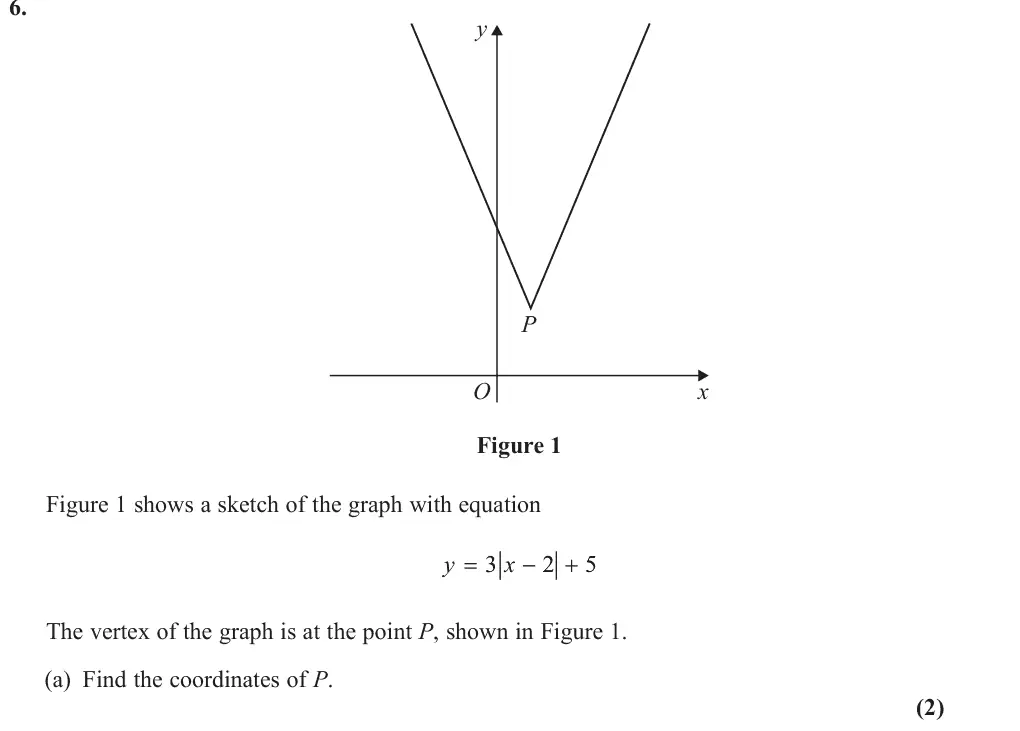
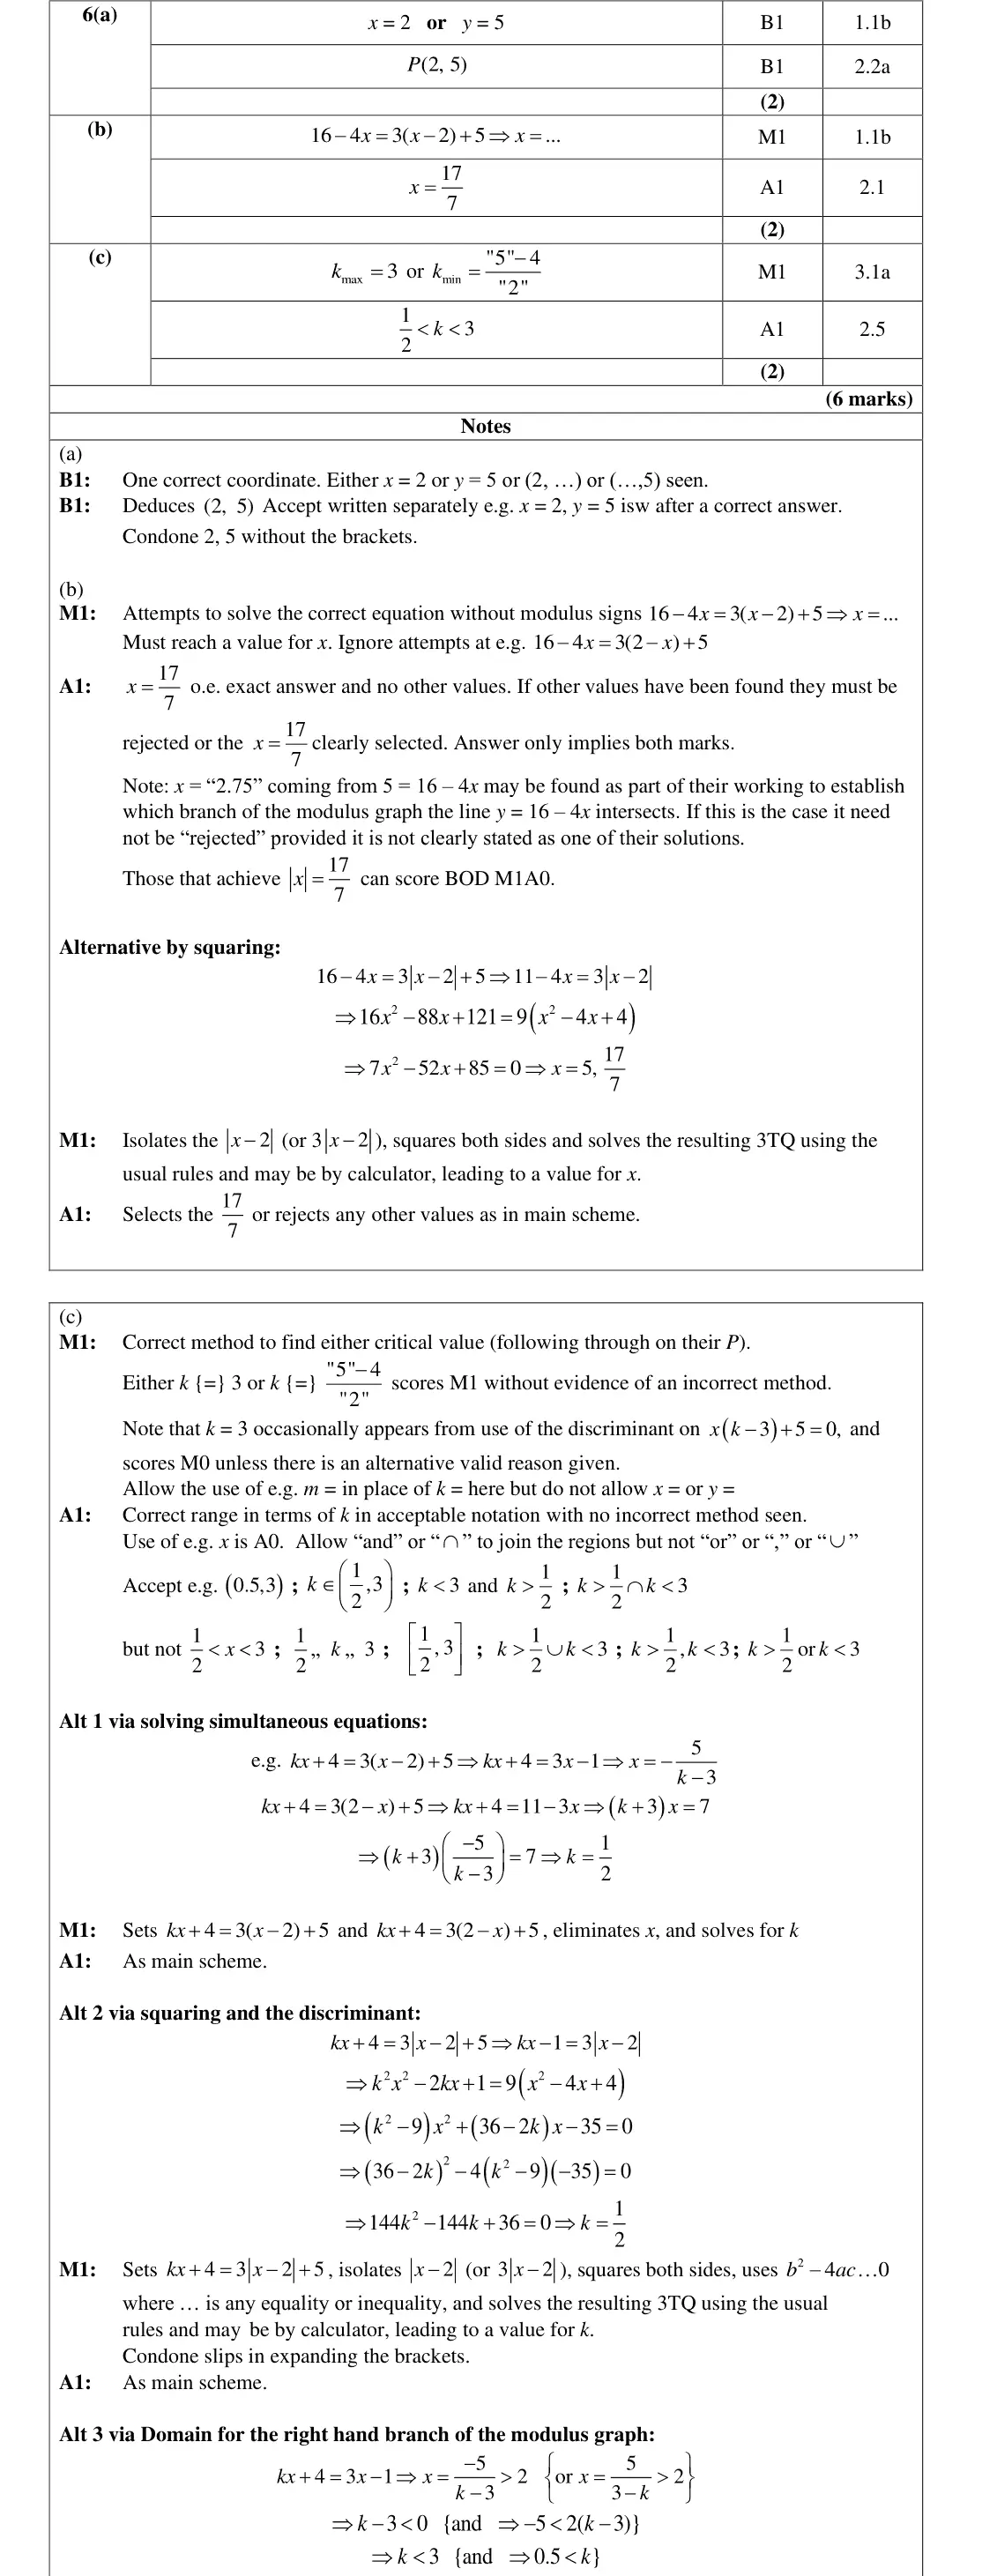
This question on the modulus function provided plenty of access and there were very few blank responses to any part, although many found part (c) challenging. The overwhelming majority of candidates answered part (a) correctly, demonstrating a strong understanding that the minimum y value must occur when 2 0 x - = . The answer was often written down without working. Those candidates that did not gain full marks often achieved the method mark for one correct coordinate. The majority of candidates who scored no marks found the y intercept of the modulus curve instead.
Common mistakes
vertex where x − 2 = 0, so P(2, 5)
giving the y-intercept is the common wrong answer
June 2024 · Paper 2 · Q34 marks
Mark scheme (whole question; this part is marked with the orange bar)
Examiner's comment
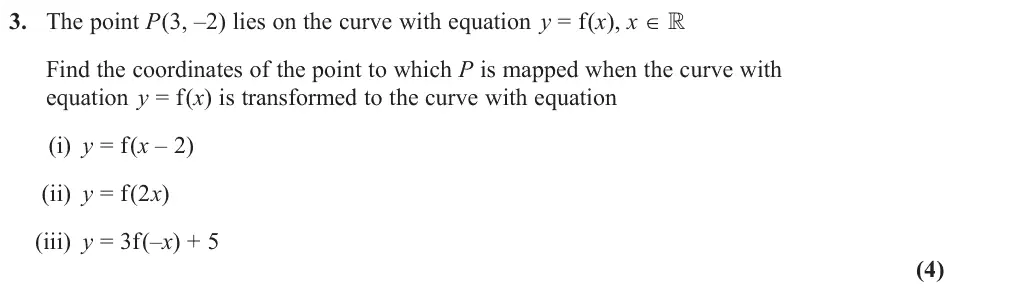
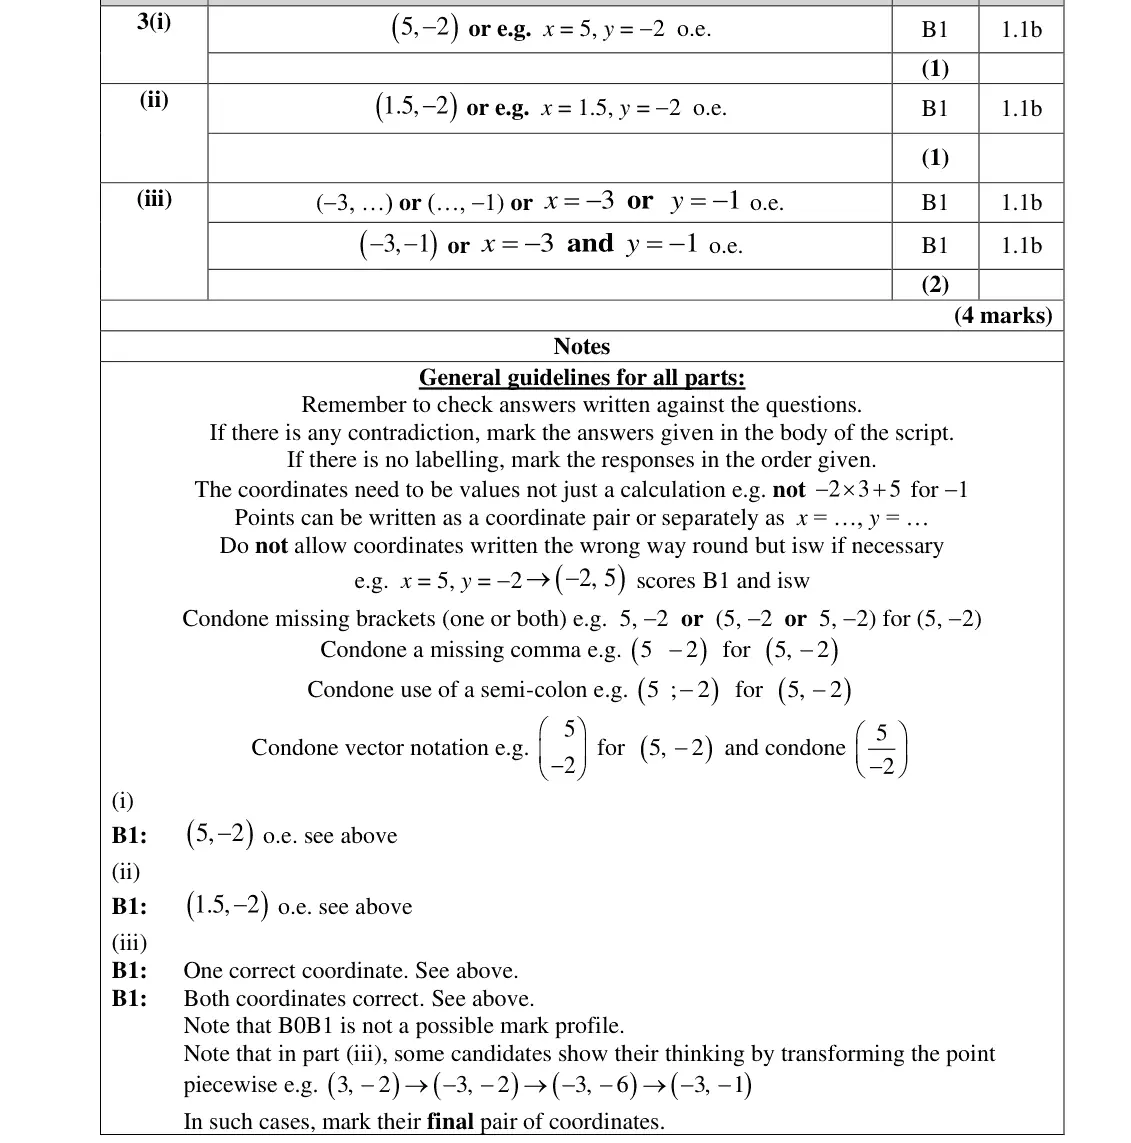
This question was very effective at highlighting many candidates’ misconceptions about the relationship between function notation and graph transformations. Whilst the majority of candidates coped well with single transformations, a significant proportion demonstrated a lack of secure understanding of multi-step transformations. Part (i) presented few difficulties for most candidates. They either understood, or had memorised, that y = f (x - 2) represented a translation by two units in the positive x direction. The most common incorrect answer here was (1, -2) where candidates had confused the direction of the translation. Similarly in part (ii), a large proportion of candidates, though fewer than in part (i), knew that y = f (2x) represented a stretch of scale factor 1 2 in the x direction. Common incorrect answers were (6, -2), from multiplying the x coordinate by 2 instead of dividing, and (3, -4), which came from multiplying the y coordinate by 2. Part (iii) highlighted that many candidates are potentially guessing the net effect of a multi-step transformation rather than separately considering the stepwise effect of the individual transformations. It appears that they are mainly unsure of the order in which the transformations take place and, probably because of this, what effect each step will have, and on which variable. The variety and range of incorrect answers was perhaps surprising. Whilst some candidates provided evidence to explain their logic, most simply wrote an answer. In many cases candidates either scored no marks or both marks here. When just one out of the two marks was earned, there was often little evidence to suggest where the correct and incorrect values had come from. Where piecewise transformations were seen, it was clear, perhaps unsurprisingly that translations were more successfully handled than reflection or stretch transformations and sign errors were fairly common. Some candidates drew small sketches to help visualise the transformations which often proved helpful in achieving the correct answer. Occasionally, other candidates came unstuck by apparently misunderstanding that the transformations for each part of the question should be applied to P(3, -2) rather than sequentially applied to the result of the previous part of the question.
(ii) f(2x) halves x: (1.5, −2) not (6, −2) or (3, −4)
(iii) 3f(−x) + 5: reflect in y-axis, stretch ×3 in y, then up 5 giving (−3, −1)
apply each part to P(3, −2), not to the previous answer
June 2022 · AS Paper 1 · Q2(d)1 mark
Mark scheme (whole question; this part is marked with the orange bar)
Examiner's comment
This question proved to be a successful question for many candidates with many being able to score most of the marks. Part (d) was poorly answered if it was attempted at all. The most common wrong answers seen were 8, 5, 2 - and 400 whilst the correct answer was rarely seen showing poor understanding of the question.
Common mistakes
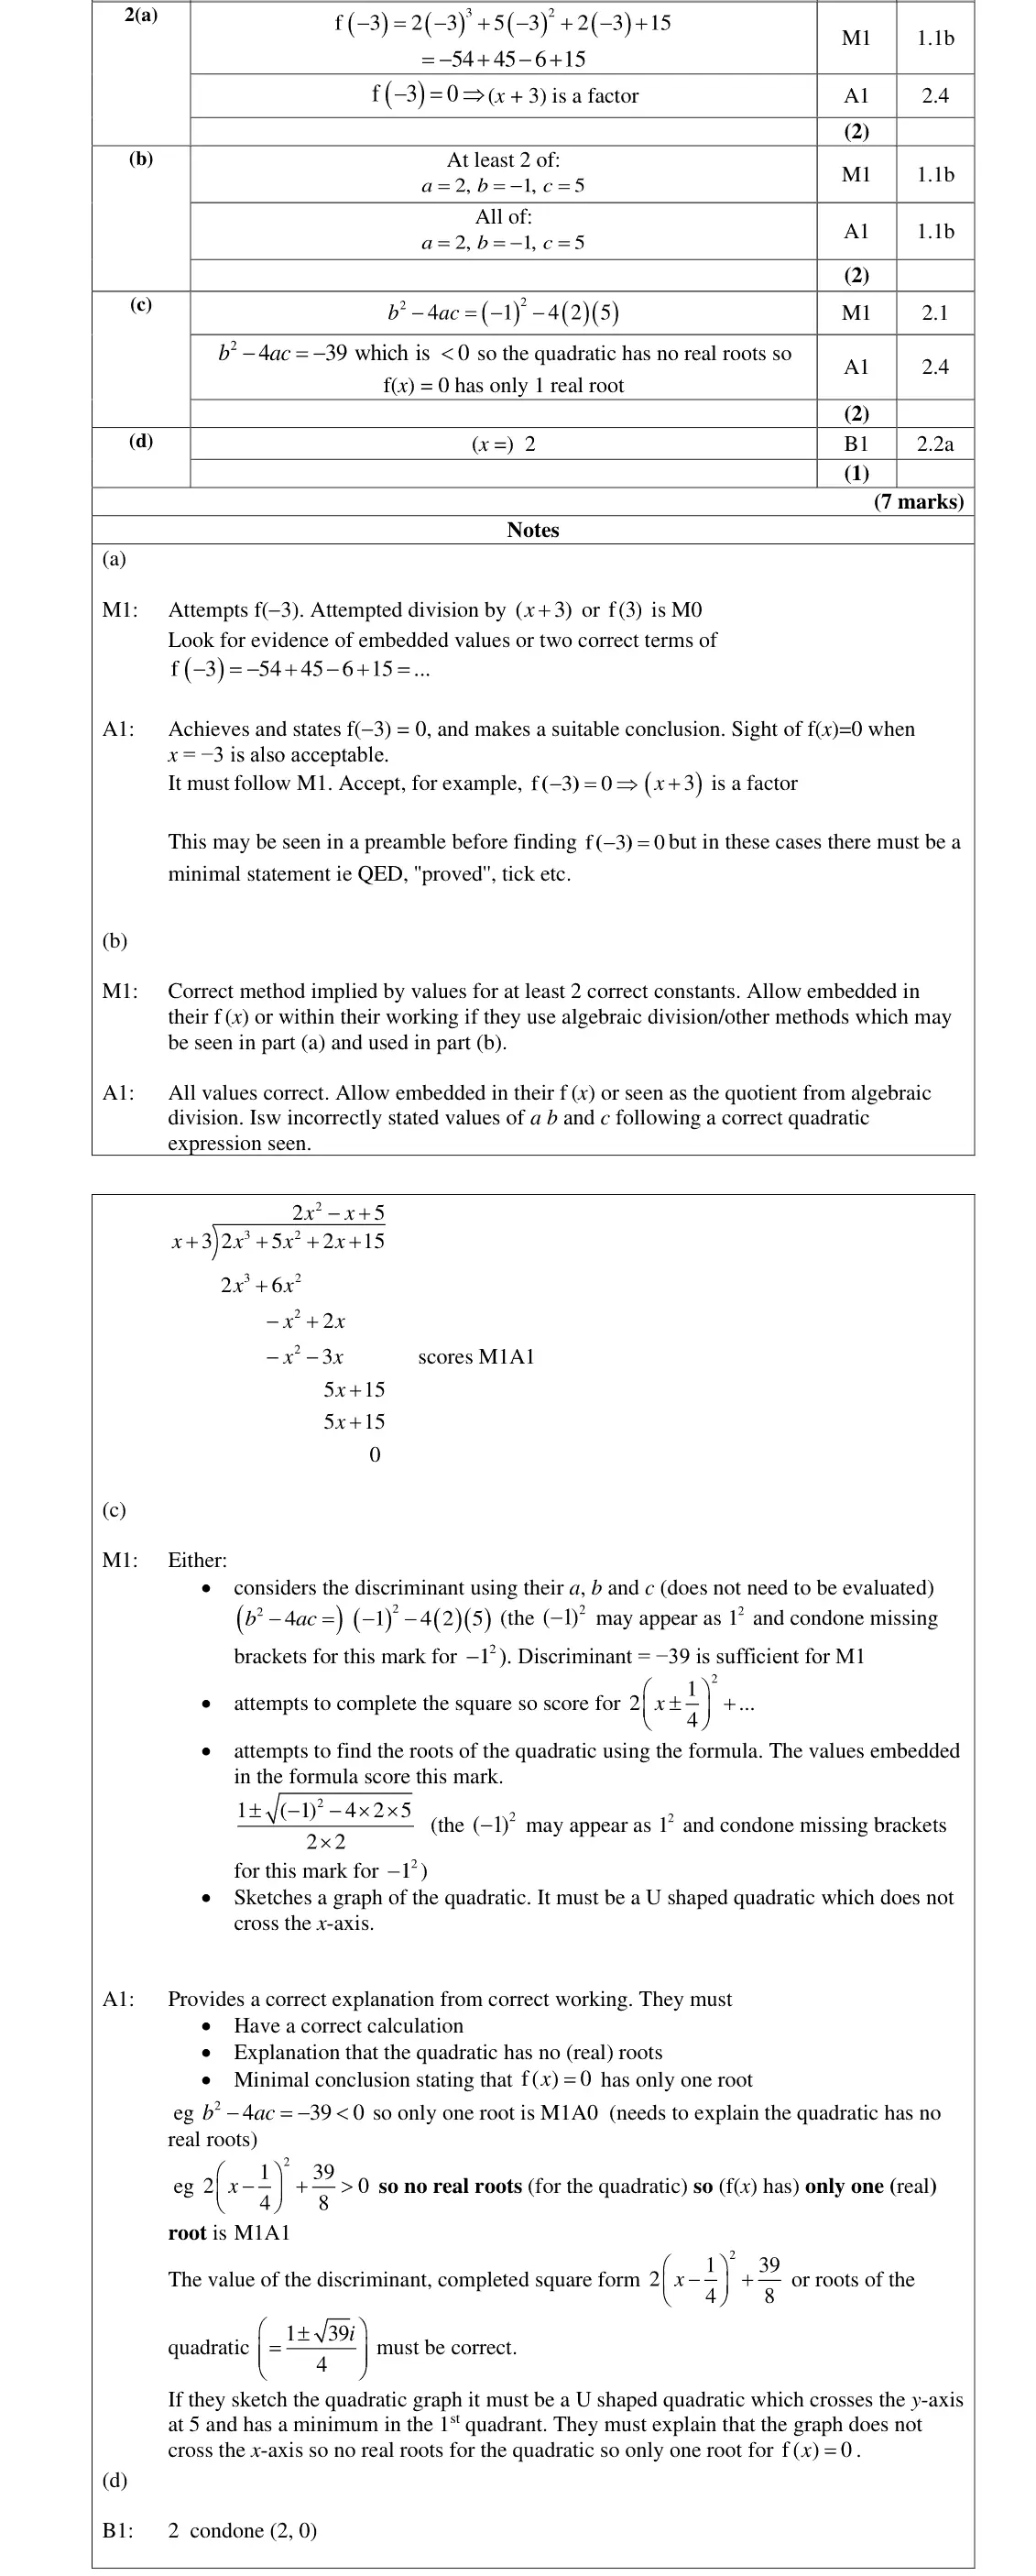
f(x − 5) is a translation 5 to the right, so the root −3 moves to 2
poorly answered (8, 5, −2 common wrong answers)
June 2022 · Paper 1 · Q1(a)1 markEasy
Mark scheme (whole question; this part is marked with the orange bar)
Examiner's comment
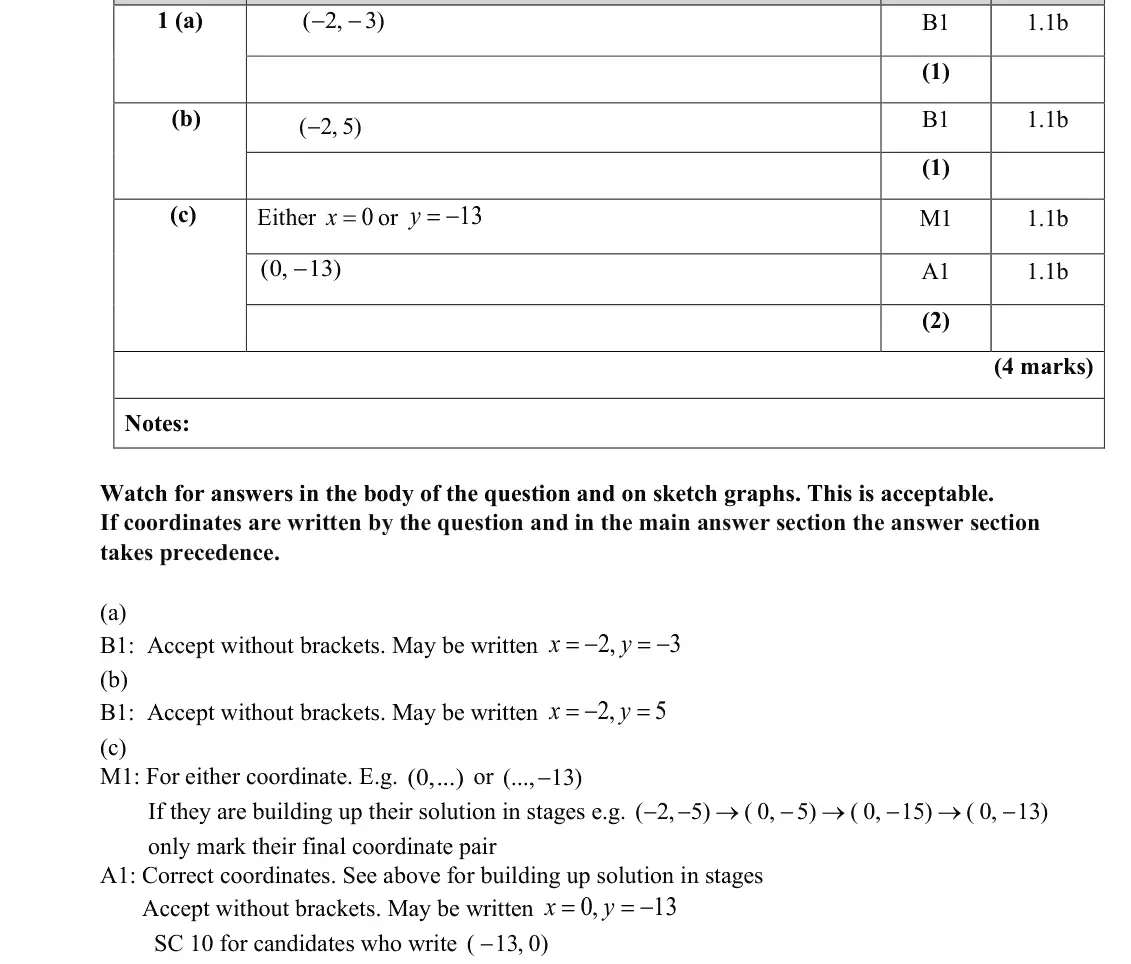
This was an accessible question for virtually all candidates. It asked for the point to which P was mapped, and most candidates gave this as a coordinate pair. Part (a) was frequently correct; candidates identified the translation and applied it successfully.
Common mistakes
translation up 2: (−2, −3)
June 2022 · Paper 1 · Q1(b)1 markEasy
Mark scheme (whole question; this part is marked with the orange bar)
Examiner's comment
This was an accessible question for virtually all candidates. It asked for the point to which P was mapped, and most candidates gave this as a coordinate pair. The attempts at part (b) were less successful. Most solutions used the modulus concept but applied it to both coordinates.
Common mistakes
modulus acts on the y-coordinate only: (−2, 5)
common error applying it to both coordinates, (2, 5)
June 2022 · Paper 1 · Q1(c)2 marksEasy
Mark scheme (whole question; this part is marked with the orange bar)
Examiner's comment
This was an accessible question for virtually all candidates. It asked for the point to which P was mapped, and most candidates gave this as a coordinate pair. Part (c) was a 3-stage transformation and required the candidates to identify both the transformations and the order in which they were to be applied. This was more of a challenge. In particular, the stretch parallel to the y-axis and final translation were mixed up; those who did, generally received some credit as they obtained x = 0. Question % of candidates scoring full marks 1 42% 2 69% 3 39% 4 49% 5 34%
Common mistakes
(−2, −5) → (0, −5) → (0, −15) → (0, −13)
stretch and final translation applied in the wrong order
(−13, 0) is a special case
Oct 2021 · AS Paper 1 · Q16(d)2 marks
Mark scheme (whole question; this part is marked with the orange bar)
Examiner's comment
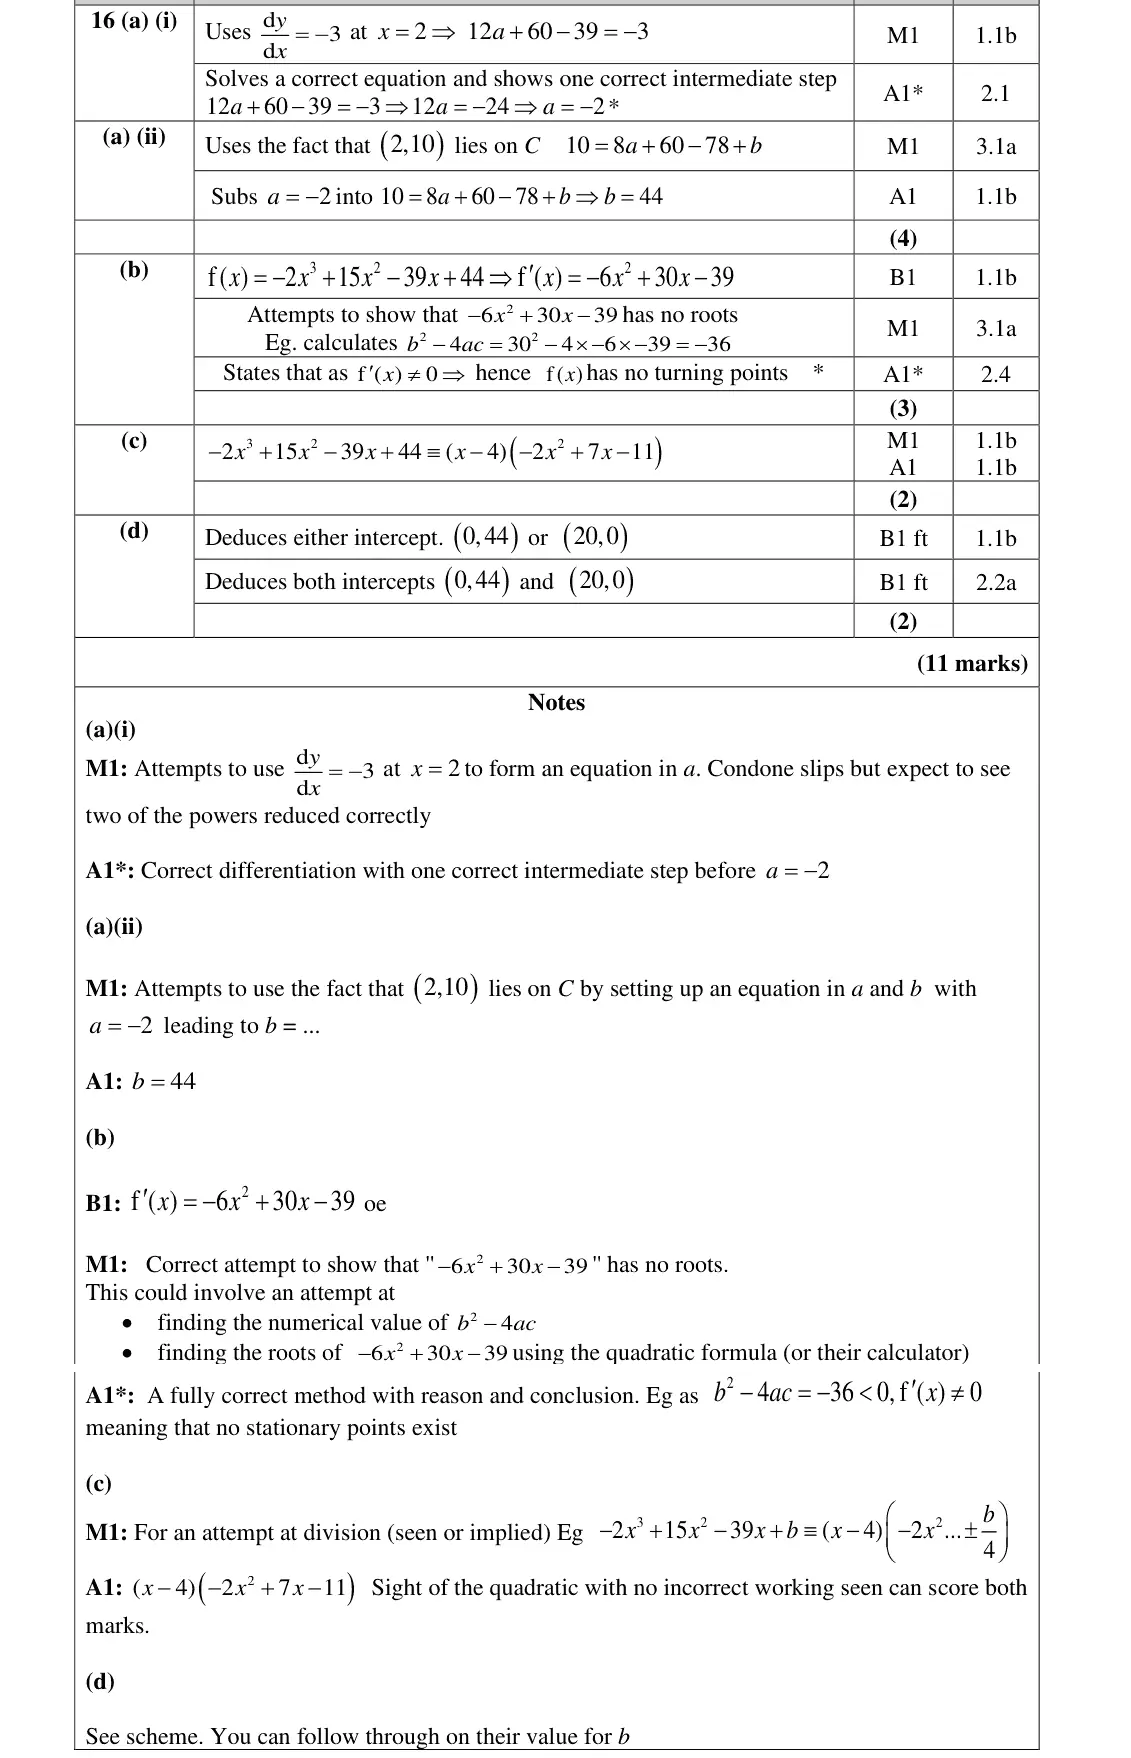
The last question on the paper was attempted by most candidates, although there were a significant number of blank responses. Again, this was possibly either due to time, or more likely due to candidates just feeling overwhelmed as the question was the longest on the paper. Most candidates did not attempt part (d), whilst some were able to find that 20 x = they failed to state the coordinates so hardly any candidates scored any marks on this part.
Common mistakes
Q(x) has no real roots so the only x-intercept of y = f(x) is (4, 0)
stretch scale factor 5 parallel to the x-axis gives (20, 0)
y-intercept unchanged (0, 44)
give coordinates, not just x = 20
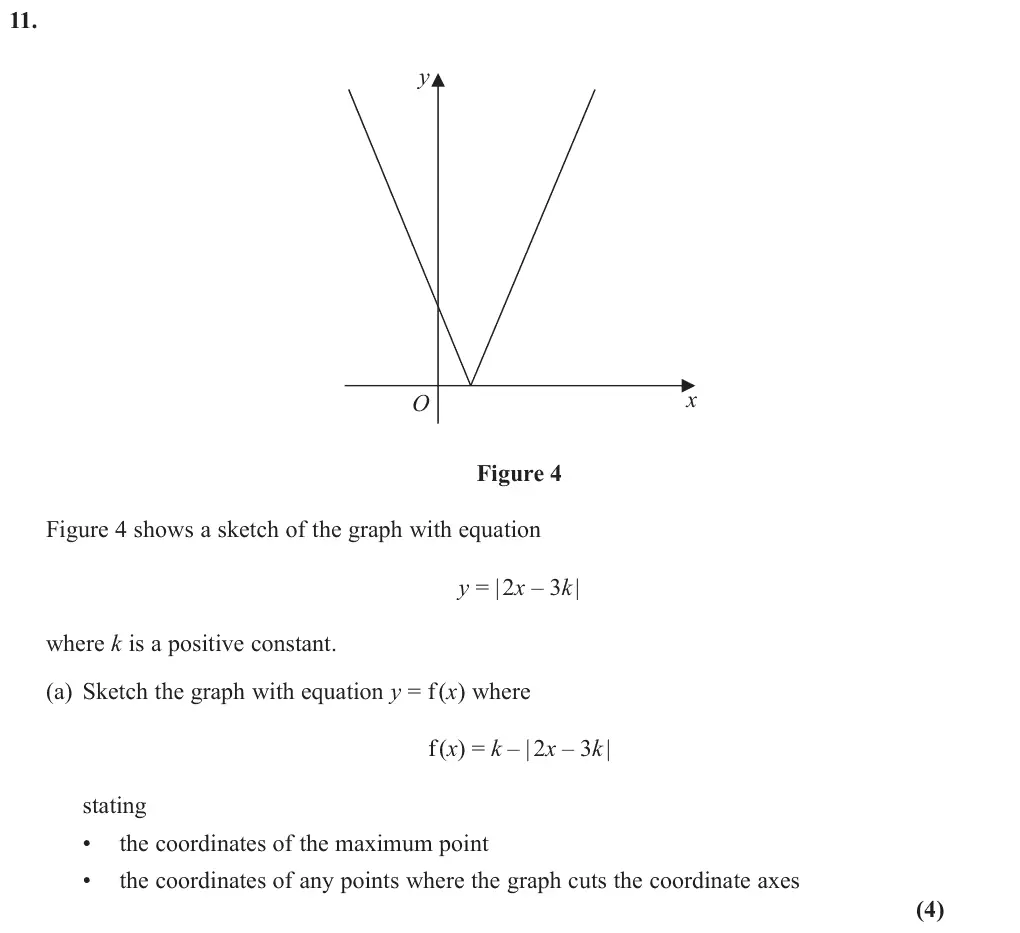
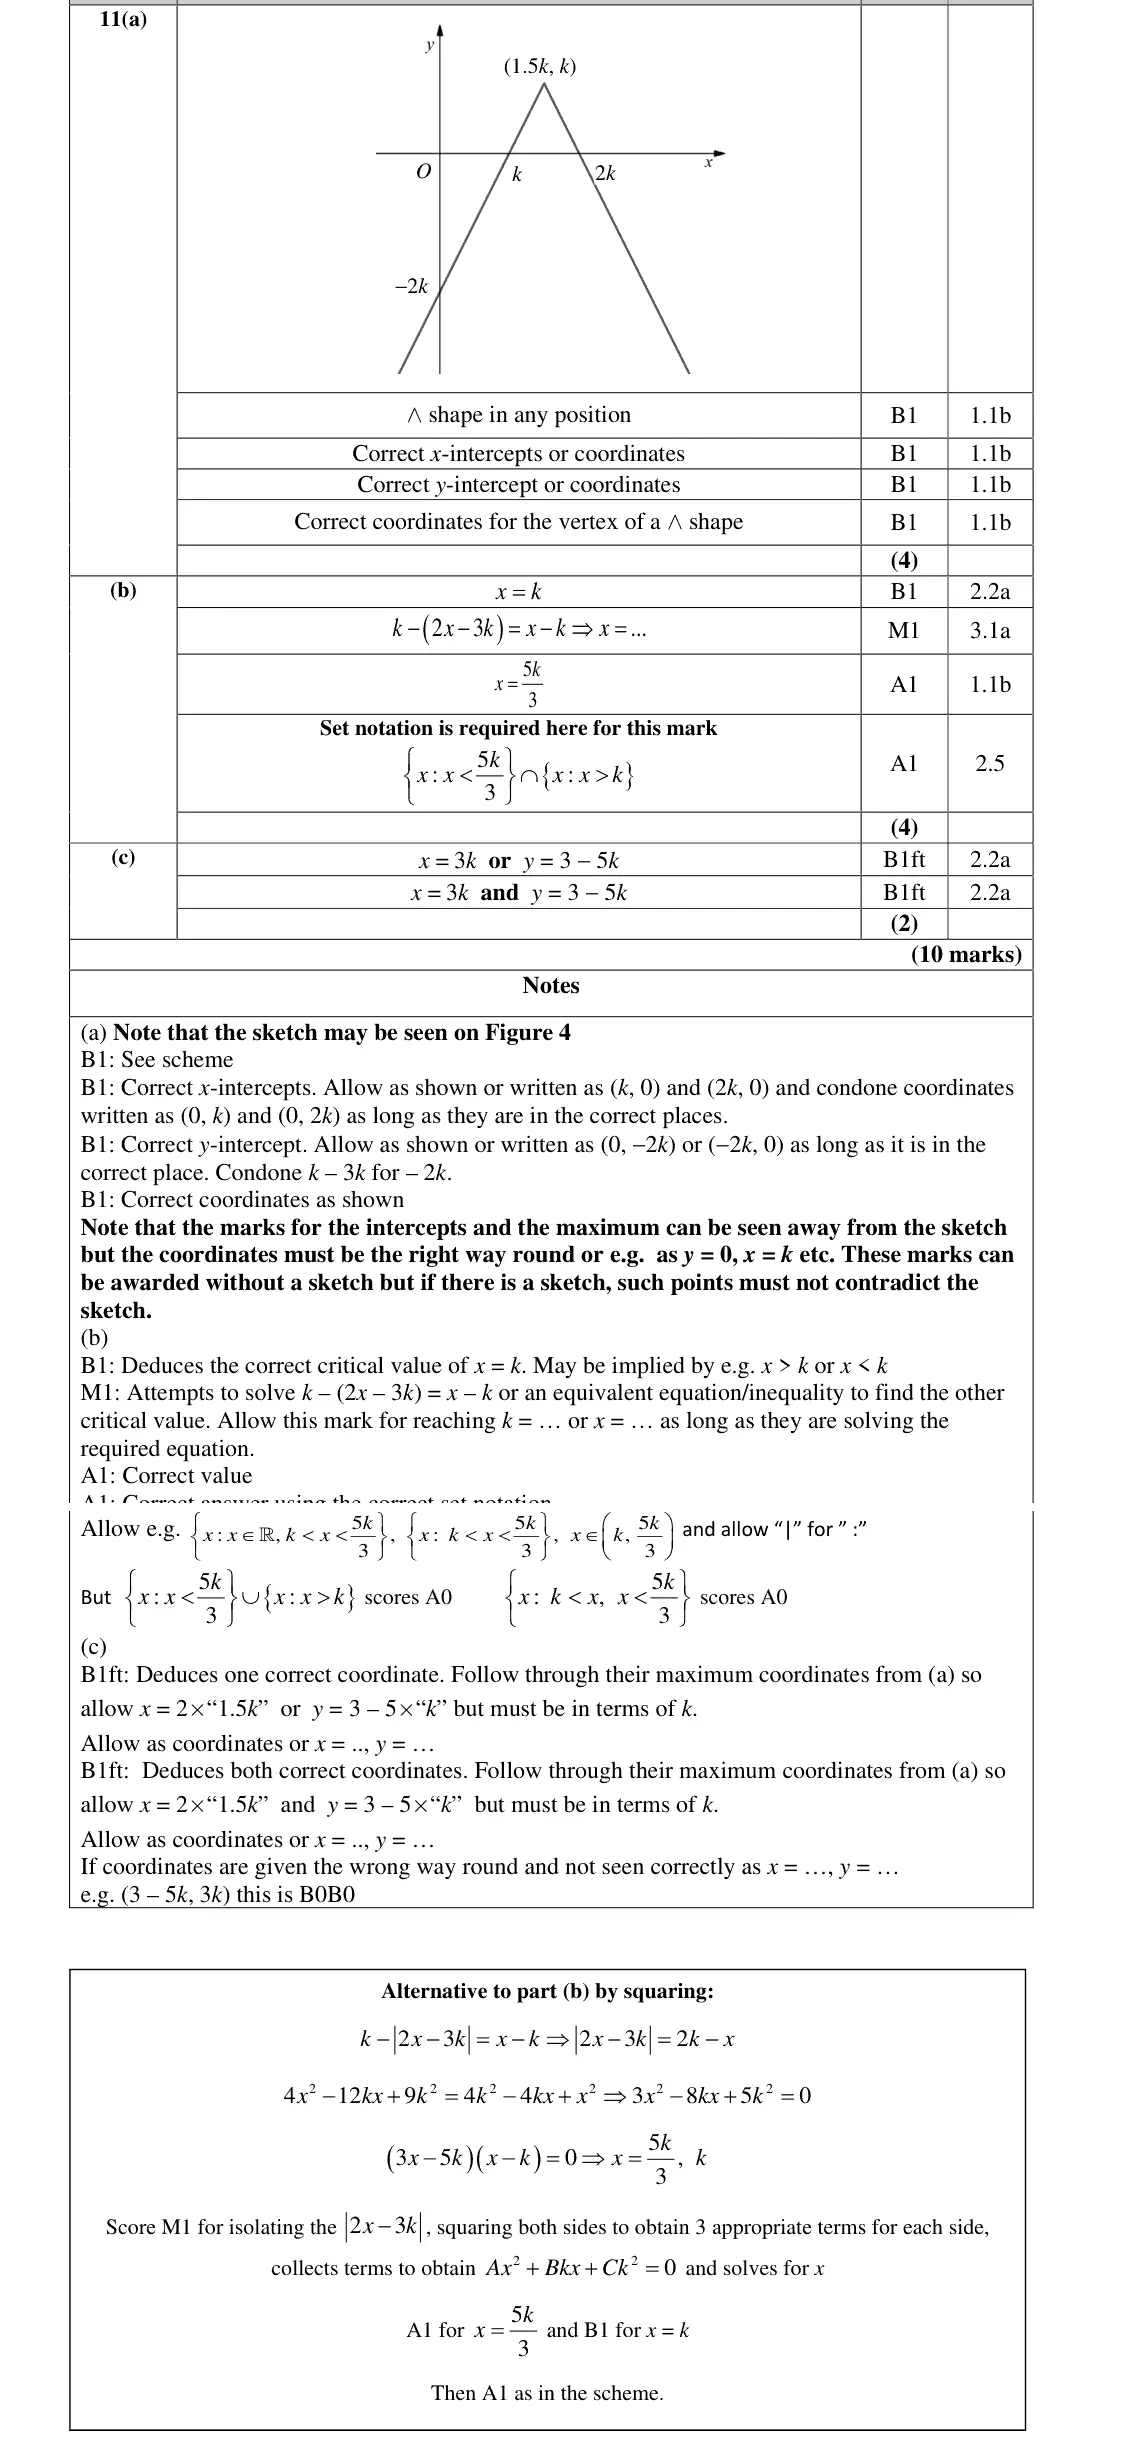
Oct 2021 · Paper 2 · Q11(a)4 marks
Mark scheme (whole question; this part is marked with the orange bar)
Examiner's comment
In general part (a) was poorly answered, with many candidates seemingly unfamiliar with sketching modulus functions. The majority of candidates scored at least one B mark for their upturned V but a V shape was occasionally seen, typically scoring no marks. Of those with the correct, many could not find the correct intersections and maximum point. Finding the correct y intercept seemed to be less challenging than finding the x intercept or the maximum point. Part (b) was better answered than part (a). Many candidates made correct attempts to find the second critical value of , gaining the M mark, but was often not found. The ‘squaring’ method was occasionally seen, but as this led to a 3TQ in x and k and which was hard to factorise this was rarely successful. The final A mark was often lost due to lack of correct set notation.
Common mistakes
inverted V (not V)
vertex (1.5k, k)
x-intercepts k and 2k
y-intercept −2k
Oct 2021 · Paper 2 · Q11(c)2 marks
Mark scheme (whole question; this part is marked with the orange bar)
Examiner's comment
There were few fully successful answers to part (c) but some candidates could write down one correct co-ordinate. There was occasional success seen by candidates who used algebra by writing the transformed function as .
Common mistakes
maximum (1.5k, k) maps to the minimum: x doubled to 3k, y = 3 − 5k
coordinates the right way round
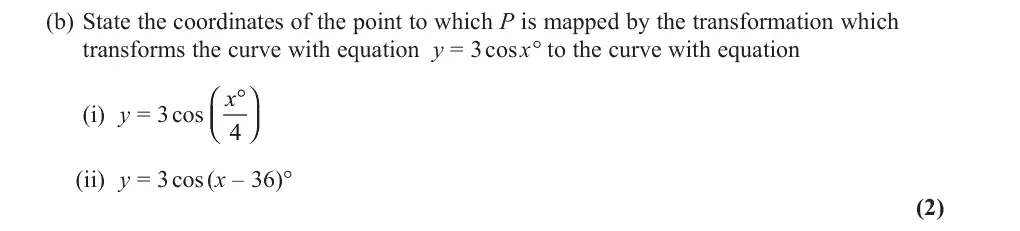
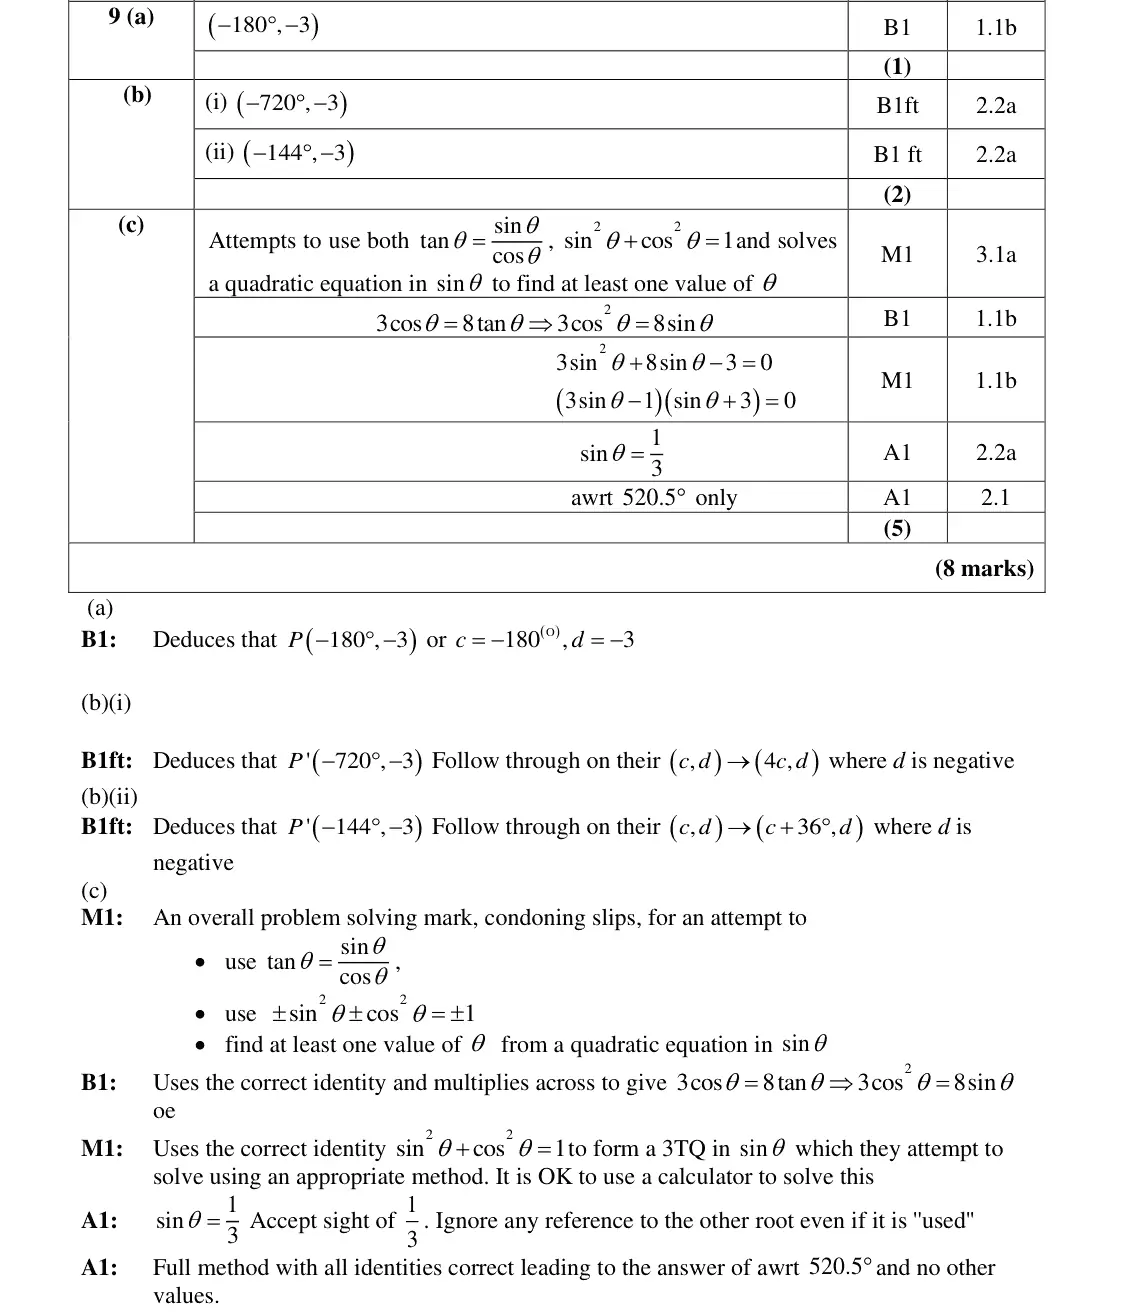
Oct 2020 · AS Paper 1 · Q9(b)2 marks
Mark scheme (whole question; this part is marked with the orange bar)
Examiner's comment
This question was attempted by most candidates with many being able to secure nearly all the marks in part (c). It was rare, however, for full marks to be scored overall, with most struggling with the transformations in part (b). In part (b), candidates could still score marks for acceptable follow throughs as long as d was a negative value. This enabled some candidates to score usually one of the marks. Some mixed up the horizontal stretch of scale factor 4 and scale factor 1 4 in part (i) and mixed up a translation of 36 units in the positive x-direction with 36 units in the negative x-direction. There were some candidates who only stated the x coordinate whereas the question asked for the coordinates, so they were unable to score in this part.
Common mistakes
(i) x/4 is a horizontal stretch factor 4: (−720, −3) (not ¼)
(ii) translation +36 in x: (−144, −3)
give both coordinates
Oct 2020 · Paper 1 · Q9(c)3 marks
Mark scheme (whole question; this part is marked with the orange bar)
Examiner's comment
Unsurprisingly candidates found part (c) more challenging, especially (c) (ii) where the significance of x=0 was rarely understood. It was however a good discriminator for stronger candidates.
Common mistakes
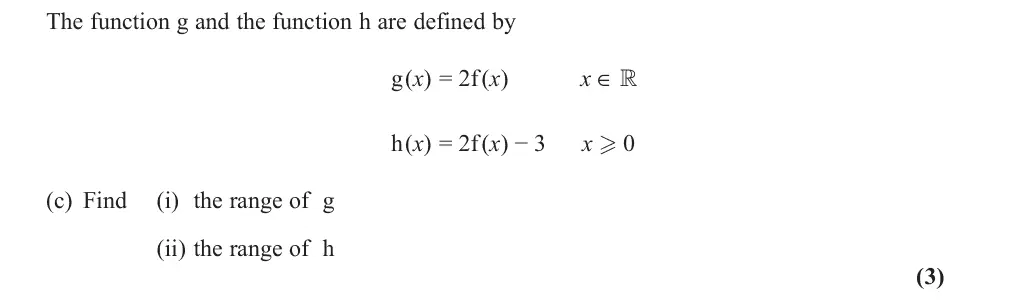
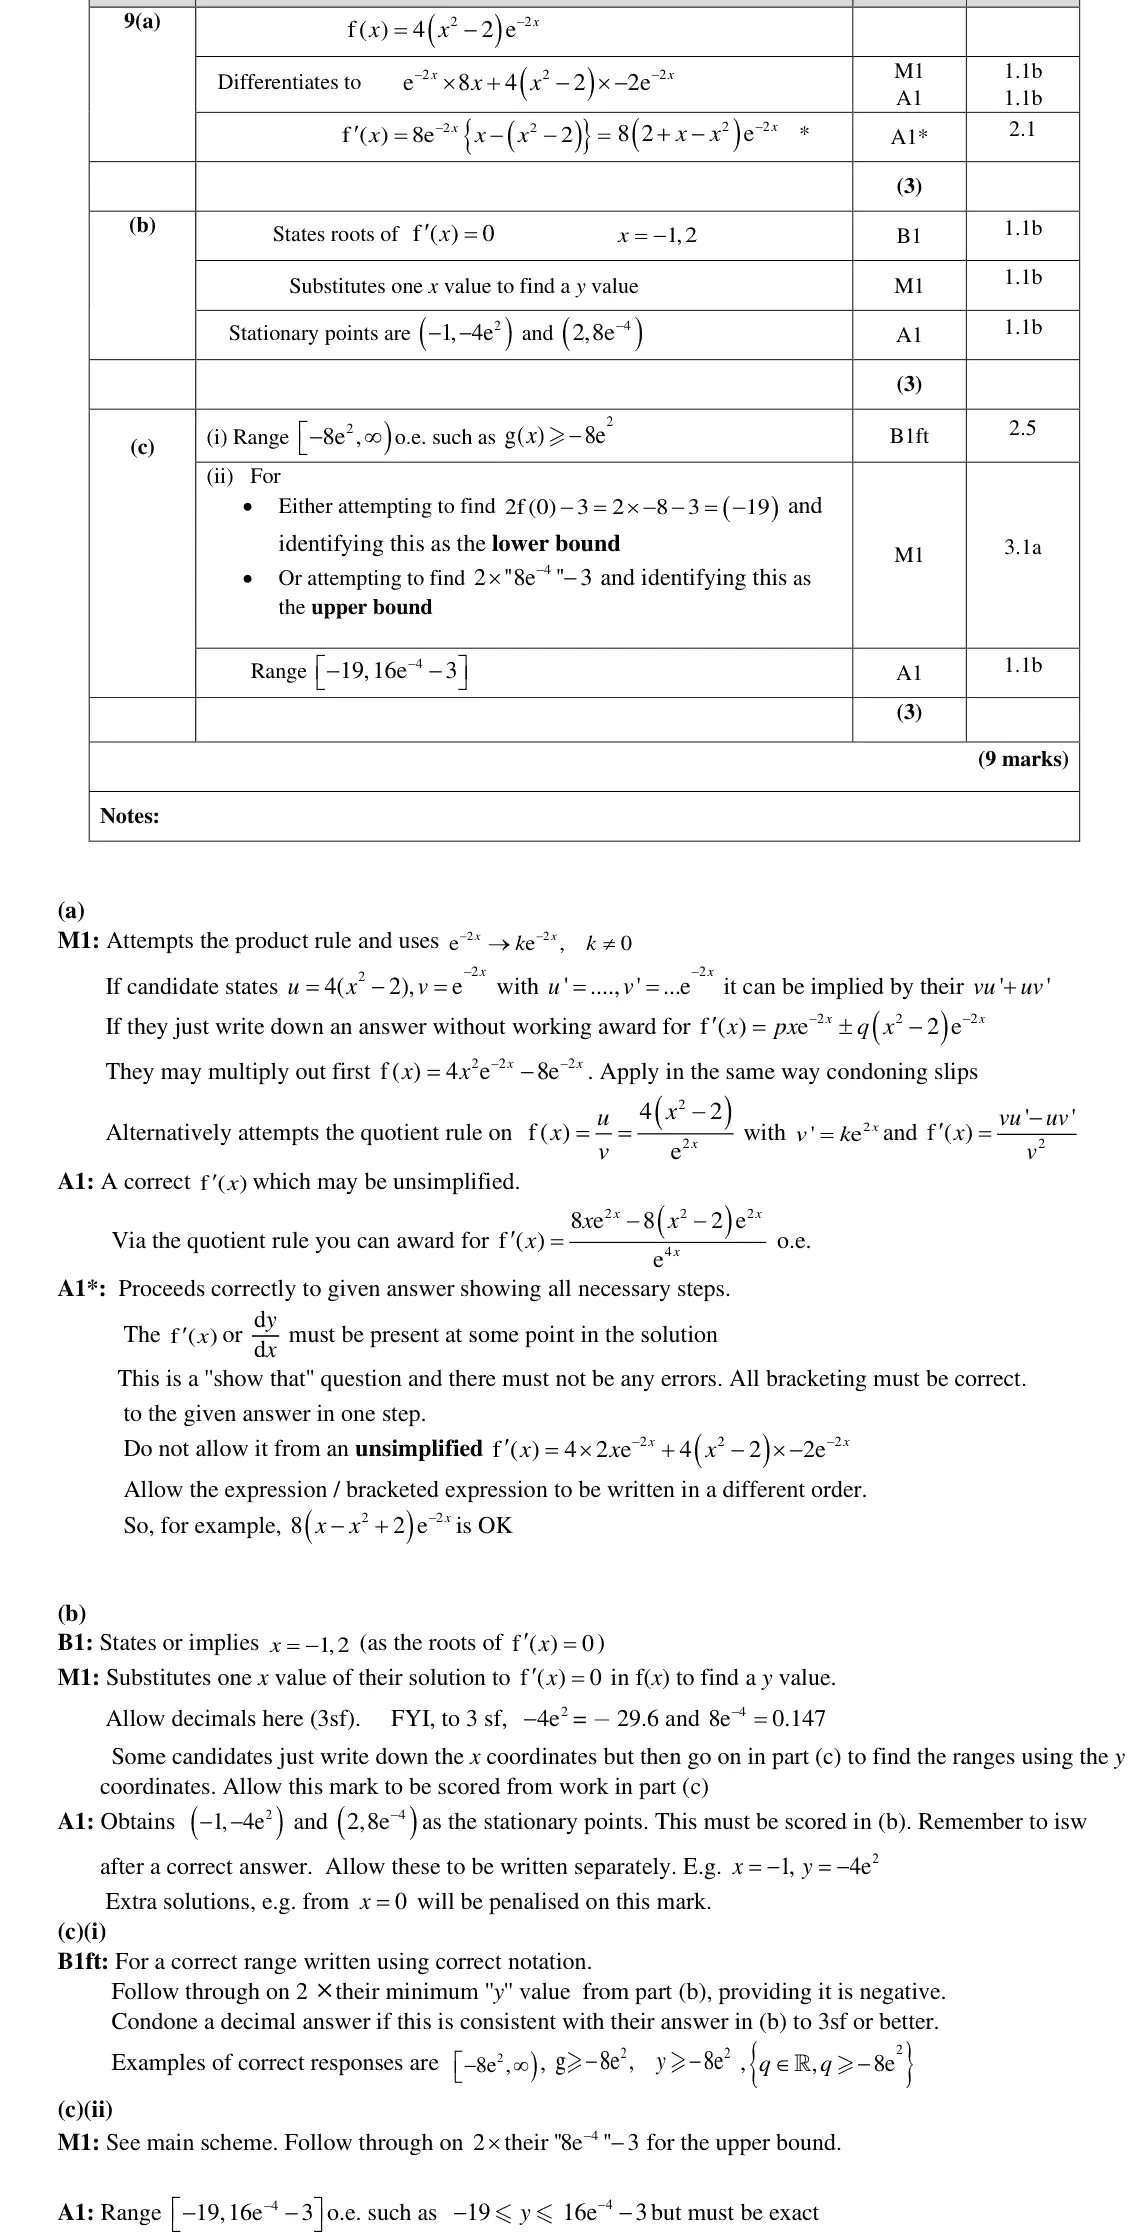
(i) g(x) ≥ −8e² (double the minimum)
(ii) h has domain x ≥ 0: lower bound h(0) = 2f(0) − 3 = −19, upper bound 16e⁻⁴ − 3 from the maximum
significance of x = 0 rarely seen
exact values and correct range notation
Oct 2020 · Paper 2 · Q11(a)2 marks
Mark scheme (whole question; this part is marked with the orange bar)
Examiner's comment
Part (a) of this question was generally well answered, with most candidates being able locate P correctly. A few candidates launched into some lengthy algebra, in some cases resulting in values for x and y bearing no relation to the position of P on the diagram. Answers to part (b) from this cohort of candidates were very disappointing and displayed an
Common mistakes
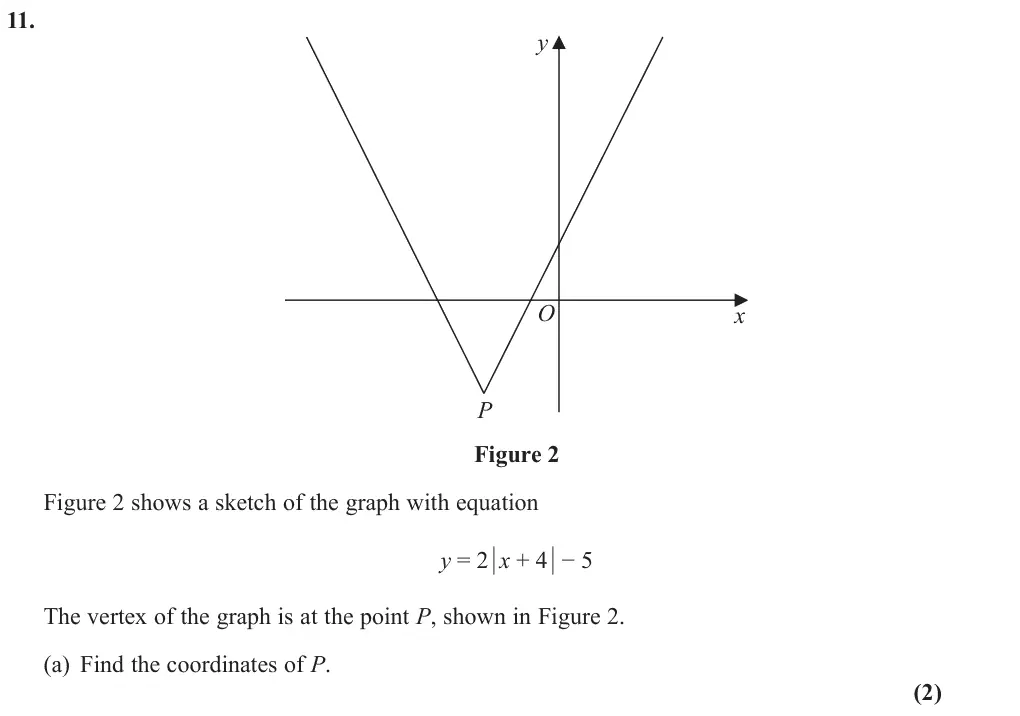
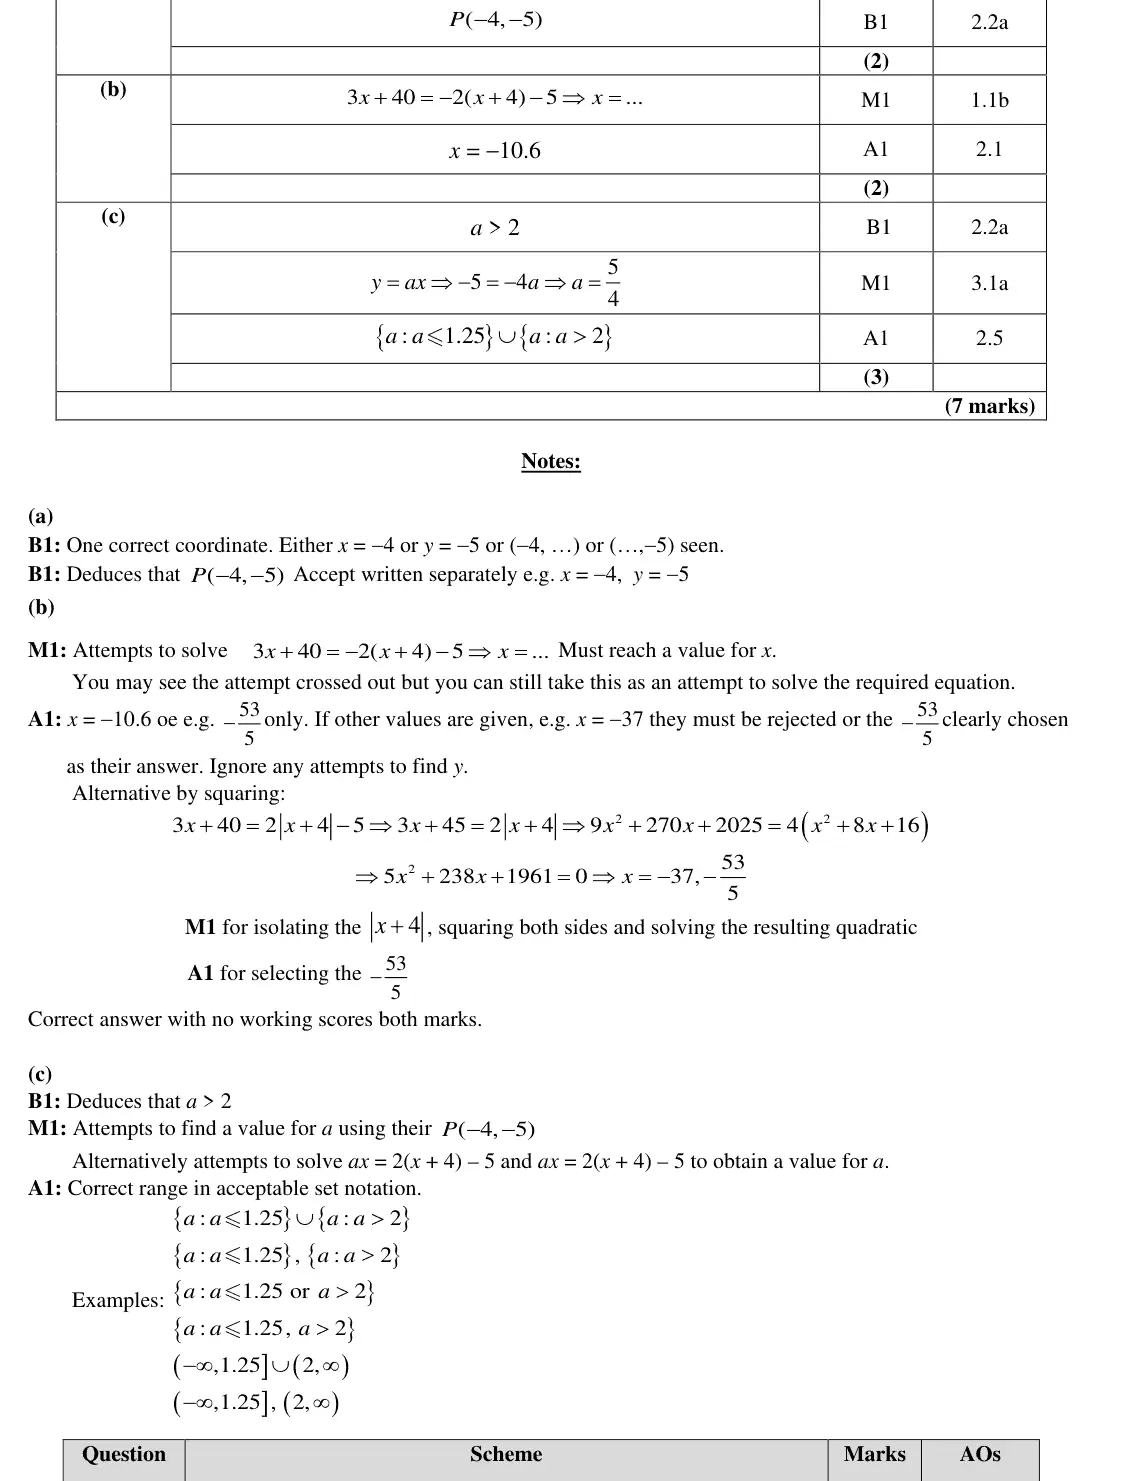
vertex P(−4, −5) read from the transformation
lengthy algebra not needed
June 2019 · AS Paper 1 · Q11(c)2 marksMedium
Mark scheme (whole question; this part is marked with the orange bar)
Examiner's comment
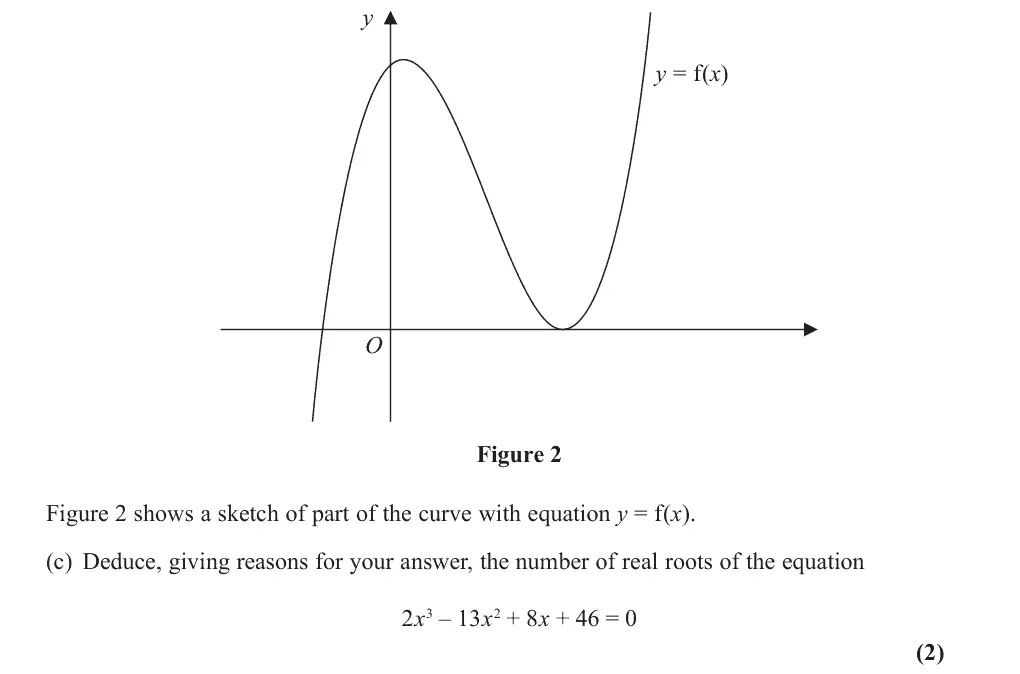
As a general point, it is worth noting that a good examination technique is to look at the mark marks, yet produced half a page of work in (c) or (d) which had an allocation of just 2 marks. The number of marks allocated to any part of a question is a good hint to the depth and detail of work required. (c) Those who noticed that the value of the constant had changed from 48 to 46 recognised that the new equation had three roots. Only a few went on to explain that f(x) had been transformed by the vector or even just 2 places downwards cutting the x-axis in three places. A large number of candidates did not spot the difference between the equation in (c) and f(x) = 0 and many of those merely explained what they had done in (b). given. Infact quite a few candidates, who had scored only a few marks in parts (a) (b) and (c) combined, achieved both marks here.
Common mistakes
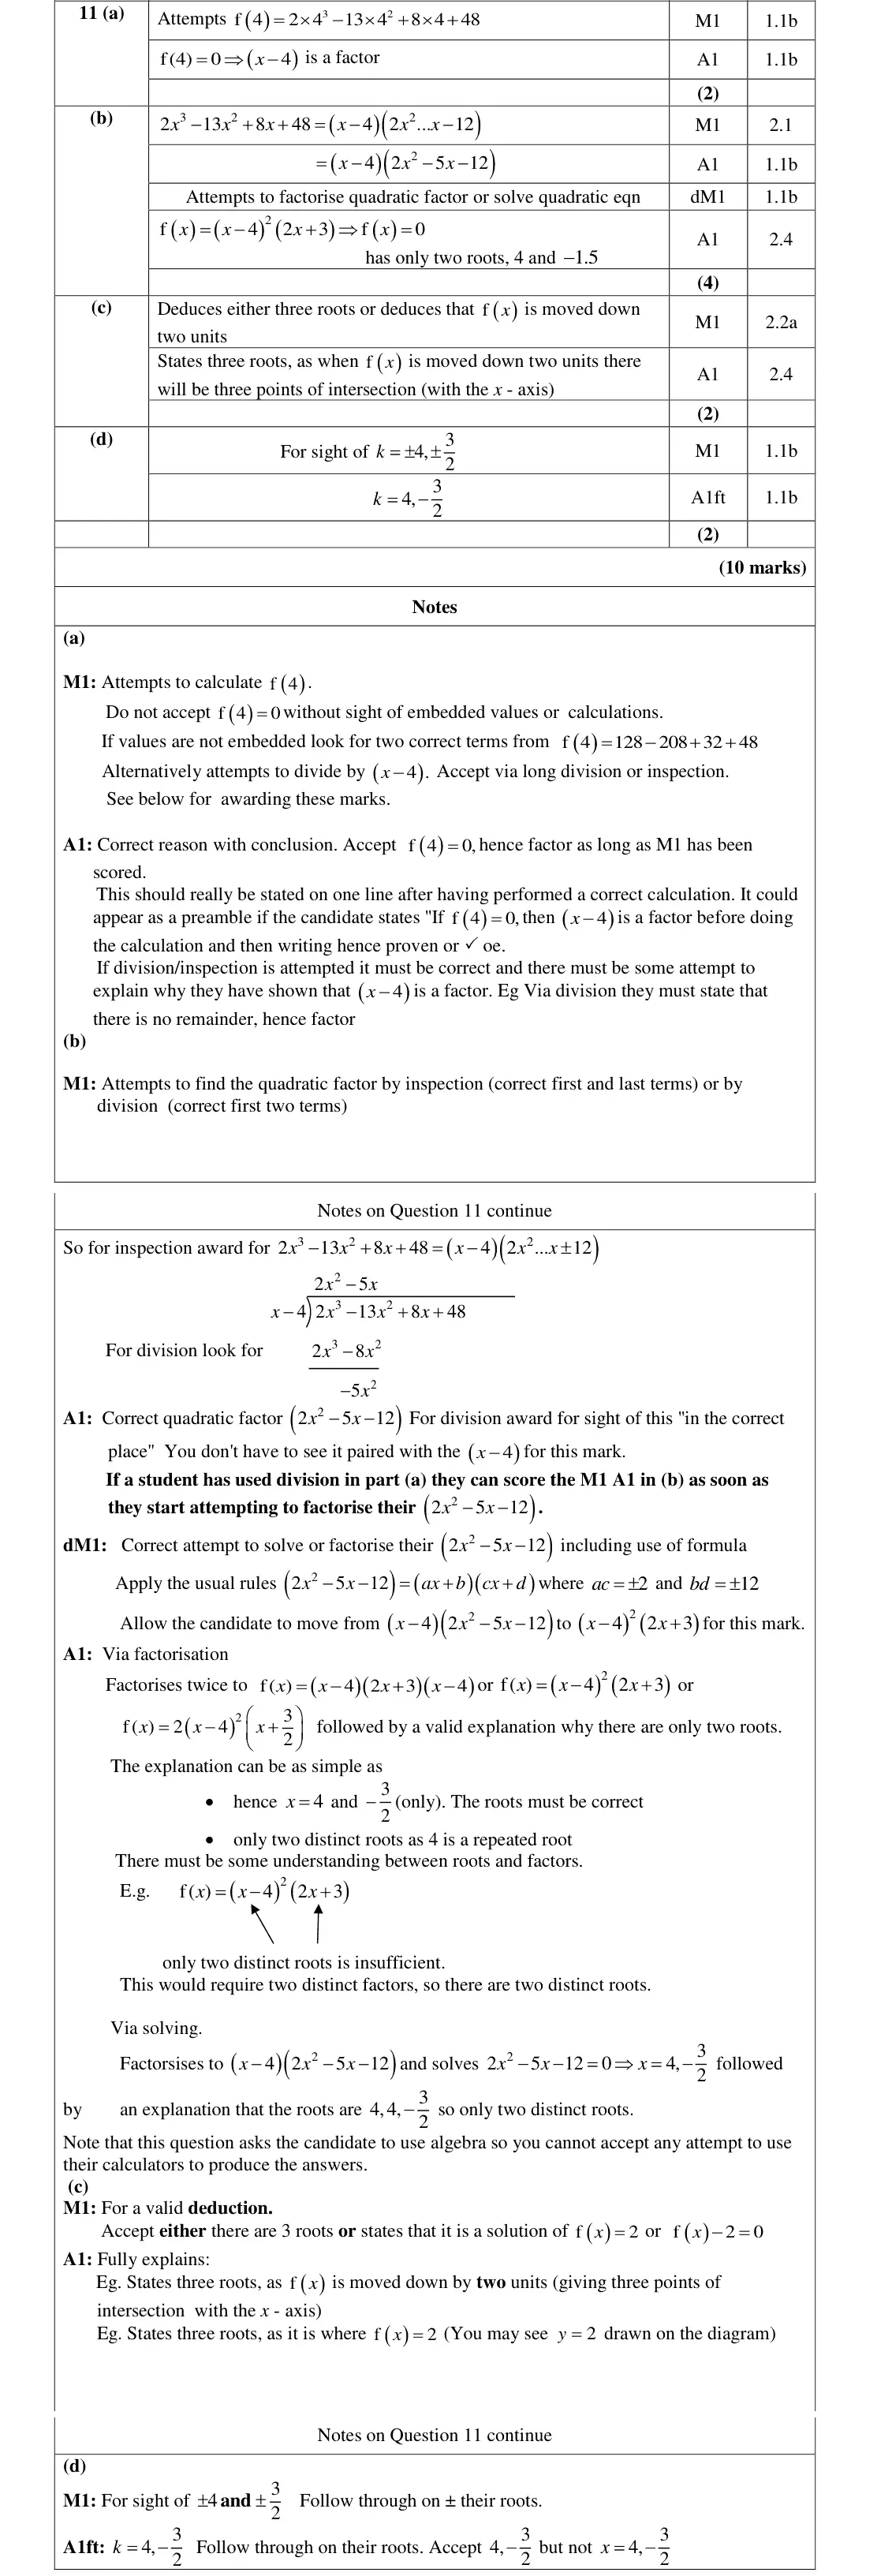
the constant changed from 48 to 46: f(x) − 2 = 0 is y = f(x) moved down 2 units (or f(x) = 2), so 3 points of intersection and 3 roots
June 2019 · AS Paper 1 · Q11(d)2 marksMedium
Mark scheme (whole question; this part is marked with the orange bar)
Examiner's comment
As a general point, it is worth noting that a good examination technique is to look at the mark marks, yet produced half a page of work in (c) or (d) which had an allocation of just 2 marks. The number of marks allocated to any part of a question is a good hint to the depth and detail of work required. (d) This part of the question was generally either missed out entirely, or else the correct answer was given. Infact quite a few candidates, who had scored only a few marks in parts (a) (b) and (c) combined,
Common mistakes
f(x + k) is a translation by −k: roots 4 and −3/2 move to the origin, so k = 4 or −3/2 (sign of k)
June 2019 · Paper 1 · Q5(c)4 marksEasy
Mark scheme (whole question; this part is marked with the orange bar)
Examiner's comment
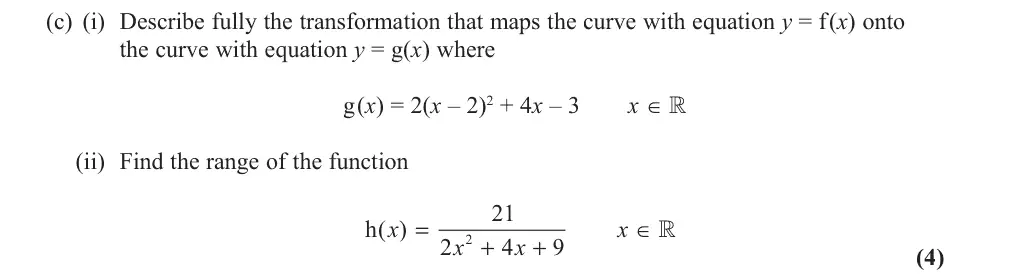
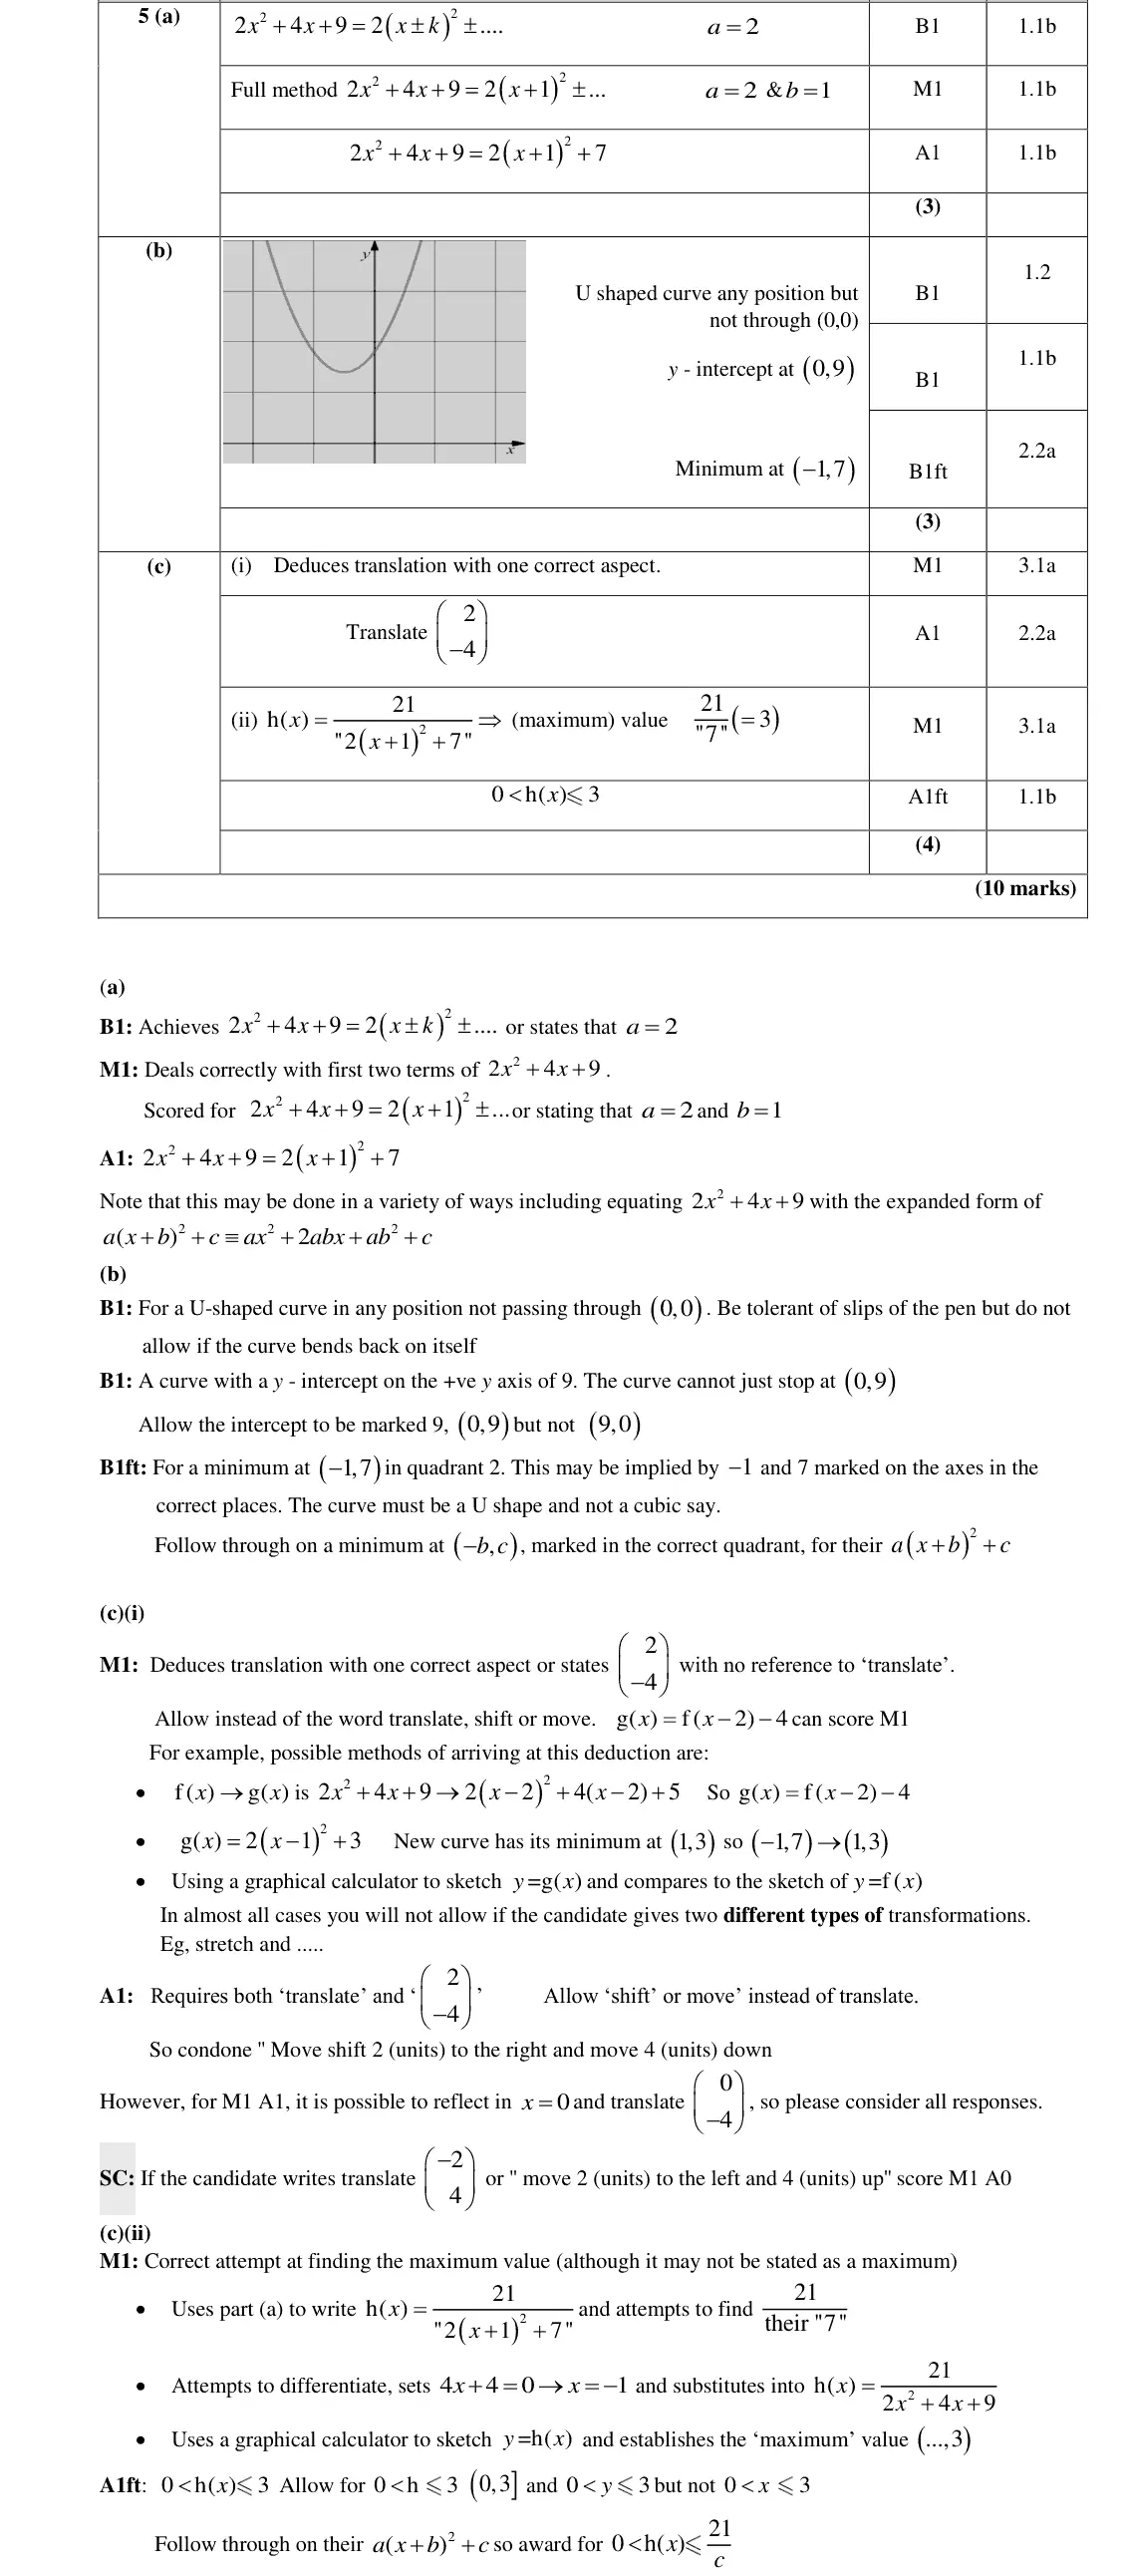
This question on completing the square and the quadratic function was accessible to all, especially the first 6 marks. Part (c) was more demanding but there were some excellent responses here. As stated earlier, part (c) was a lot more demanding. Rather strangely part (i) was found more accessible than part (ii). Many candidates sketched the new curve and compared the positions of the turning points noting that had ''moved'' to 1,3 . Disappointingly a rather sizeable majority could only describe this ''movement'' 1,7 21 h( ) x as a ''transformation'' rather than ''translation'' . Fewer students could use the form to 2 2( 1) 7 x 21 x y 0 find the range of the function. Many resorted to substituting producing a range with as one of 9 the limits. Common incorrect answers for the range of h scoring one mark were h( ) 3 x or 0 f ( ) 3 x .
Common mistakes
(i) needs the word translate and the vector (2, −4), not just "transformation"
(ii) h(x) = 21/(2(x + 1)² + 7) so 0 < h(x) ≤ 3
common errors h(x) ≤ 3 or using 9 as a limit
June 2019 · Paper 1 · Q6(b)2 marksMedium
Mark scheme (whole question; this part is marked with the orange bar)
Examiner's comment
This was generally a well attempted question with most candidates able to score over half of the marks. In part (b) a significant number used 2 50 x rather than 25 x .Of those who used one of their solutions to part (a), the majority then proceeded to the correct answer, although a significant number did not give the smallest positive solution to the equation. This was usually due to the fact that they used their smallest positive solution to part (a) (i.e. 18.4) in the equation, not realising that they needed to use – 18.4.
Common mistakes
θ = x − 25 (not 2x − 50)
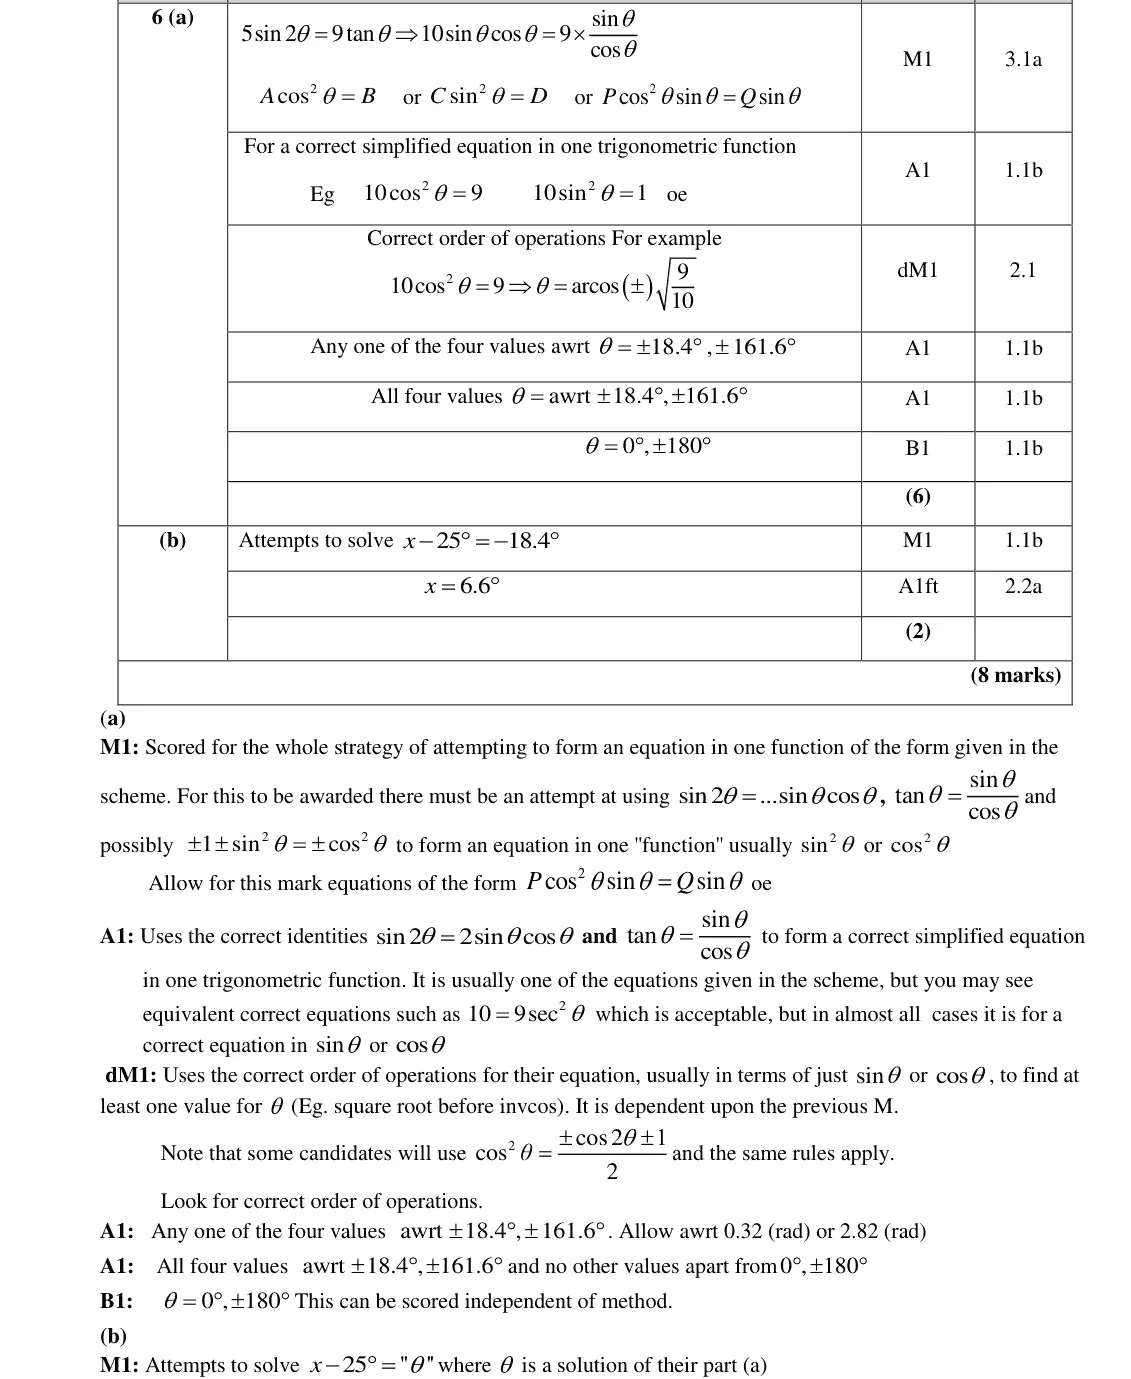
use θ = −18.4° (not 18.4°) to get the smallest positive x = 6.6°
June 2019 · Paper 1 · Q12(b)2 marksMedium
Mark scheme (whole question; this part is marked with the orange bar)
Examiner's comment
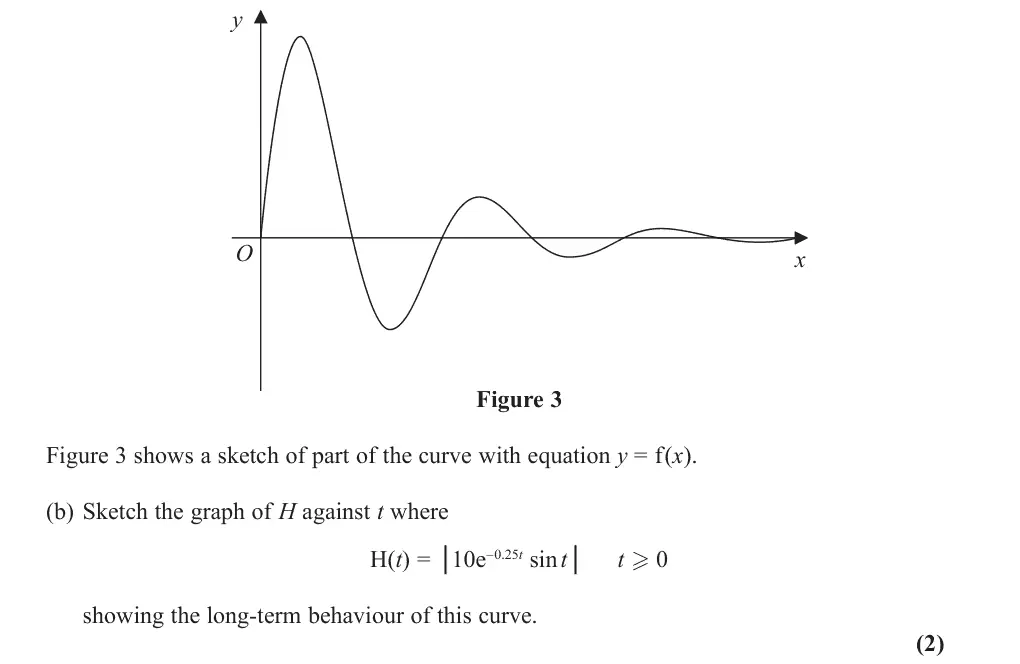
This question discriminated well between students of all abilities with part (a) and (b) more accessible to students compared to part (c) and (d). Part (b) was the most successfully answered part of the question. Students realised that the graph of |f(x)| should be above the x-axis. Where students did not gain full credit, this was usually due to poor drawing of loops (not decreasing heights, or rounding at the cusps). A few students chose to draw over the original figure which made it difficult in many cases to determine which pieces formed their graph. They would be well advised to sketch separate graphs in similar questions.
Common mistakes
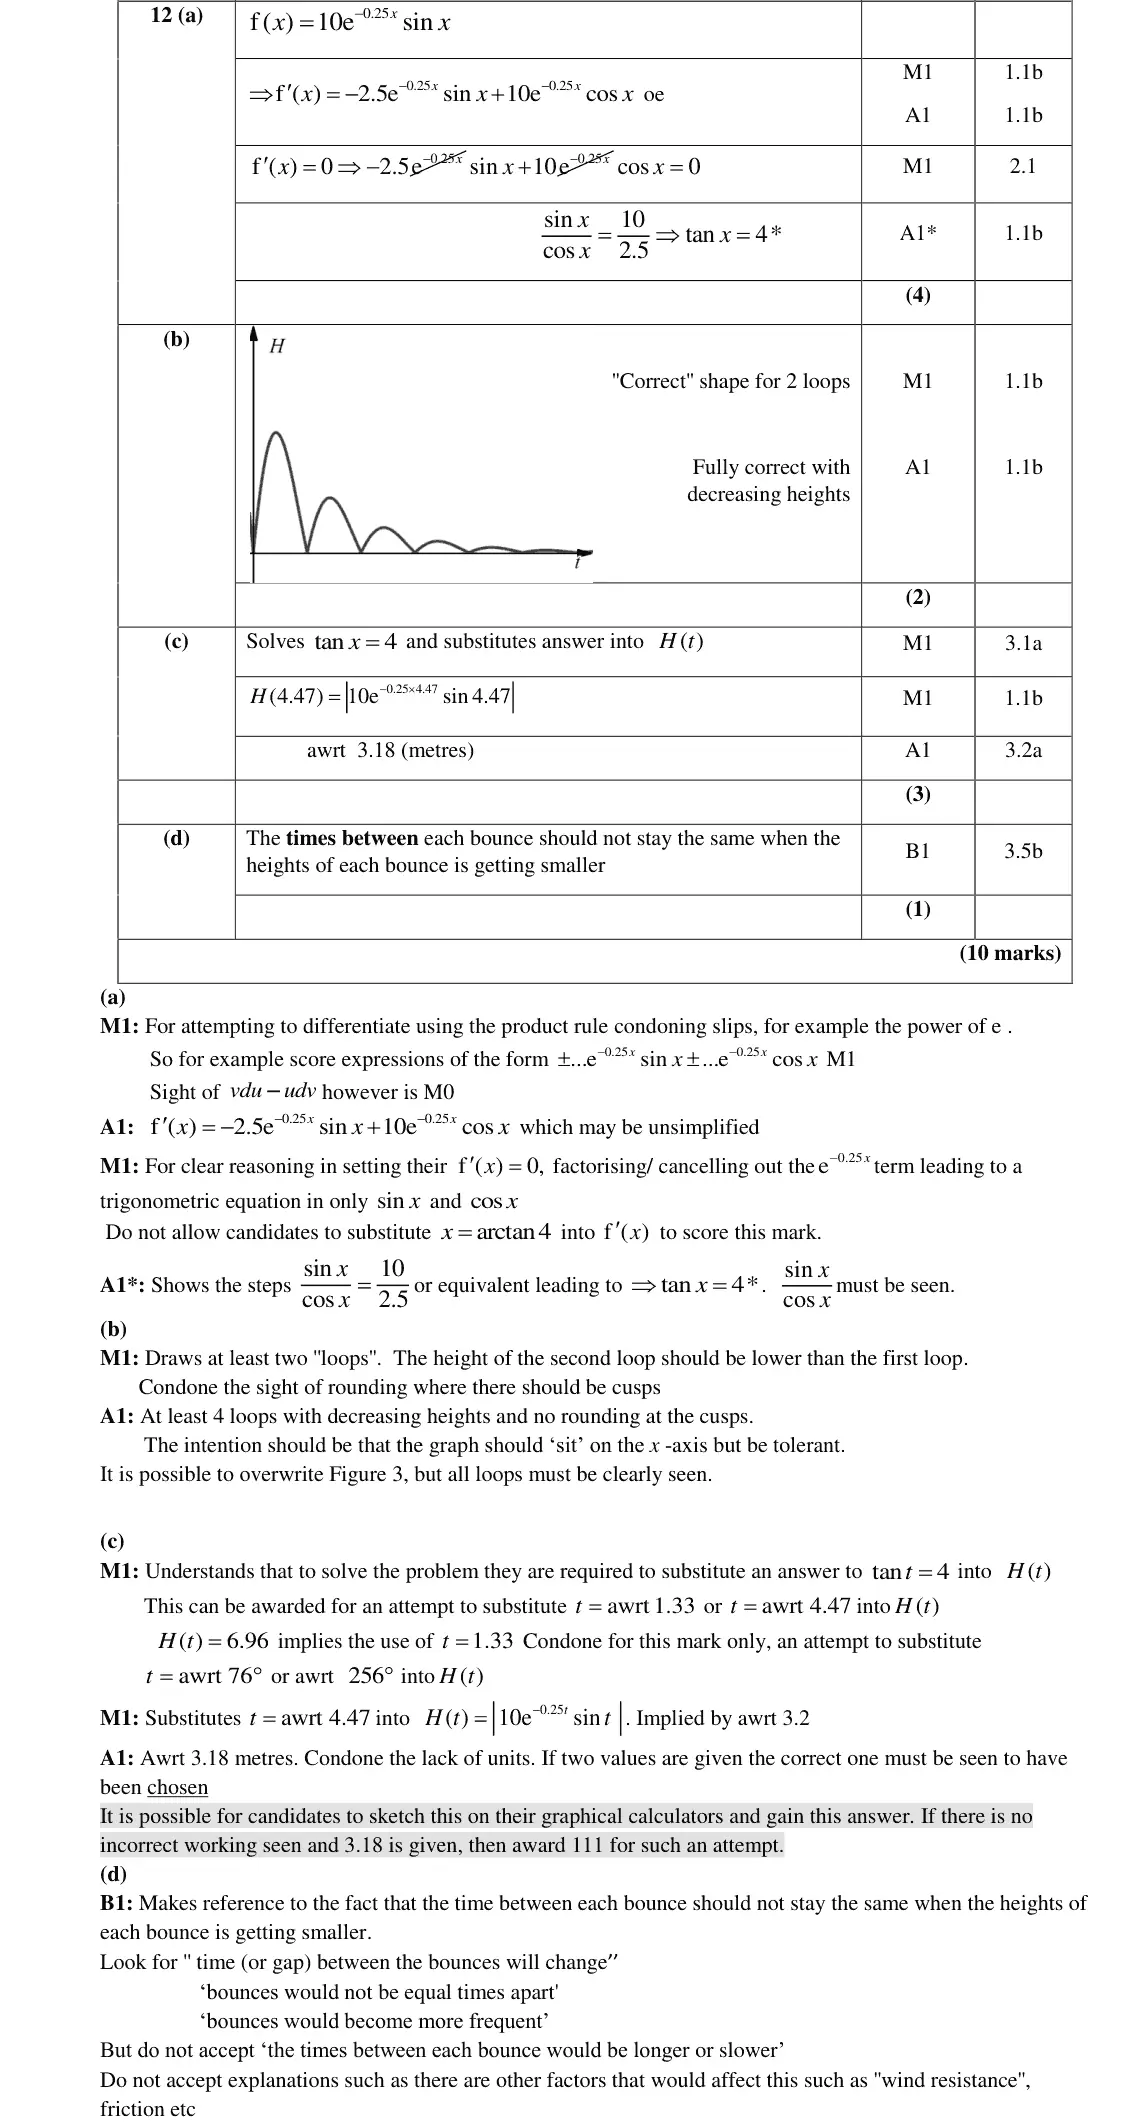
modulus graph: negative loops reflected above the axis
cusps (not rounded) on the t-axis
decreasing heights
June 2018 · AS Paper 1 · Q9(c)3 marks
Mark scheme (whole question; this part is marked with the orange bar)
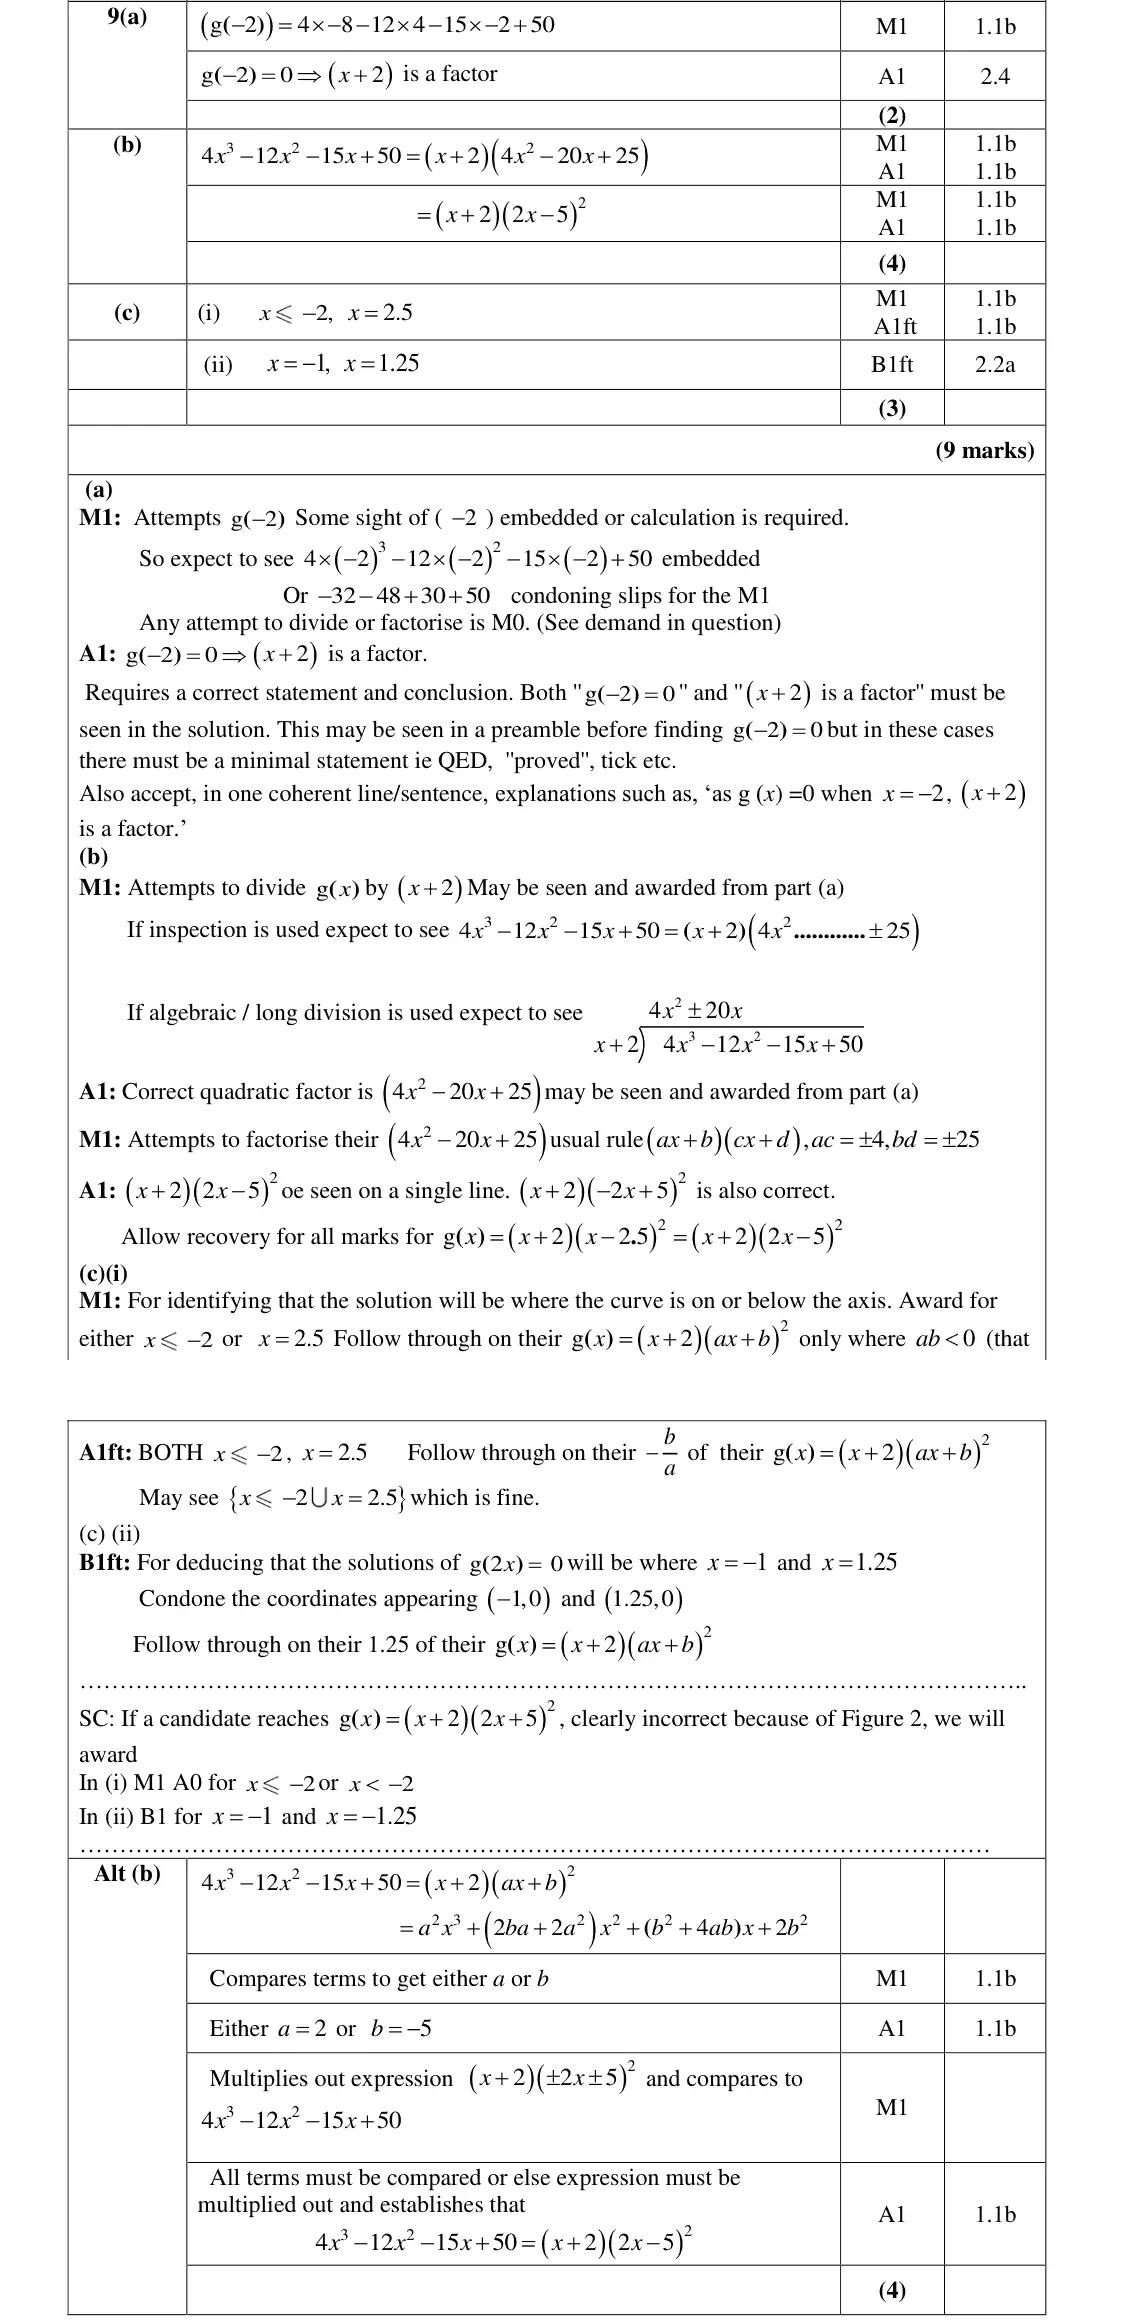
Examiner's comment
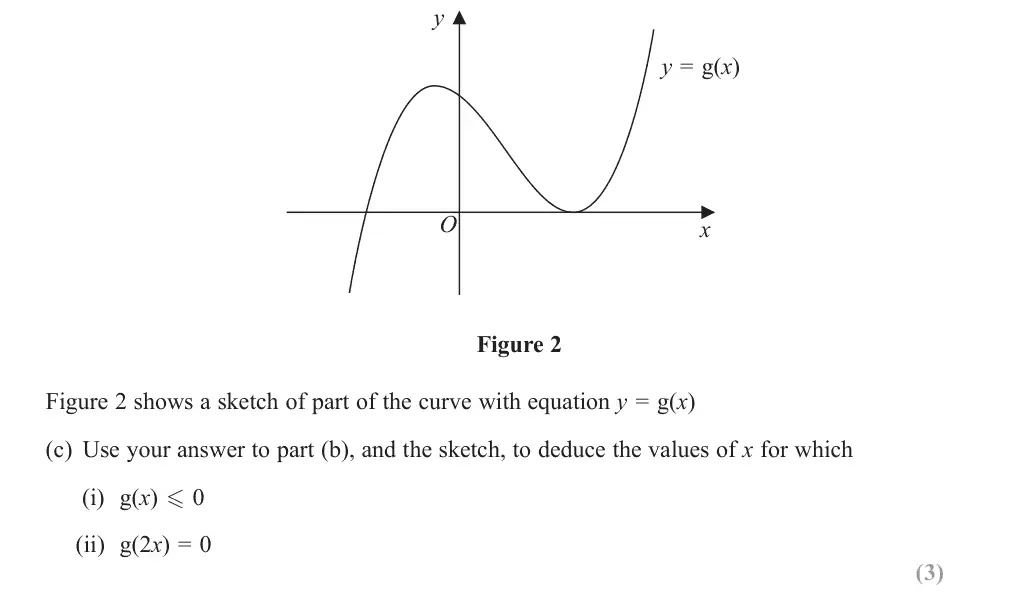
This question on the factor theorem proved to be a good source of marks for many students. Clearly they had been well prepared for this kind of question. Part (c) was usually attempted, but with limited success. In part (i) many achieved one mark, usually for 2 x (or x < - 2 which was condoned for the M mark). Errors from part (b) were often followed through correctly. Only more able (and careful) students gained full marks. In part (ii) many correctly use transformations to state x = -1 and x = 1.25. Some students multiplied the critical values by 2 (instead of dividing by 2) or in other cases they wrote down just one of the two solutions.
Common mistakes
(i) curve on or below the axis: x ≤ −2 or x = 2.5 (the repeated root where the curve touches the axis is often missed)
(ii) g(2x) = 0 halves the roots: x = −1, 1.25 (not doubled)
June 2018 · Paper 2 · Q3(b)3 marks
Mark scheme (whole question; this part is marked with the orange bar)
Examiner's comment
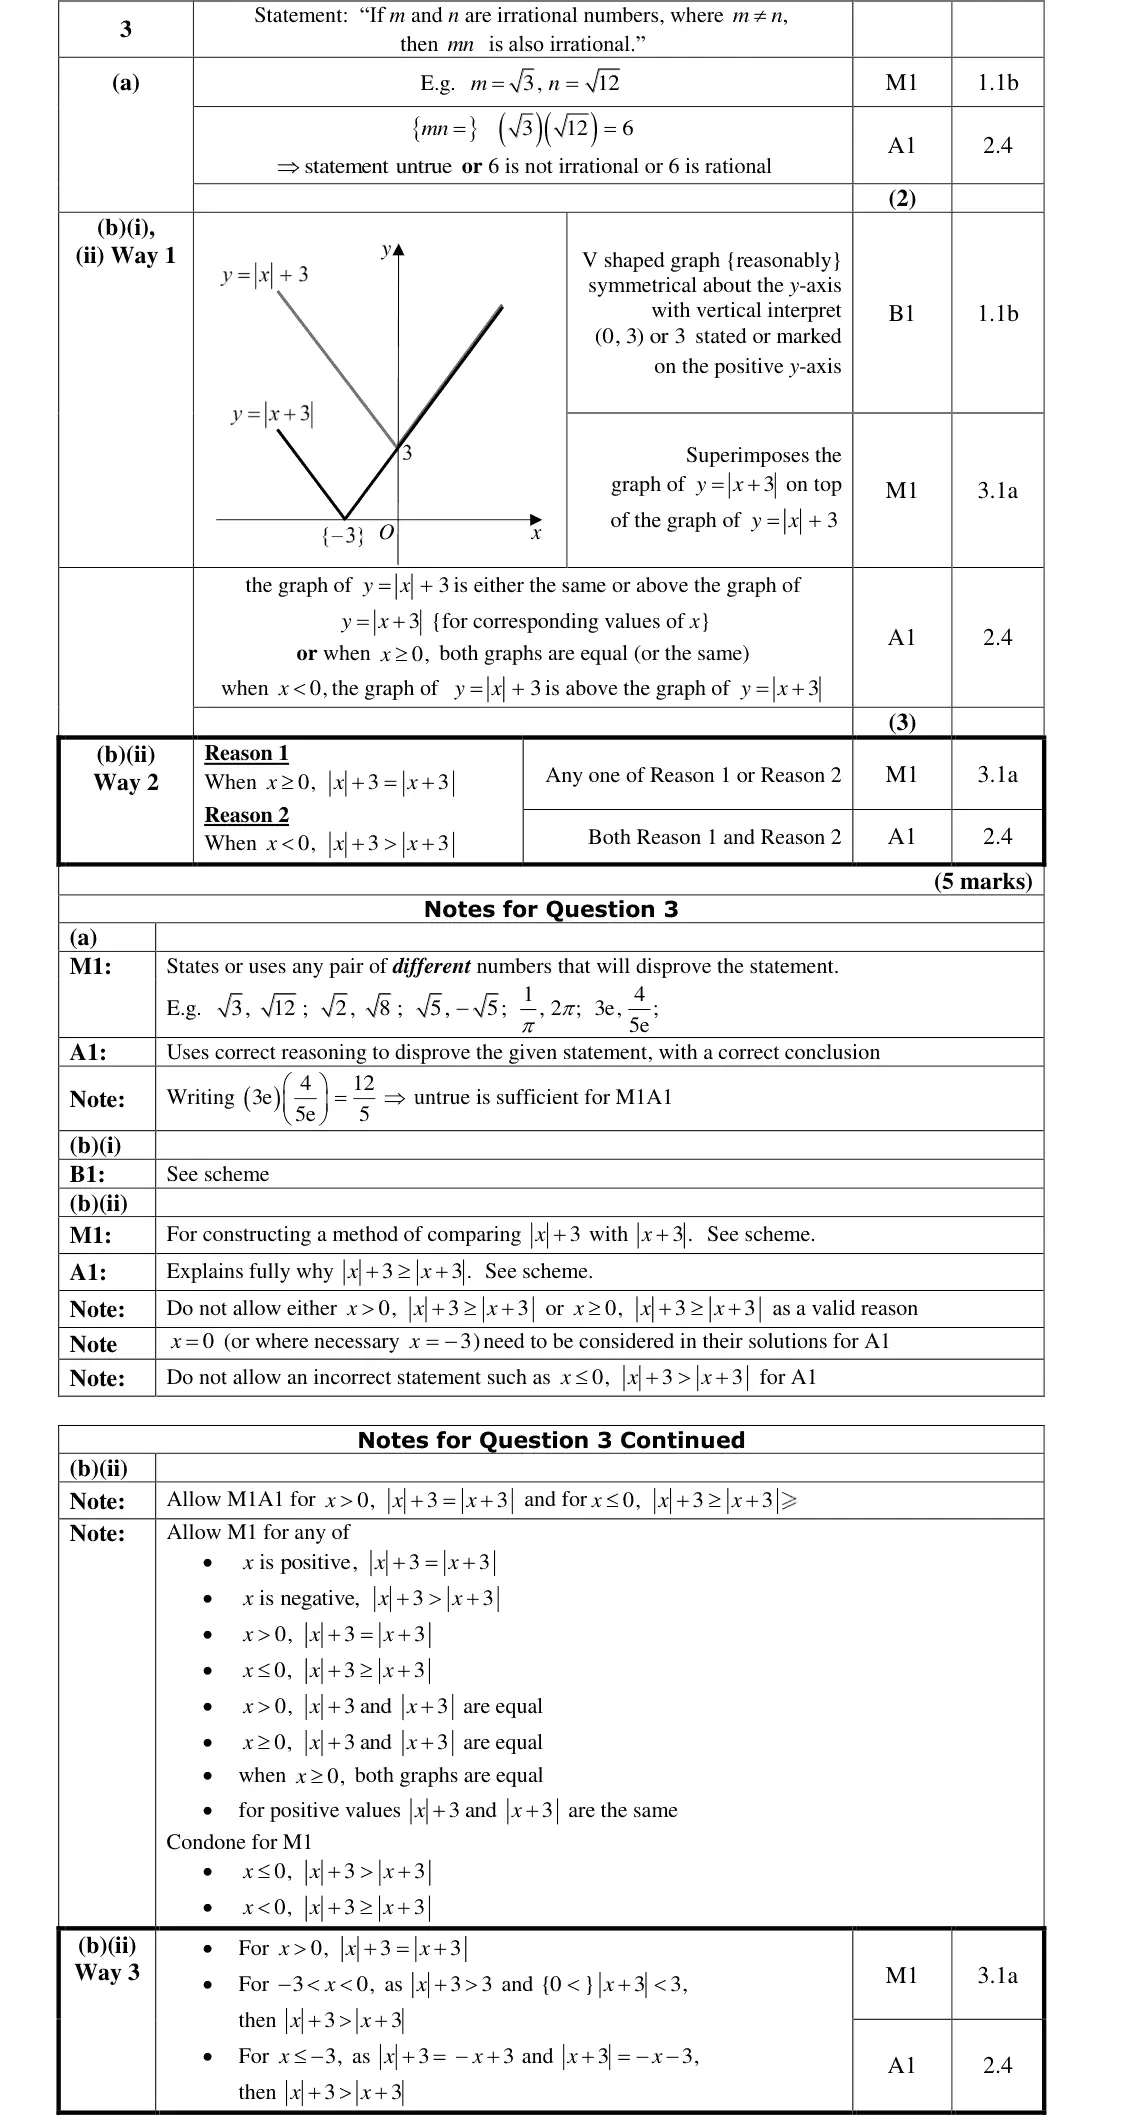
This question discriminated well between students of all abilities with some students struggling to access the final mark in part (b). In part (b)(i), most students drew a V-shaped graph in the correct position with many labelling 3 or (0, 3) as the y-intercept. In part (b)(ii), those students who superimposed the graph of 3 y x over the graph of 3 y x were usually more successful in explaining why 3 3 x x for all real values of x. Otherwise, a variety of explanations were seen, of which some were detailed, usually containing at least one correct statement. Common errors included explanations which did not consider the case 0 x or explanations including the statement that the graphs of 3 y x and 3 y x were parallel for all 0. x A significant number of students who only tested the statement 3 3 x x for specific values of x (usually one positive and one negative) did not receive any credit in this part.
Common mistakes
V shape with vertex (0, 3)
superimpose y = modulus of (x + 3)
for x ≥ 0 equal, for x < 0 modulus of x plus 3 is greater
testing particular values gets no credit
graphs are not "parallel" for x < 0
Find an Edexcel maths tutor
Stuck on this? Book a trial session with an Edexcel specialist.