June 2025: AS AS Paper 2 Section A: Statistics

30 marks · 16 question parts · Question paper, mark scheme and examiner's report on Pearson's site

Question by question

QTopicMarksDifficulty
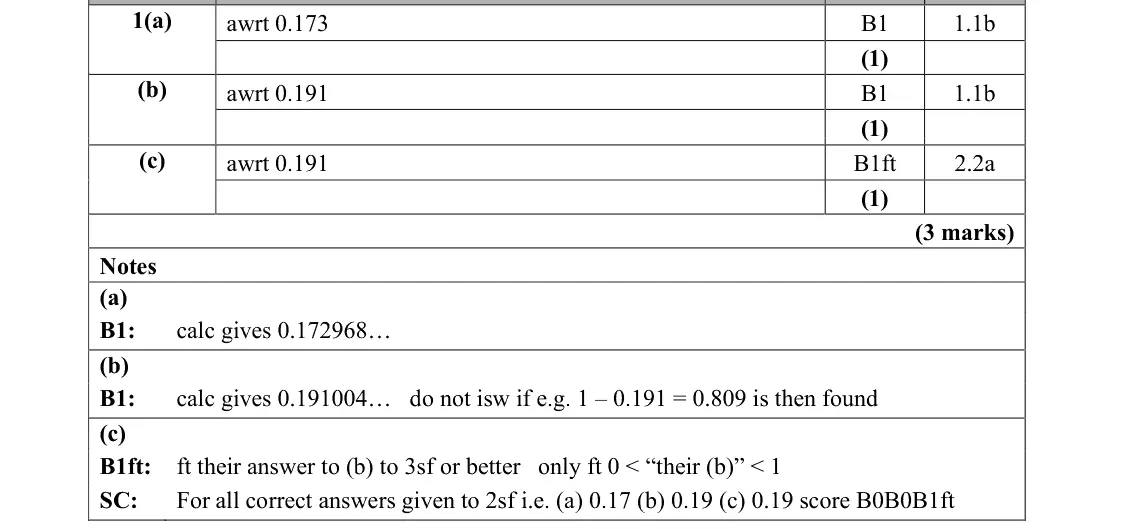
1(a) Discrete distributions and the binomial distribution 1 —
1(b) Discrete distributions and the binomial distribution 1 —
1(c) Discrete distributions and the binomial distribution 1 —
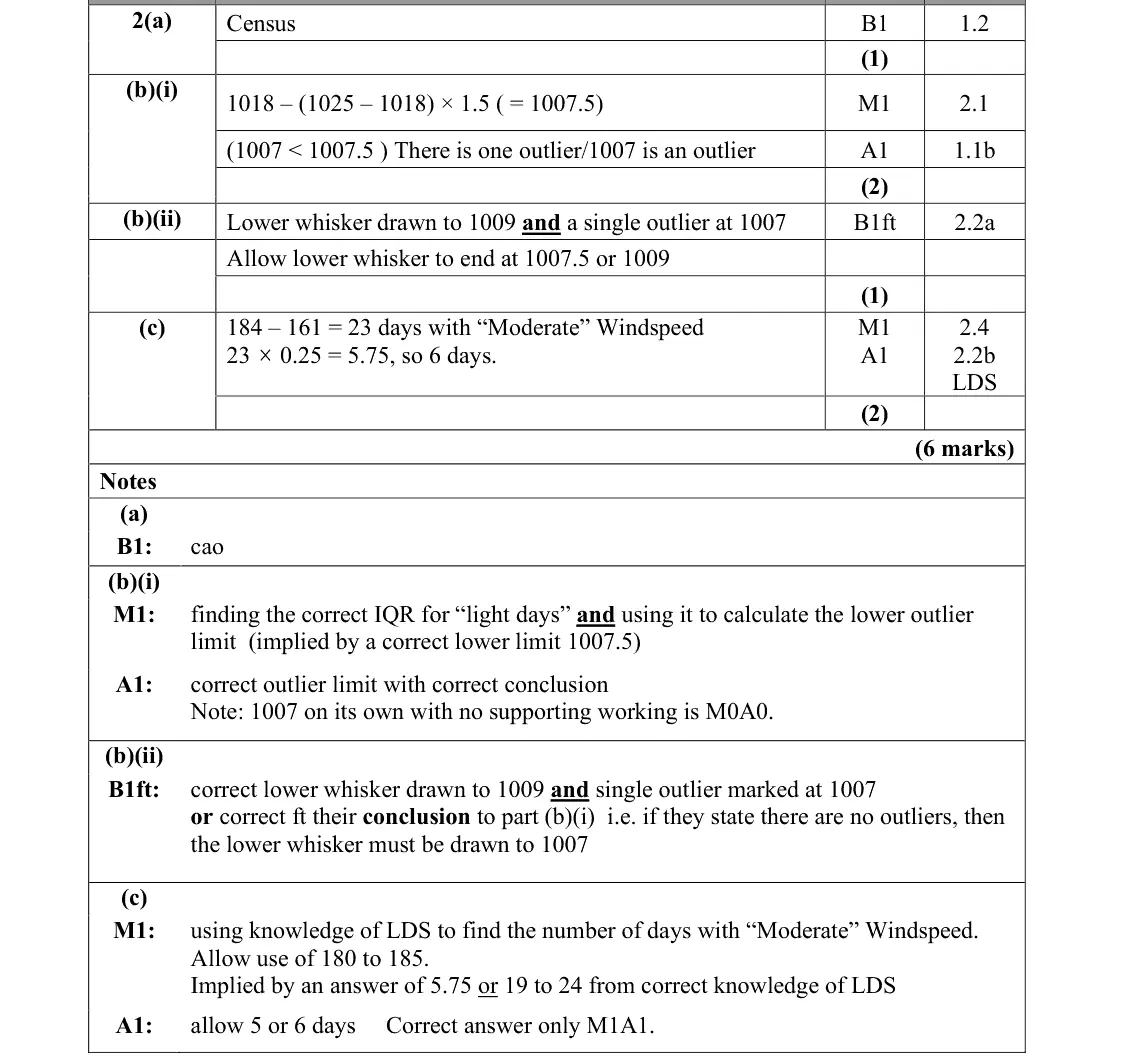
2(a) Sampling 1 —
2(b)(i) Data presentation: histograms, box plots, measures and outliers 2 —
2(b)(ii) Data presentation: histograms, box plots, measures and outliers 1 —
2(c) Data presentation: histograms, box plots, measures and outliers, The large data set 2 —
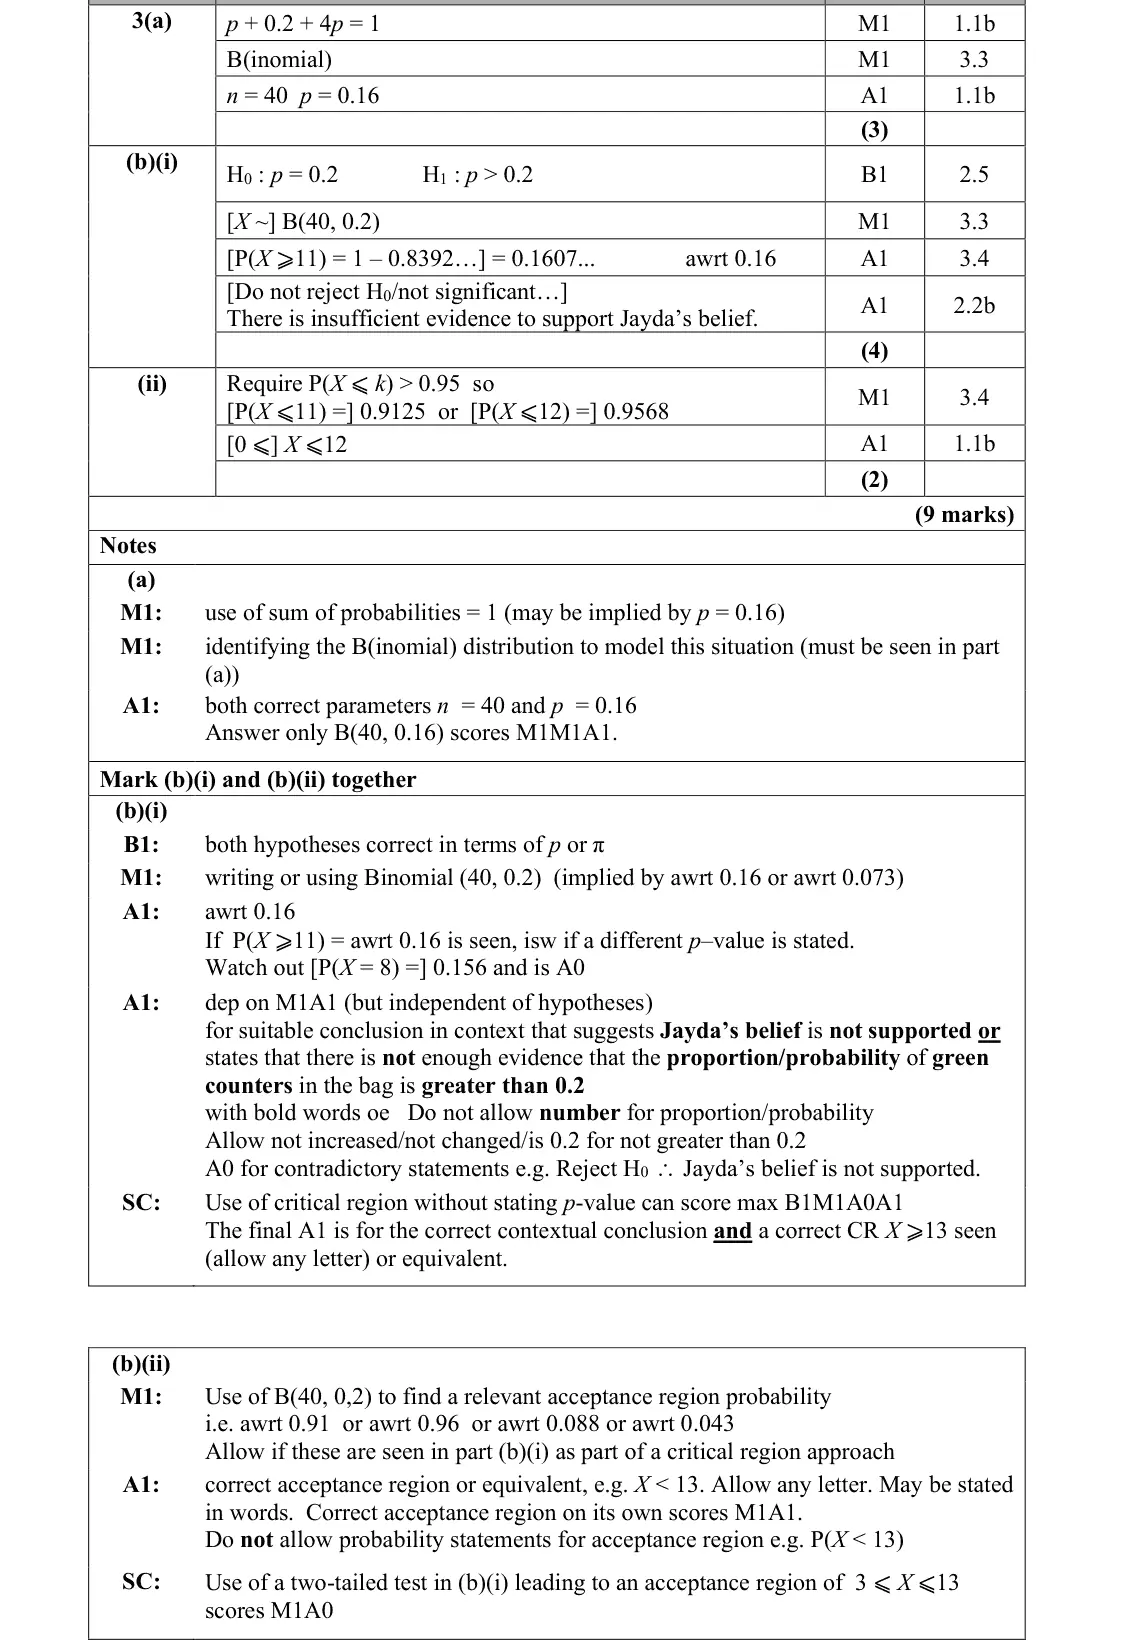
3(a) Discrete distributions and the binomial distribution 3 —
3(b)(i) Hypothesis testing, Discrete distributions and the binomial distribution 4 —
3(b)(ii) Hypothesis testing, Discrete distributions and the binomial distribution 2 —
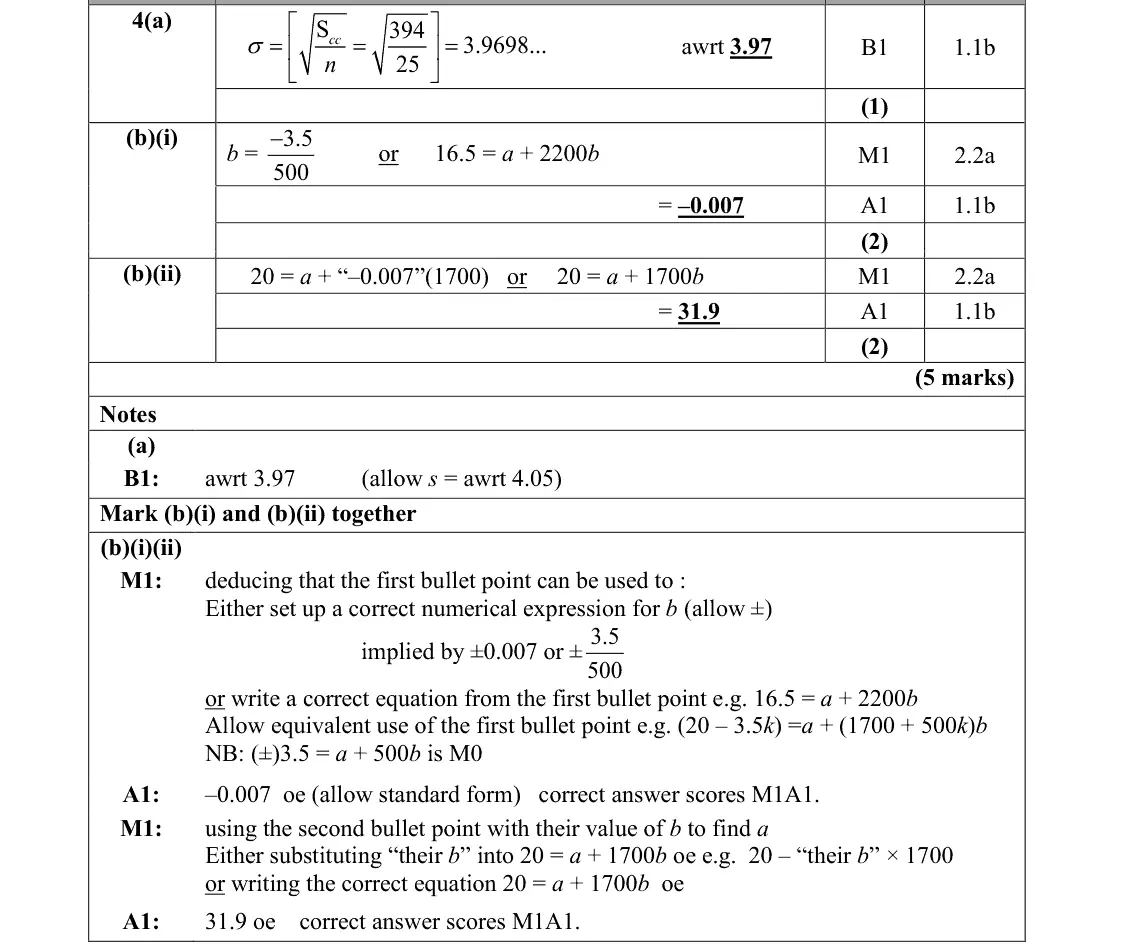
4(a) Data presentation: histograms, box plots, measures and outliers 1 —
4(b)(i) Correlation and regression, Straight lines 2 —
4(b)(ii) Correlation and regression, Simultaneous equations, Straight lines 2 —
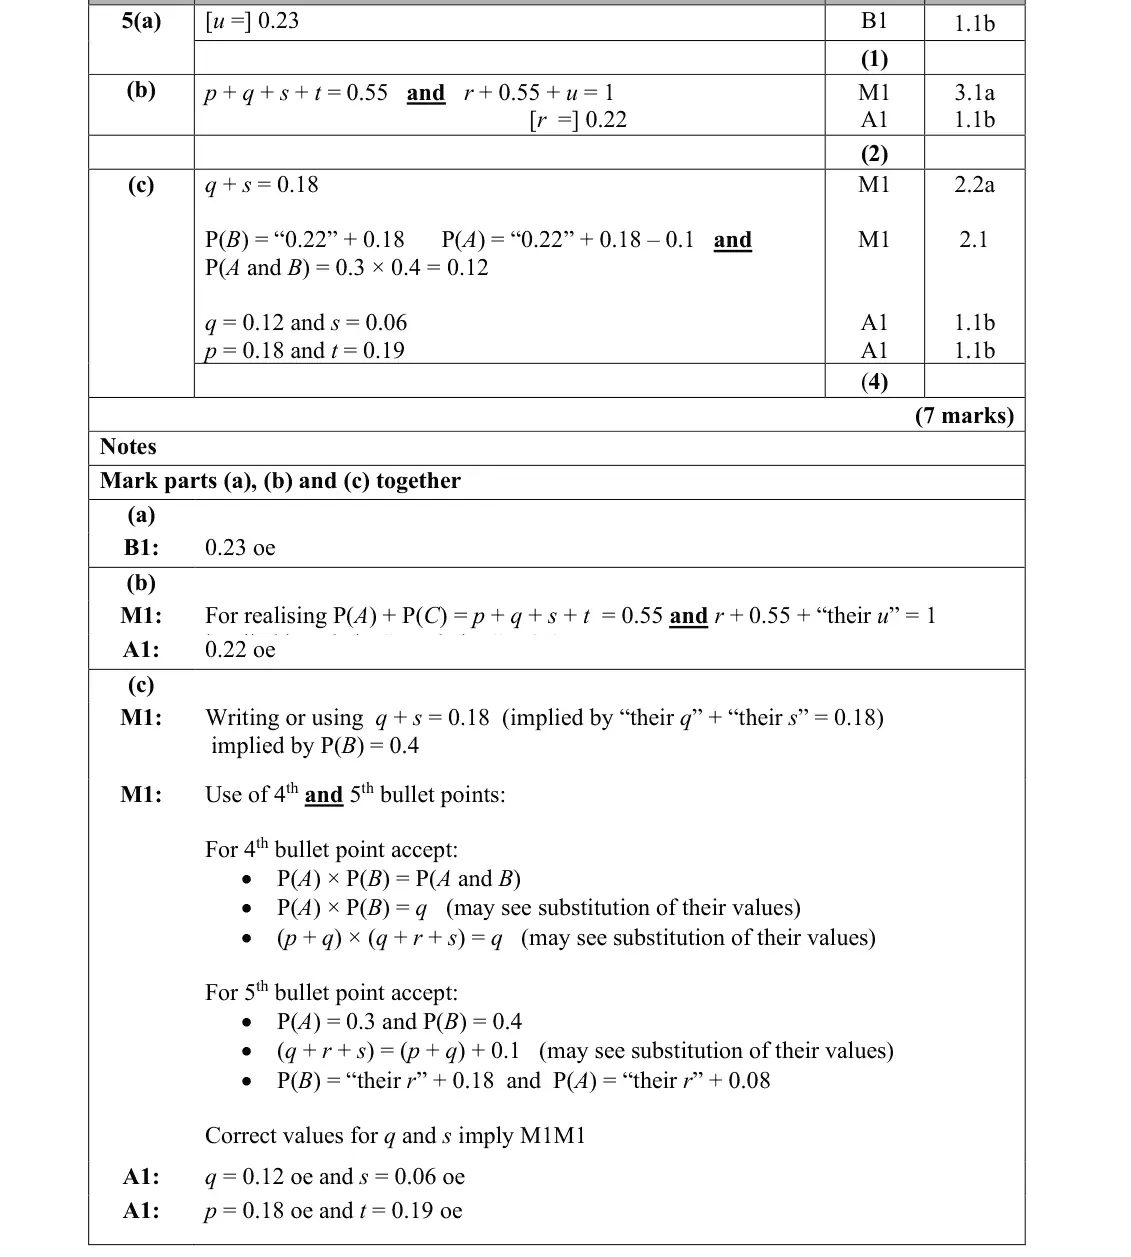
5(a) Probability, including conditional probability 1 —
5(b) Probability, including conditional probability 2 —
5(c) Probability, including conditional probability, Simultaneous equations 4 —

The questions

1(a)1(b)1(c)2(a)2(b)(i)2(b)(ii)2(c)3(a)3(b)(i)3(b)(ii)4(a)4(b)(i)4(b)(ii)5(a)5(b)5(c)
June 2025 · AS Paper 2 (Statistics) · Q1(a) 1 mark binomial distribution
1. The random variable X ~ B(20, 0.37) (a) Find P(X = 8) (1)
June 2025 · AS Paper 2 (Statistics) · Q1(b) 1 mark binomial distribution
(b) Find P(X 5) (1)
June 2025 · AS Paper 2 (Statistics) · Q1(c) 1 mark binomial distribution
(c) Find P(X 5.7) (1)
June 2025 · AS Paper 2 (Statistics) · Q2(a) 1 mark sampling
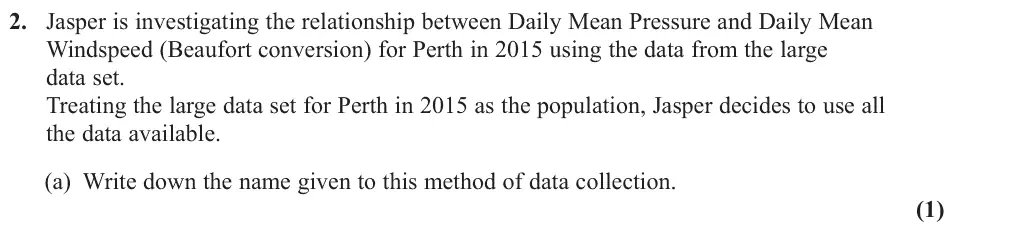
2. Jasper is investigating the relationship between Daily Mean Pressure and Daily Mean Windspeed (Beaufort conversion) for Perth in 2015 using the data from the large data set. Treating the large data set for Perth in 2015 as the population, Jasper decides to use all the data available. (a) Write down the name given to this method of data collection. (1)
June 2025 · AS Paper 2 (Statistics) · Q2(b)(i) 2 marks data presentation
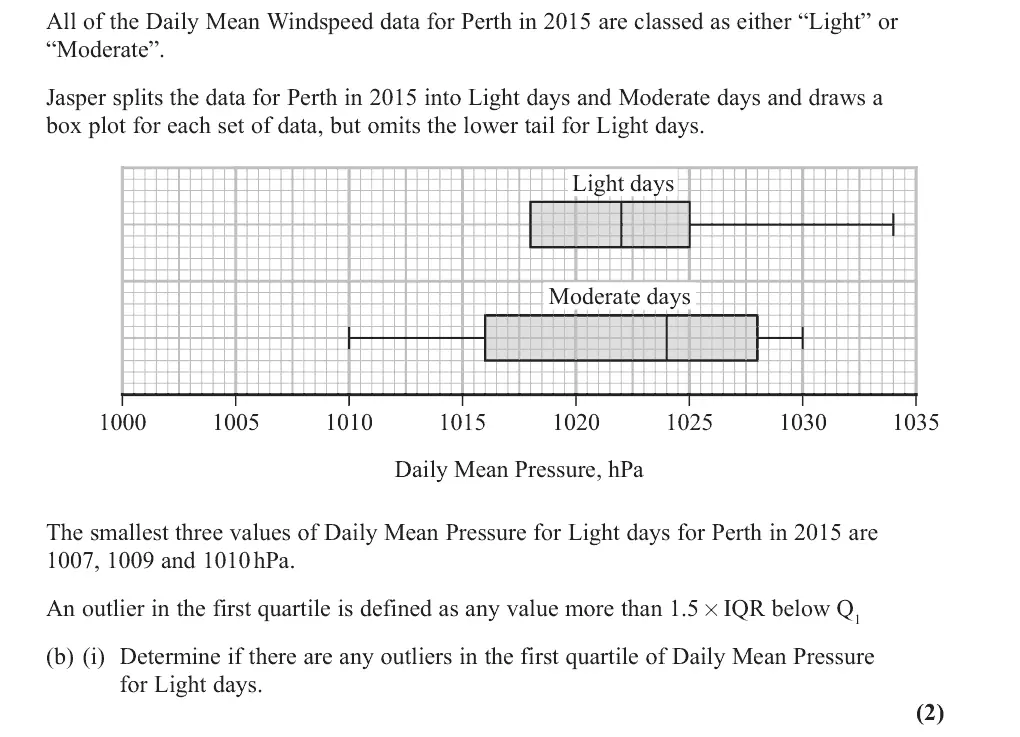
All of the Daily Mean Windspeed data for Perth in 2015 are classed as either “Light” or “Moderate”. Jasper splits the data for Perth in 2015 into Light days and Moderate days and draws a box plot for each set of data, but omits the lower tail for Light days. Light days Moderate days 1000 1005 1010 1015 1020 1025 1030 1035 Daily Mean Pressure, hPa The smallest three values of Daily Mean Pressure for Light days for Perth in 2015 are 1007, 1009 and 1010 hPa. An outlier in the first quartile is defined as any value more than 1.5 x IQR below Q1 (b) (i) Determine if there are any outliers in the first quartile of Daily Mean Pressure for Light days. (2)
June 2025 · AS Paper 2 (Statistics) · Q2(b)(ii) 1 mark data presentation
(ii) Hence, complete the box plot of Daily Mean Pressure for Light days. (1)
June 2025 · AS Paper 2 (Statistics) · Q2(c) 2 marks data presentationlarge data set
The box plot for Light days is based on data for 161 days. (c) Using your knowledge of the large data set, estimate the number of Moderate days with a Daily Mean Pressure of 1028 hPa and higher in the large data set for Perth in 2015. (2)
June 2025 · AS Paper 2 (Statistics) · Q3(a) 3 marks binomial distribution
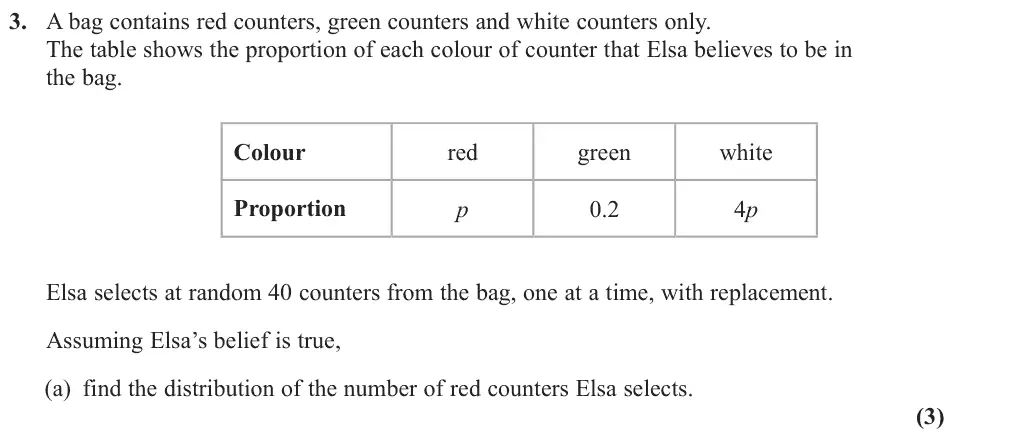
3. A bag contains red counters, green counters and white counters only. The table shows the proportion of each colour of counter that Elsa believes to be in the bag. Colour red green white Proportion p 0.2 4p Elsa selects at random 40 counters from the bag, one at a time, with replacement. Assuming Elsa’s belief is true, (a) find the distribution of the number of red counters Elsa selects. (3)
June 2025 · AS Paper 2 (Statistics) · Q3(b)(i) 4 marks hypothesis testingbinomial distribution
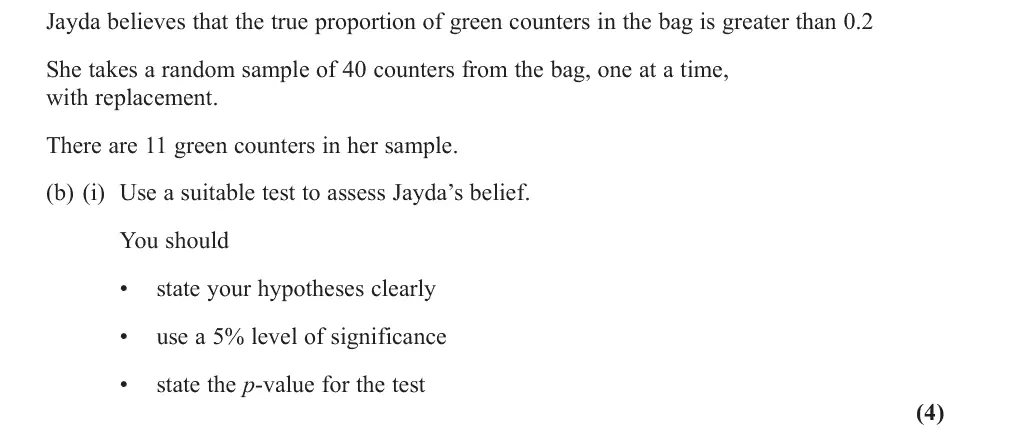
Jayda believes that the true proportion of green counters in the bag is greater than 0.2 She takes a random sample of 40 counters from the bag, one at a time, with replacement. There are 11 green counters in her sample. (b) (i) Use a suitable test to assess Jayda’s belief. You should • state your hypotheses clearly • use a 5% level of significance • state the p‑value for the test (4)
June 2025 · AS Paper 2 (Statistics) · Q3(b)(ii) 2 marks hypothesis testingbinomial distribution
(ii) Find the acceptance region for the test in part (i). (2)
June 2025 · AS Paper 2 (Statistics) · Q4(a) 1 mark data presentation
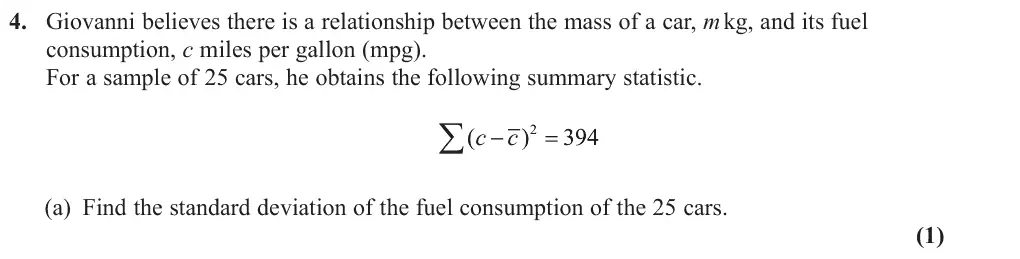
4. Giovanni believes there is a relationship between the mass of a car, m kg, and its fuel consumption, c miles per gallon (mpg). For a sample of 25 cars, he obtains the following summary statistic. : c c ( ) (a) Find the standard deviation of the fuel consumption of the 25 cars. (1)
June 2025 · AS Paper 2 (Statistics) · Q4(b)(i) 2 marks correlation and regressionstraight lines
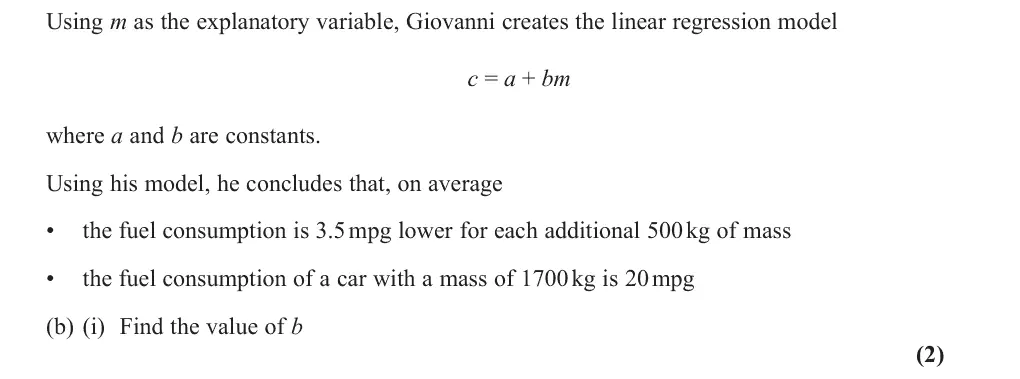
Using m as the explanatory variable, Giovanni creates the linear regression model c = a + bm where a and b are constants. Using his model, he concludes that, on average • the fuel consumption is 3.5 mpg lower for each additional 500 kg of mass • the fuel consumption of a car with a mass of 1700 kg is 20 mpg (b) (i) Find the value of b (2)
June 2025 · AS Paper 2 (Statistics) · Q4(b)(ii) 2 marks correlation and regressionsimultaneous equationsstraight lines
(ii) Find the value of a (2)
June 2025 · AS Paper 2 (Statistics) · Q5(a) 1 mark probability
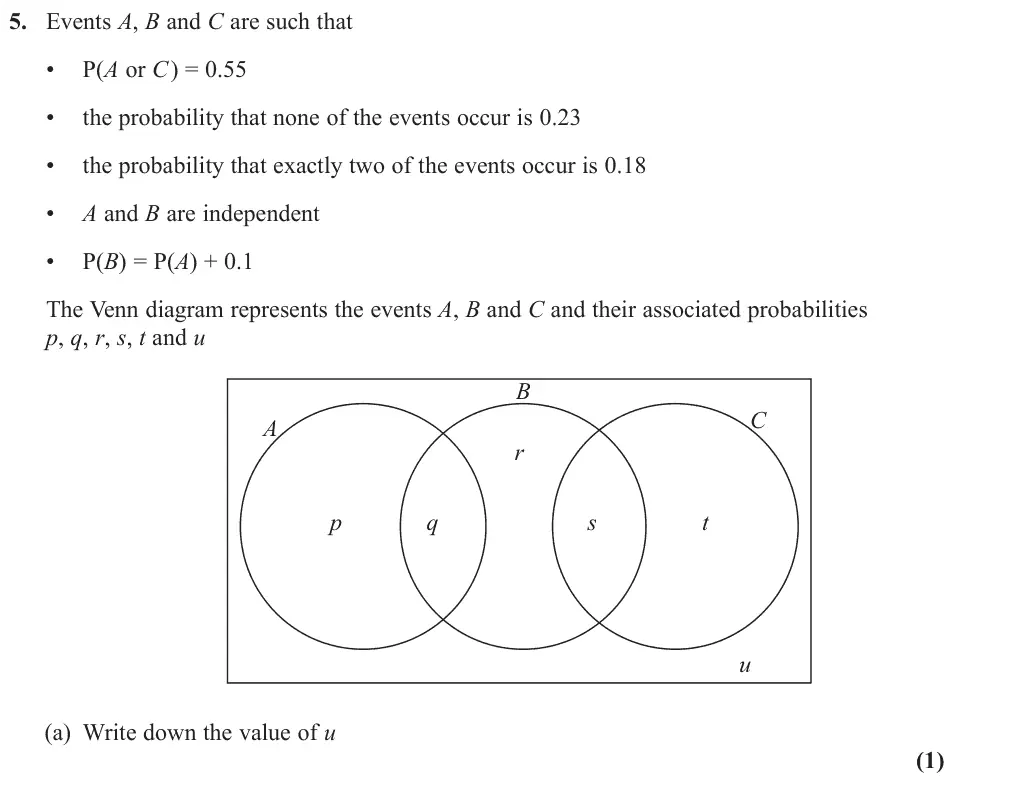
5. Events A, B and C are such that • P(A or C) = 0.55 • the probability that none of the events occur is 0.23 • the probability that exactly two of the events occur is 0.18 • A and B are independent • P(B) = P(A) + 0.1 The Venn diagram represents the events A, B and C and their associated probabilities p, q, r, s, t and u B C A r p q s t u (a) Write down the value of u (1)
June 2025 · AS Paper 2 (Statistics) · Q5(b) 2 marks probability
(b) Find the value of r (2)
June 2025 · AS Paper 2 (Statistics) · Q5(c) 4 marks probabilitysimultaneous equations
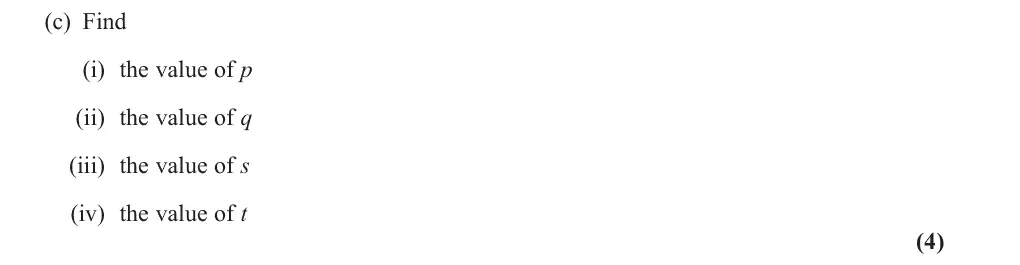
(c) Find (i) the value of p (ii) the value of q (iii) the value of s (iv) the value of t (4)

Find an Edexcel maths tutor

Want this paper marked and gone through with you? Message us.

Prefer email? Send an enquiry

If you are under 18, please include a parent's contact details. Enquiries go to enquiries@mathsaleveltutor.com and are deleted once handled.