June 2024: Paper 3 Section A: Statistics

50 marks · 24 question parts · Question paper, mark scheme and examiner's report on Pearson's site

Question by question

QTopicMarksDifficulty
1(a) Discrete distributions and the binomial distribution 3 —
1(b) Discrete distributions and the binomial distribution 3 —
1(c) Discrete distributions and the binomial distribution 1 —
1(d) Normal distribution, Discrete distributions and the binomial distribution 4 —
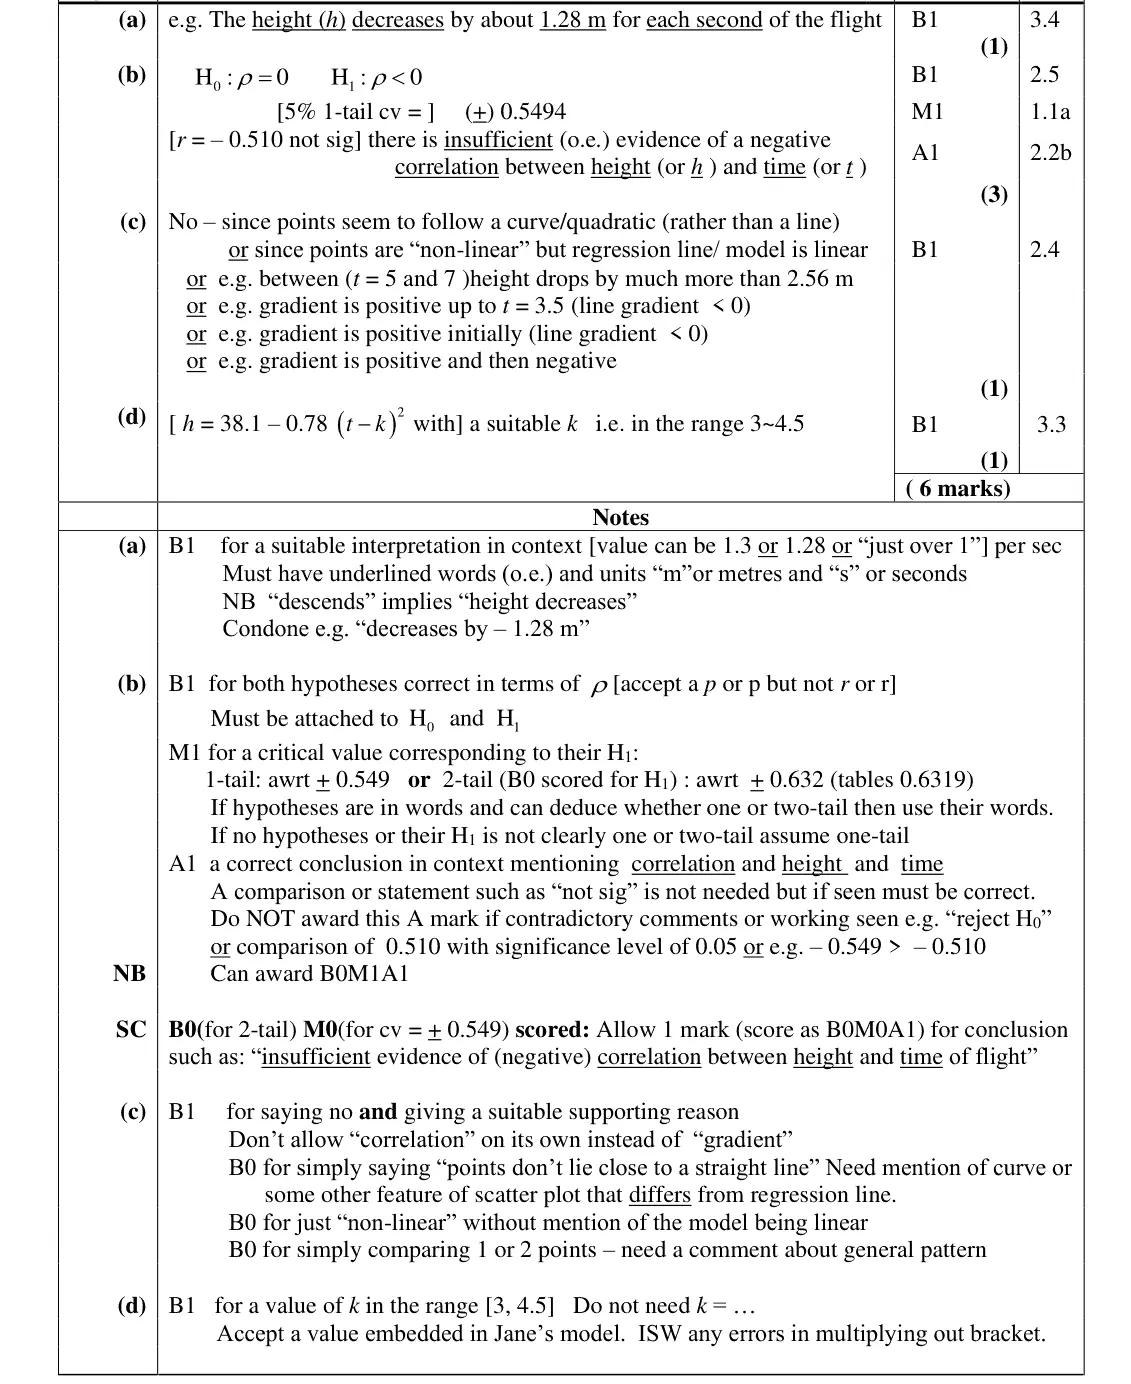
2(a) Correlation and regression 1 —
2(b) Hypothesis testing, Correlation and regression 3 —
2(c) Correlation and regression 1 —
2(d) Correlation and regression, Quadratics and the discriminant 1 —
3(a) Data presentation: histograms, box plots, measures and outliers, The large data set 1 —
3(b) Data presentation: histograms, box plots, measures and outliers 3 —
3(c) Data presentation: histograms, box plots, measures and outliers, The large data set 2 —
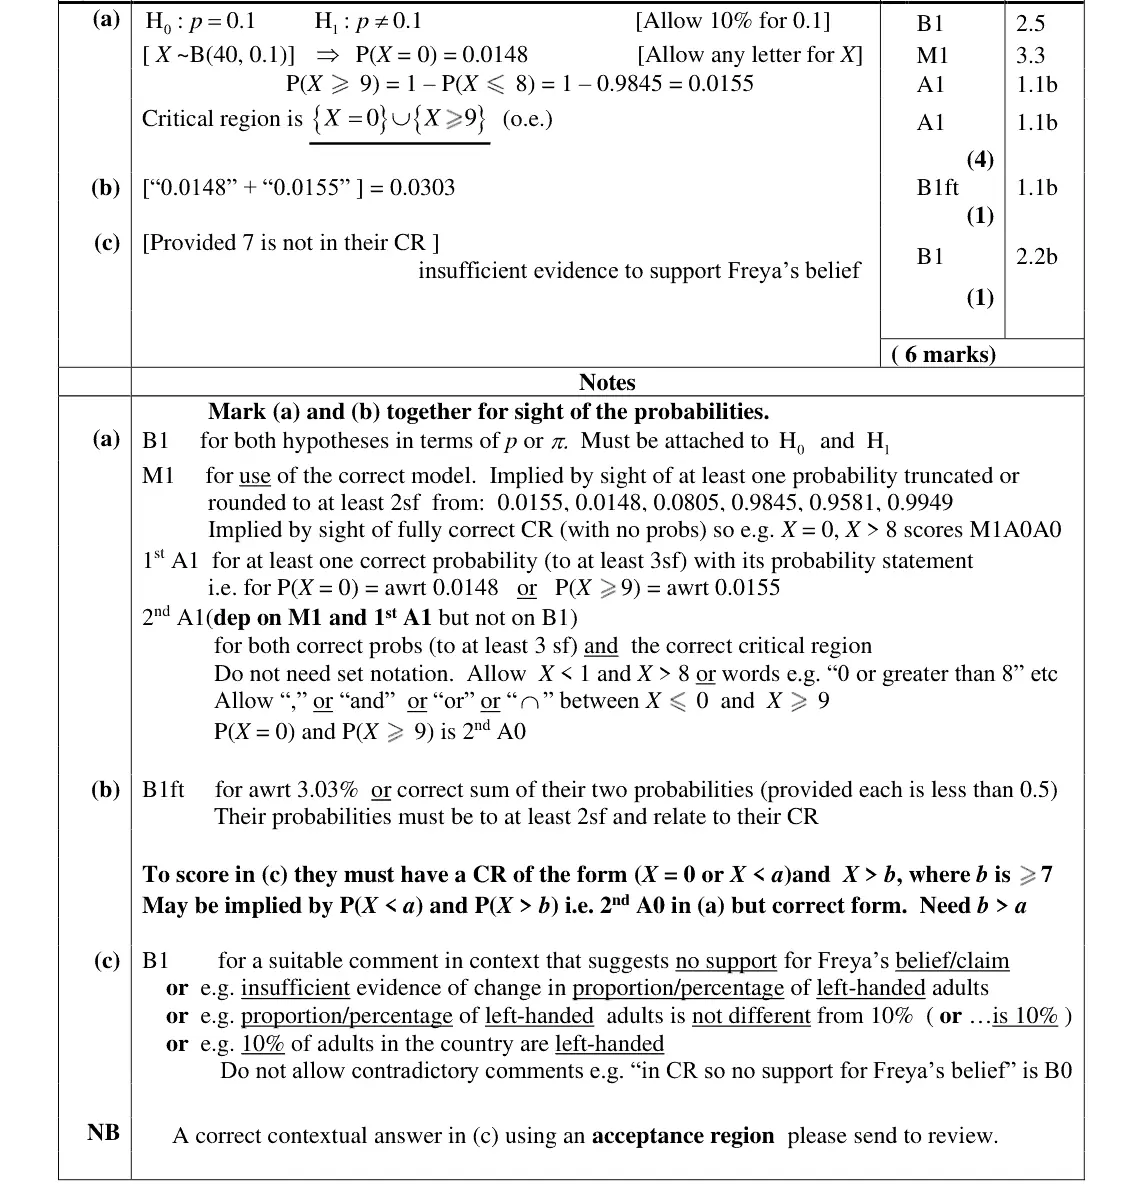
4(a) Hypothesis testing, Discrete distributions and the binomial distribution 4 —
4(b) Hypothesis testing 1 —
4(c) Hypothesis testing 1 —
5(a) Normal distribution 1 —
5(b) Probability, including conditional probability 1 —
5(c) Normal distribution, Probability, including conditional probability 3 —
5(d) Normal distribution, Simultaneous equations 5 —
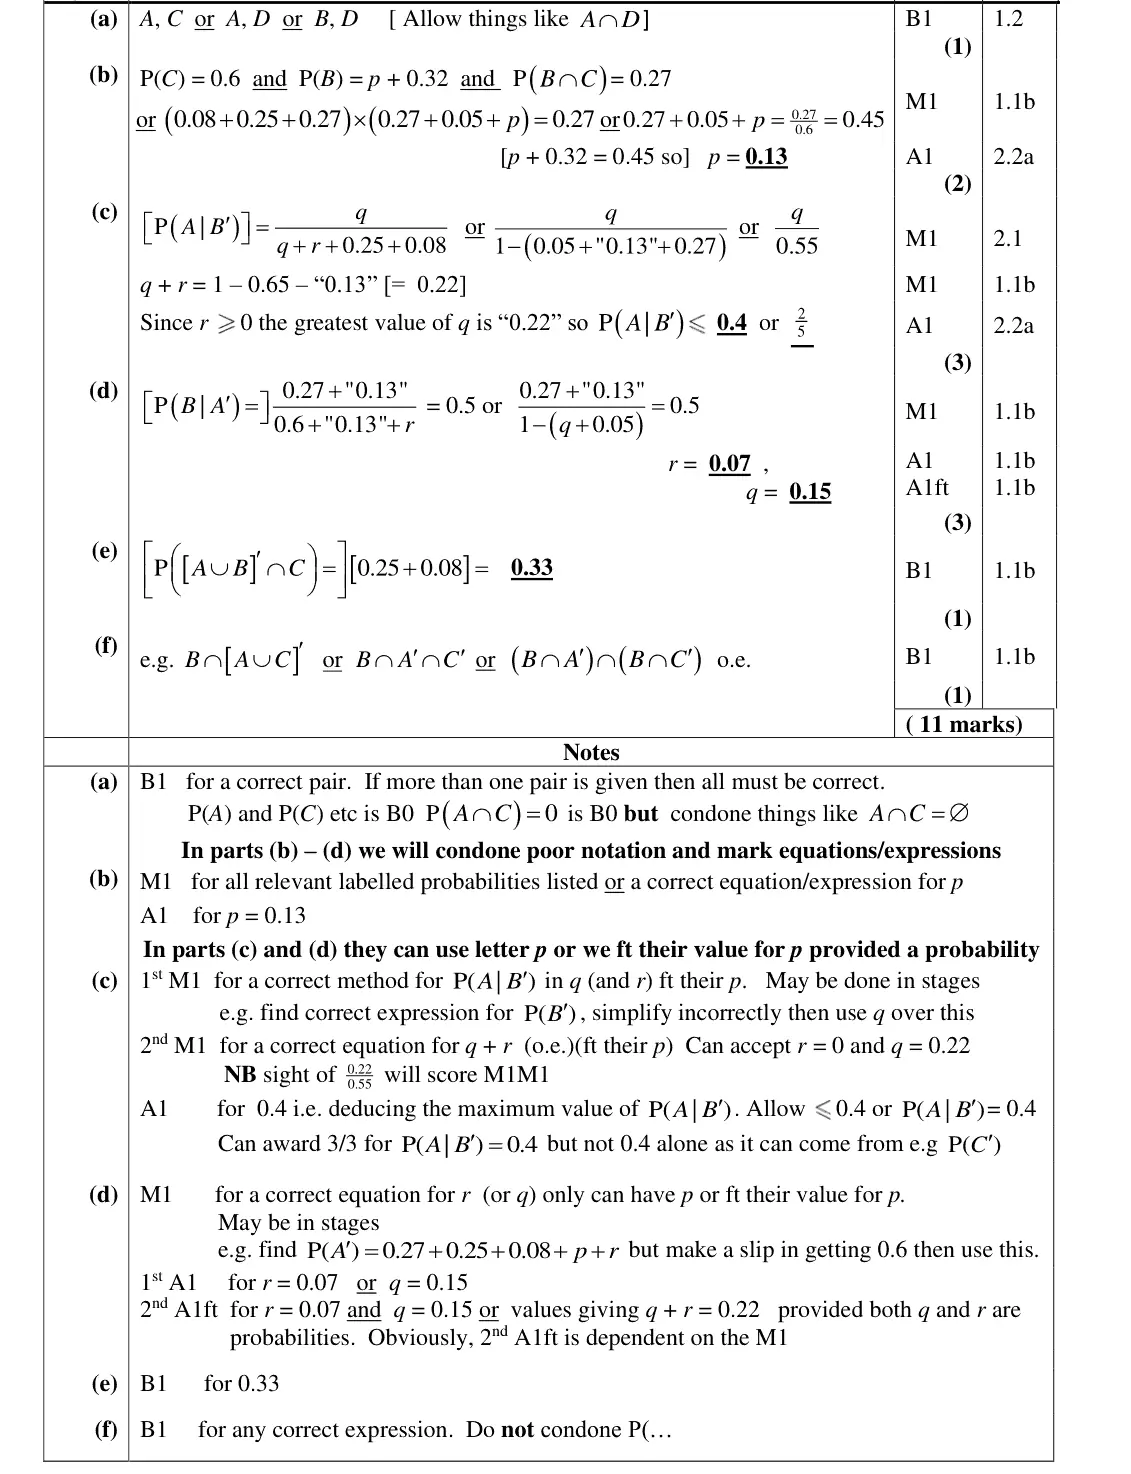
6(a) Probability, including conditional probability 1 —
6(b) Probability, including conditional probability 2 —
6(c) Probability, including conditional probability 3 —
6(d) Probability, including conditional probability 3 —
6(e) Probability, including conditional probability 1 —
6(f) Probability, including conditional probability 1 —

The questions

1(a)1(b)1(c)1(d)2(a)2(b)2(c)2(d)3(a)3(b)3(c)4(a)4(b)4(c)5(a)5(b)5(c)5(d)6(a)6(b)6(c)6(d)6(e)6(f)
June 2024 · Paper 3 (Statistics) · Q1(a) 3 marks binomial distribution
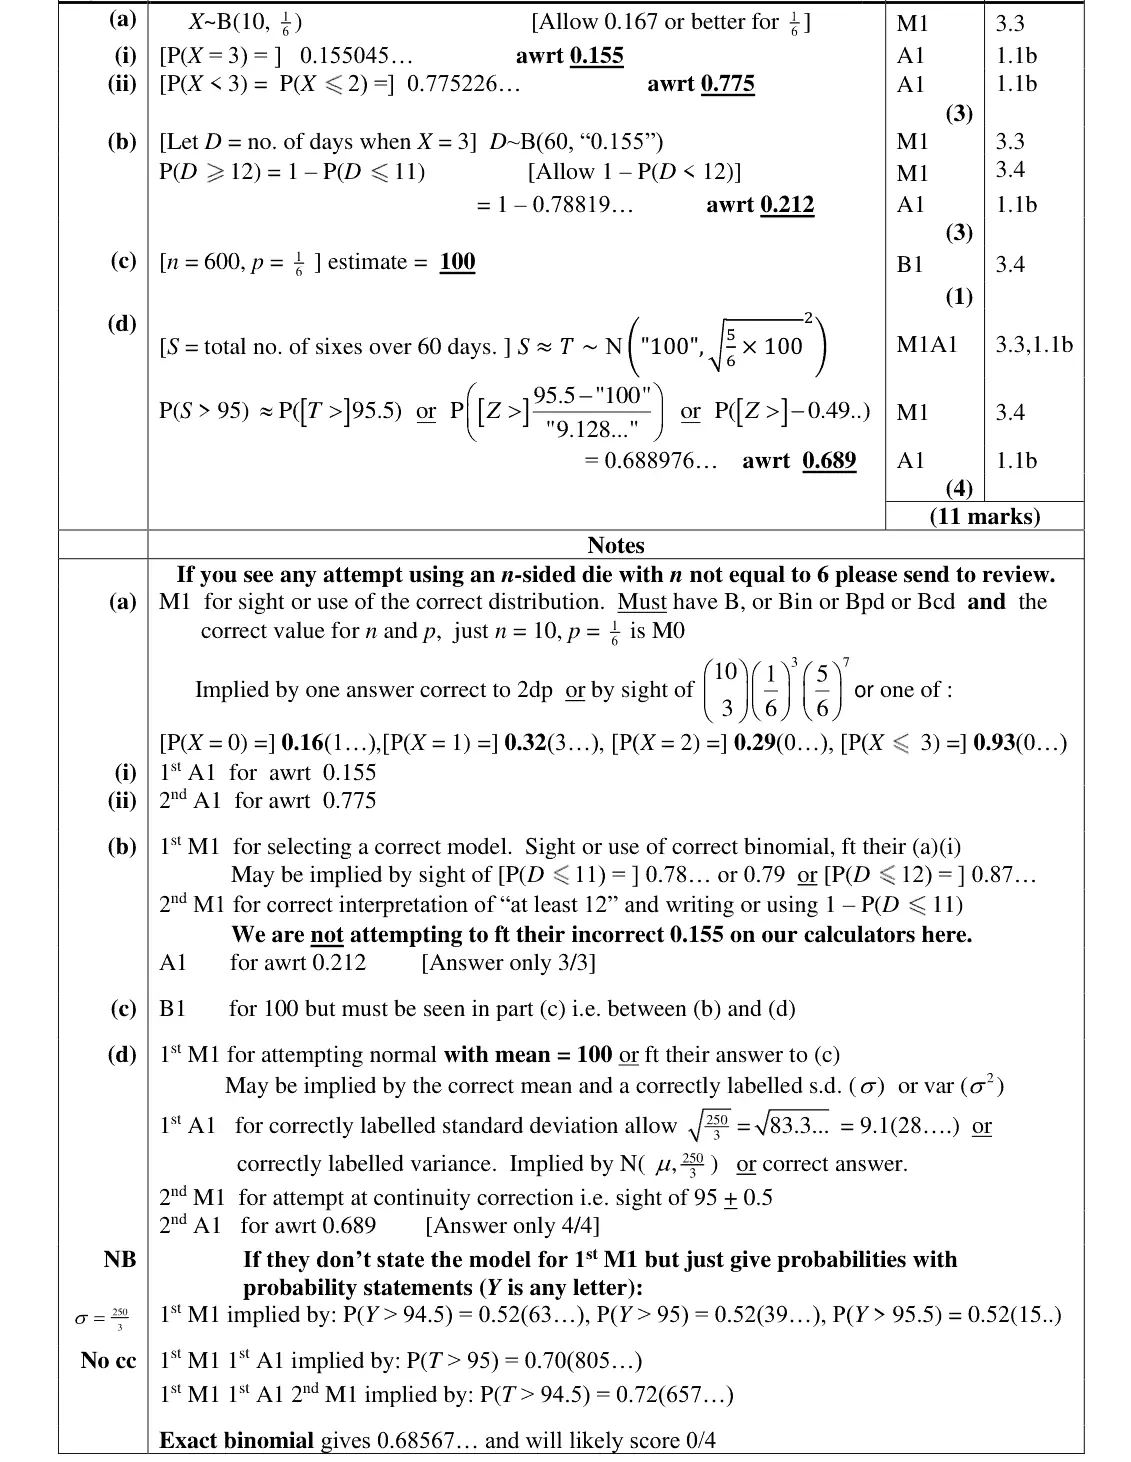
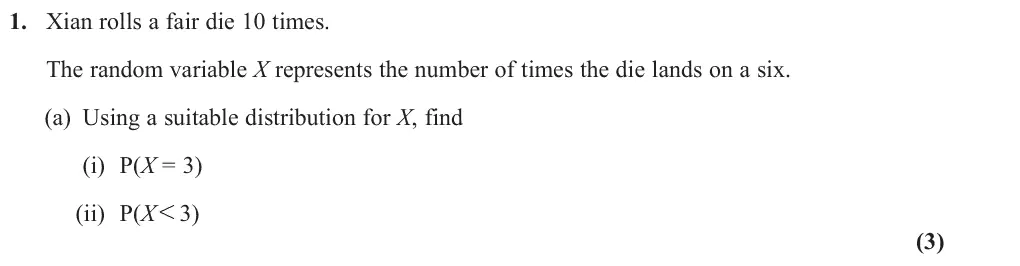
1. Xian rolls a fair die 10 times. The random variable X represents the number of times the die lands on a six. (a) Using a suitable distribution for X, find (i) P(X = 3) (ii) P(X<3) (3)
June 2024 · Paper 3 (Statistics) · Q1(b) 3 marks binomial distribution
Xian repeats this experiment each day for 60 days and records the number of days when X = 3 (b) Find the probability that there were at least 12 days when X = 3 (3)
June 2024 · Paper 3 (Statistics) · Q1(c) 1 mark binomial distribution
(c) Find an estimate for the total number of sixes that Xian will roll during these 60 days. (1)
June 2024 · Paper 3 (Statistics) · Q1(d) 4 marks normal distributionbinomial distribution
(d) Use a normal approximation to estimate the probability that Xian rolls a total of more than 95 sixes during these 60 days. (4)
June 2024 · Paper 3 (Statistics) · Q2(a) 1 mark correlation and regression
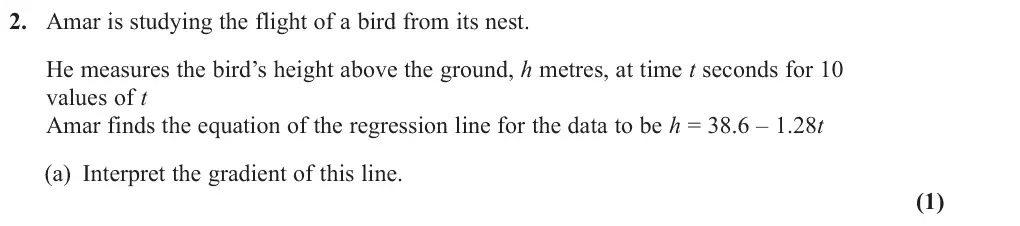
2. Amar is studying the flight of a bird from its nest. He measures the bird’s height above the ground, h metres, at time t seconds for 10 values of t Amar finds the equation of the regression line for the data to be h = 38.6 – 1.28t (a) Interpret the gradient of this line. (1)
June 2024 · Paper 3 (Statistics) · Q2(b) 3 marks hypothesis testingcorrelation and regression
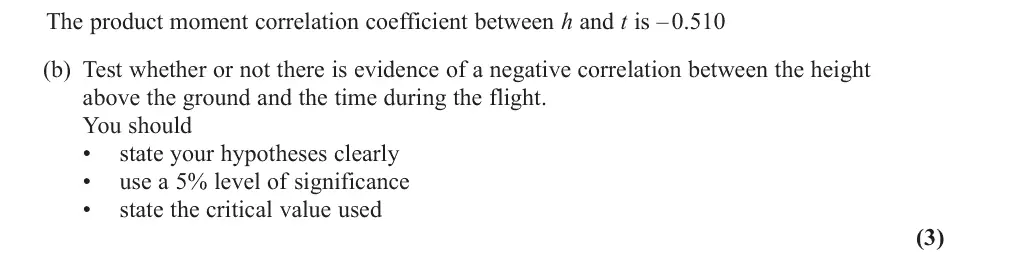
The product moment correlation coefficient between h and t is – 0.510 (b) Test whether or not there is evidence of a negative correlation between the height above the ground and the time during the flight. You should • state your hypotheses clearly • use a 5% level of significance • state the critical value used (3)
June 2024 · Paper 3 (Statistics) · Q2(c) 1 mark correlation and regression
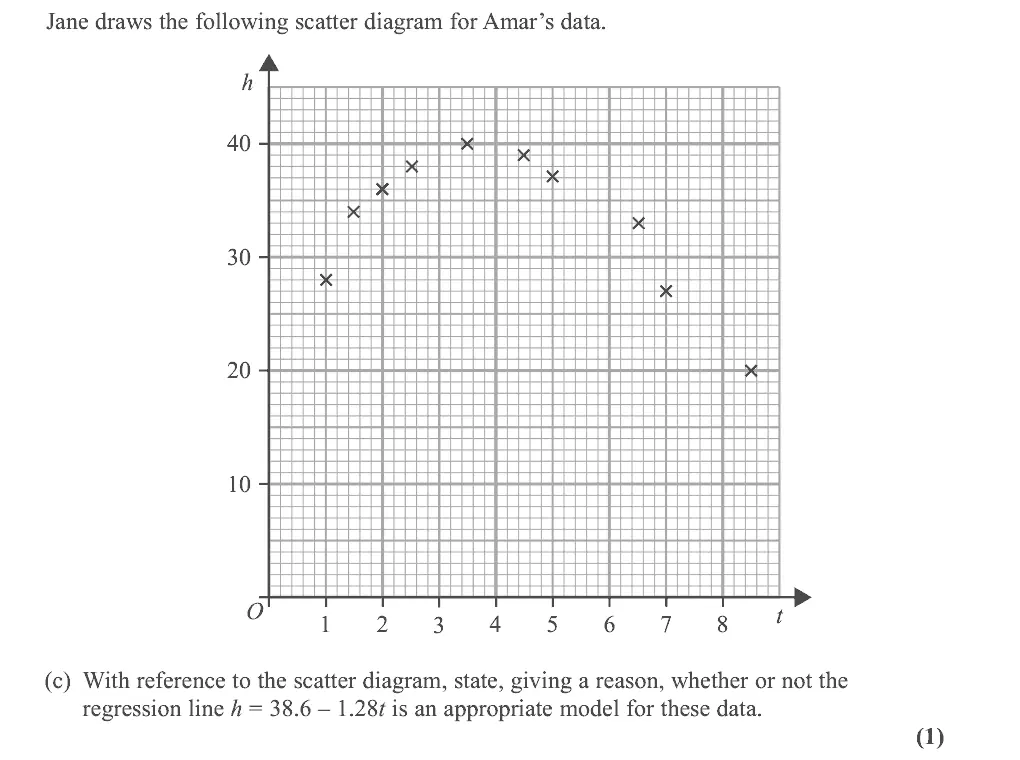
Jane draws the following scatter diagram for Amar’s data. h t (c) With reference to the scatter diagram, state, giving a reason, whether or not the regression line h = 38.6 – 1.28t is an appropriate model for these data. (1)
June 2024 · Paper 3 (Statistics) · Q2(d) 1 mark correlation and regressionquadratics
/ 2 where k is a constant. Jane suggests an improved model using the variable u = t k She obtains the equation h = 38.1 – 0.78u (d) Choose a suitable value for k to write Jane’s improved model for h in terms of t only. (1)
June 2024 · Paper 3 (Statistics) · Q3(a) 1 mark data presentationlarge data set
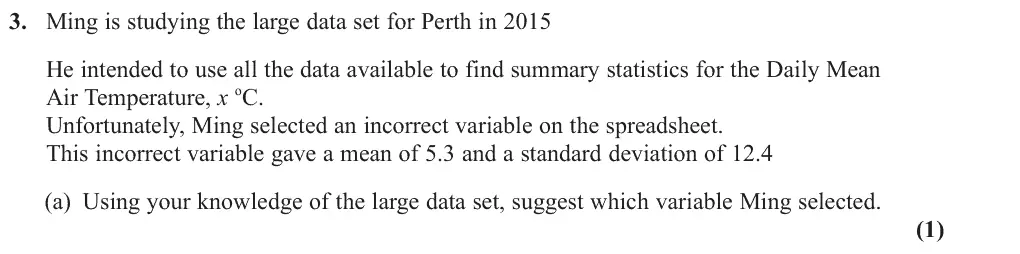
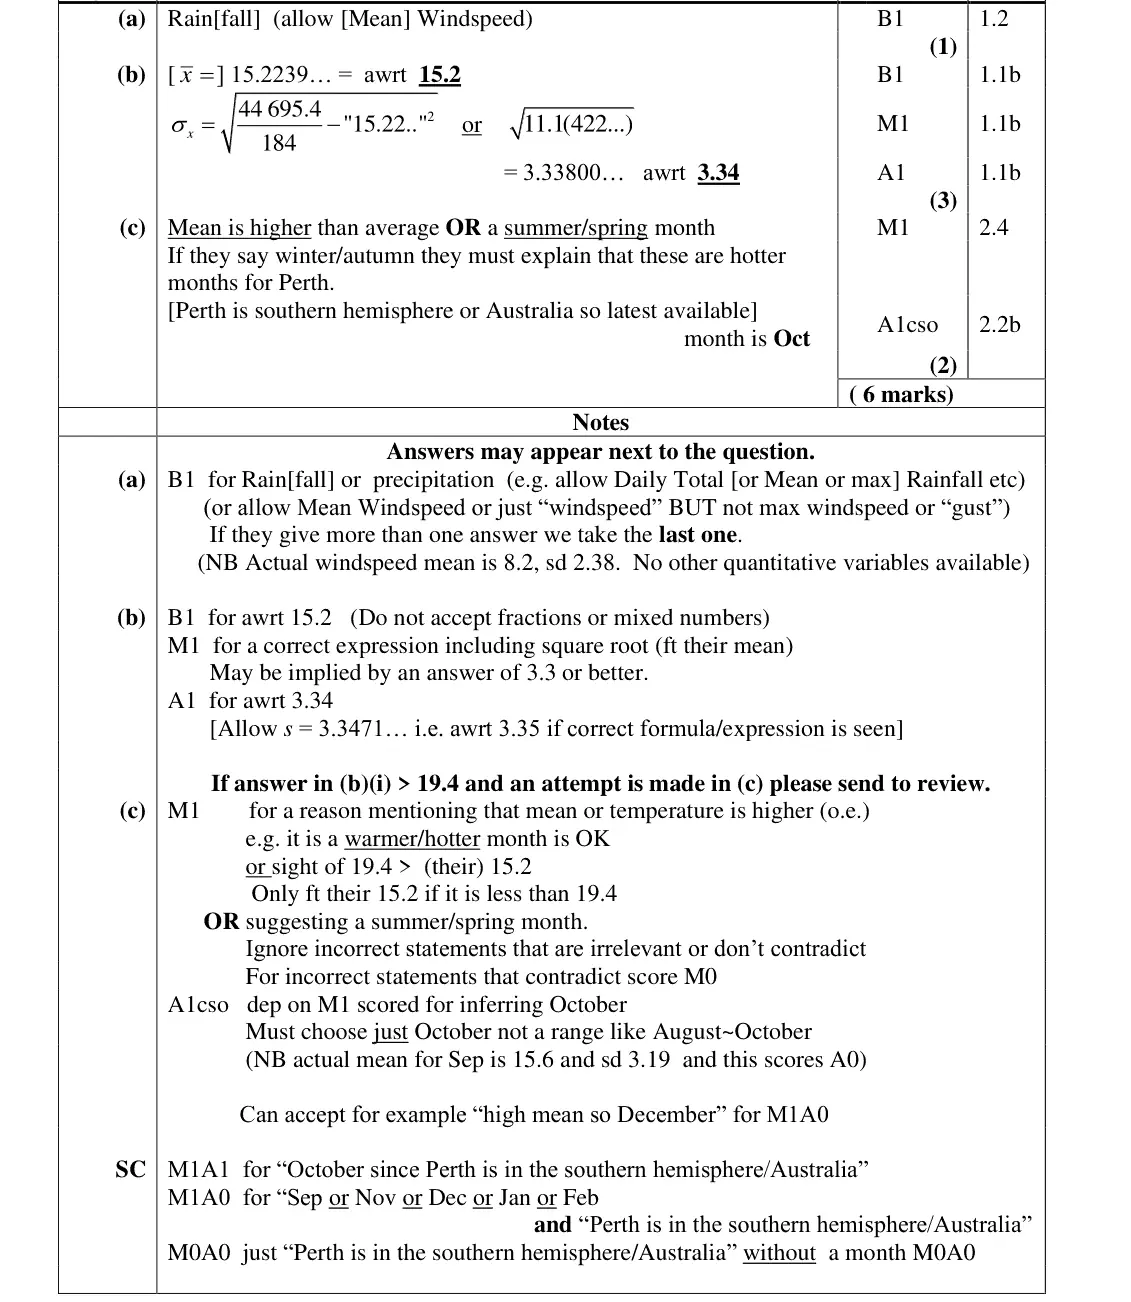
3. Ming is studying the large data set for Perth in 2015 He intended to use all the data available to find summary statistics for the Daily Mean Air Temperature, x oC. Unfortunately, Ming selected an incorrect variable on the spreadsheet. This incorrect variable gave a mean of 5.3 and a standard deviation of 12.4 (a) Using your knowledge of the large data set, suggest which variable Ming selected. (1)
June 2024 · Paper 3 (Statistics) · Q3(b) 3 marks data presentation
The correct values for the Daily Mean Air Temperature are summarised as ; ; x O 2801 2. x2 n = 184 44 695 4 (b) Calculate the mean and standard deviation for these data. (3)
June 2024 · Paper 3 (Statistics) · Q3(c) 2 marks data presentationlarge data set
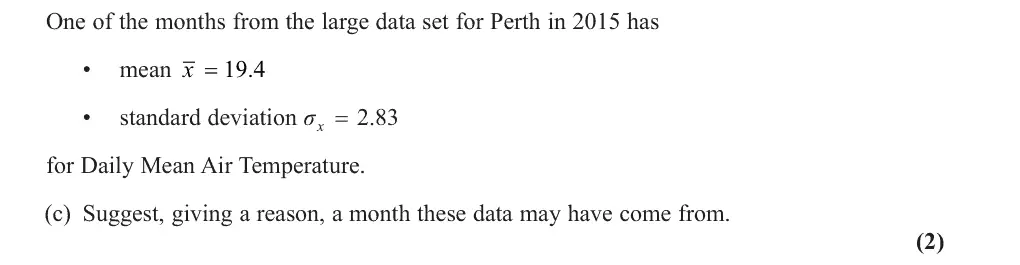
One of the months from the large data set for Perth in 2015 has • mean x = 19 4. • standard deviation sigma x O 2 83 for Daily Mean Air Temperature. (c) Suggest, giving a reason, a month these data may have come from. (2)
June 2024 · Paper 3 (Statistics) · Q4(a) 4 marks hypothesis testingbinomial distribution
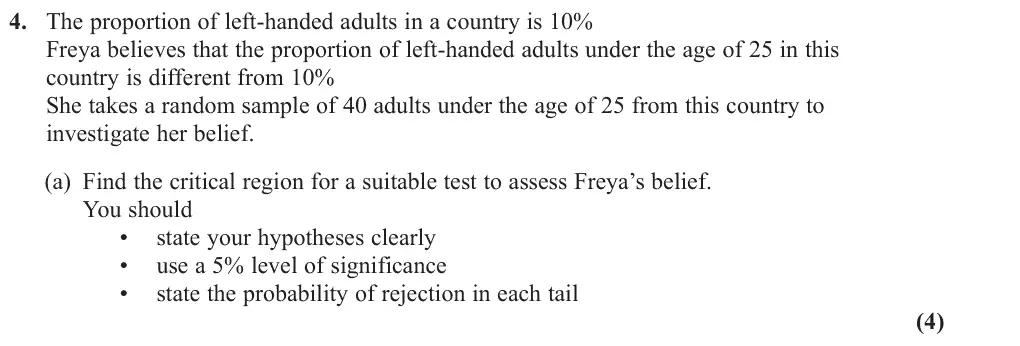
4. The proportion of left-handed adults in a country is 10% Freya believes that the proportion of left-handed adults under the age of 25 in this country is different from 10% She takes a random sample of 40 adults under the age of 25 from this country to investigate her belief. (a) Find the critical region for a suitable test to assess Freya’s belief. You should • state your hypotheses clearly • use a 5% level of significance • state the probability of rejection in each tail (4)
June 2024 · Paper 3 (Statistics) · Q4(b) 1 mark hypothesis testing
(b) Write down the actual significance level of your test in part (a) (1)
June 2024 · Paper 3 (Statistics) · Q4(c) 1 mark hypothesis testing
In Freya’s sample 7 adults were left-handed. (c) With reference to your answer in part (a) comment on Freya’s belief. (1)
June 2024 · Paper 3 (Statistics) · Q5(a) 1 mark normal distribution
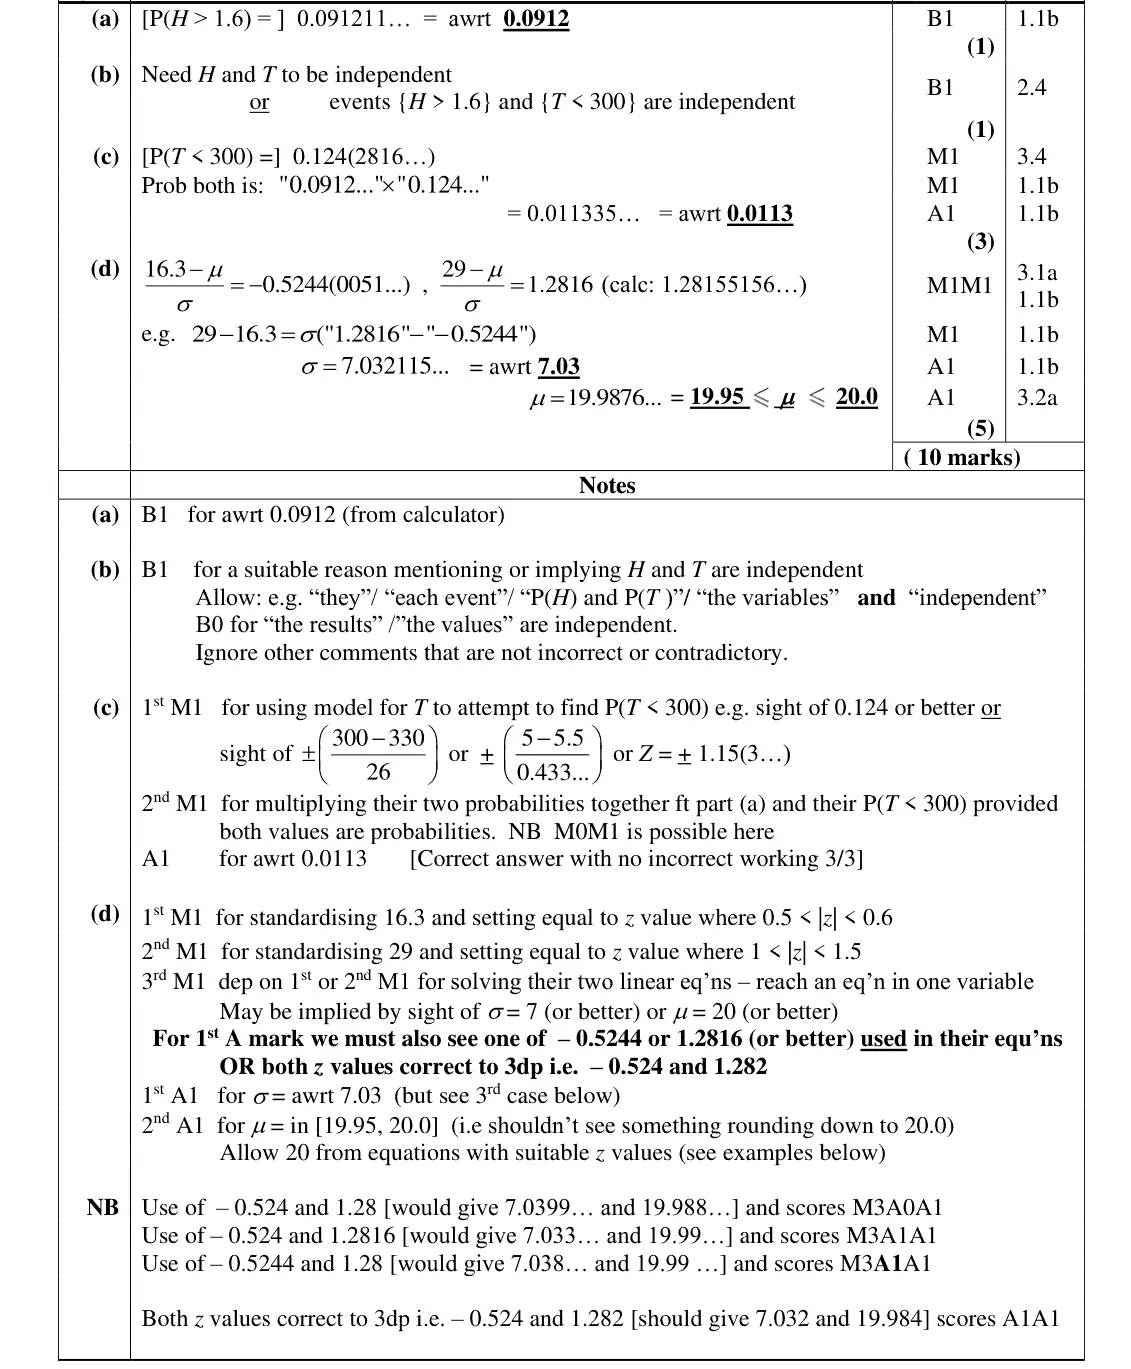
5. The records for a school athletics club show that the height, H metres, achieved by students in the high jump is normally distributed with mean 1.4 metres and standard deviation 0.15 metres. (a) Find the proportion of these students achieving a height of more than 1.6 metres. (1)
June 2024 · Paper 3 (Statistics) · Q5(b) 1 mark probability
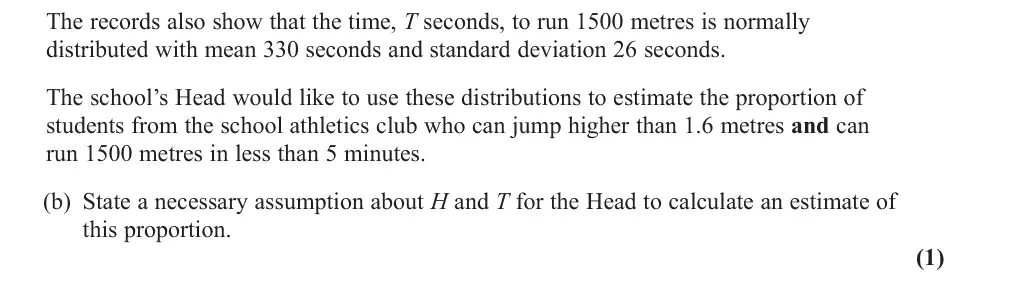
The records also show that the time, T seconds, to run 1500 metres is normally distributed with mean 330 seconds and standard deviation 26 seconds. The school’s Head would like to use these distributions to estimate the proportion of students from the school athletics club who can jump higher than 1.6 metres and can run 1500 metres in less than 5 minutes. (b) State a necessary assumption about H and T for the Head to calculate an estimate of this proportion. (1)
June 2024 · Paper 3 (Statistics) · Q5(c) 3 marks normal distributionprobability
(c) Find the Head’s estimate of this proportion. (3)
June 2024 · Paper 3 (Statistics) · Q5(d) 5 marks normal distributionsimultaneous equations
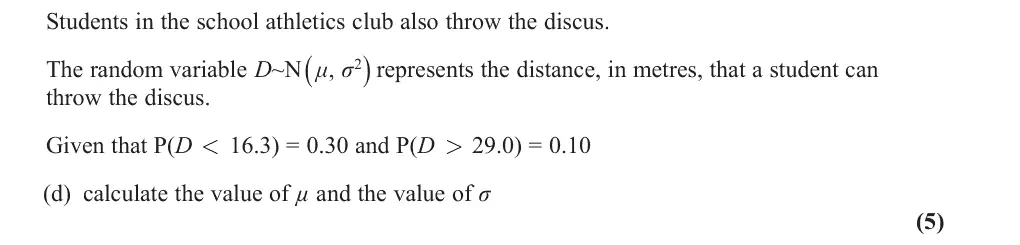
Students in the school athletics club also throw the discus. The random variable D~N μ sigma 2 represents the distance, in metres, that a student can , throw the discus. Given that P(D < 16.3) = 0.30 and P(D 29.0) = 0.10 < (d) calculate the value of mu and the value of sigma (5)
June 2024 · Paper 3 (Statistics) · Q6(a) 1 mark probability
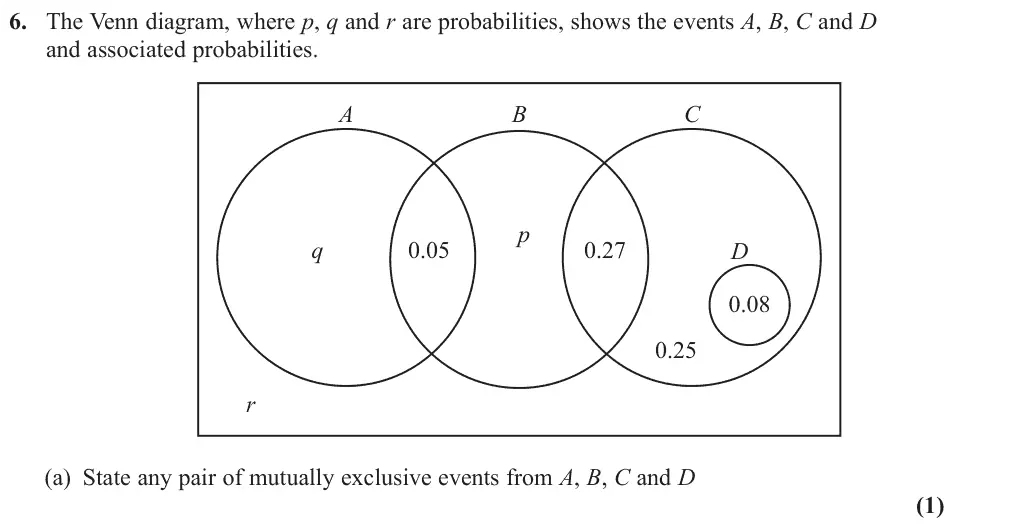
6. The Venn diagram, where p, q and r are probabilities, shows the events A, B, C and D and associated probabilities. A B C p q 0.05 0.27 0.08 0.25 r (a) State any pair of mutually exclusive events from A, B, C and D (1)
June 2024 · Paper 3 (Statistics) · Q6(b) 2 marks probability
The events B and C are independent. (b) Find the value of p (2)
June 2024 · Paper 3 (Statistics) · Q6(c) 3 marks probability
/ (c) Find the greatest possible value of P A B ∑ | (3)
June 2024 · Paper 3 (Statistics) · Q6(d) 3 marks probability
/ O 0 5 Given that P B A ∑ | (d) find the value of q and the value of r (3)
June 2024 · Paper 3 (Statistics) · Q6(e) 1 mark probability
/ Ç∑8 Ä (e) Find P A B C < (1)
June 2024 · Paper 3 (Statistics) · Q6(f) 1 mark probability
(f) Use set notation to write an expression for the event with probability p (1)

Find an Edexcel maths tutor

Want this paper marked and gone through with you? Message us.

Prefer email? Send an enquiry

If you are under 18, please include a parent's contact details. Enquiries go to enquiries@mathsaleveltutor.com and are deleted once handled.