June 2019: Paper 3 Section A: Statistics

50 marks · 21 question parts · Question paper, mark scheme and examiner's report on Pearson's site

Question by question

QTopicMarksDifficulty
1(a) Probability, including conditional probability 2 Medium
1(b) Probability, including conditional probability 2 Medium
1(c) Probability, including conditional probability 2 Medium
1(d) Probability, including conditional probability 2 Medium
2(a) Data presentation: histograms, box plots, measures and outliers 4 —
2(b) Data presentation: histograms, box plots, measures and outliers, The large data set 1 —
2(c) Data presentation: histograms, box plots, measures and outliers 1 —
2(d) Normal distribution, Data presentation: histograms, box plots, measures and outliers 3 —
2(e) Normal distribution, The large data set 2 —
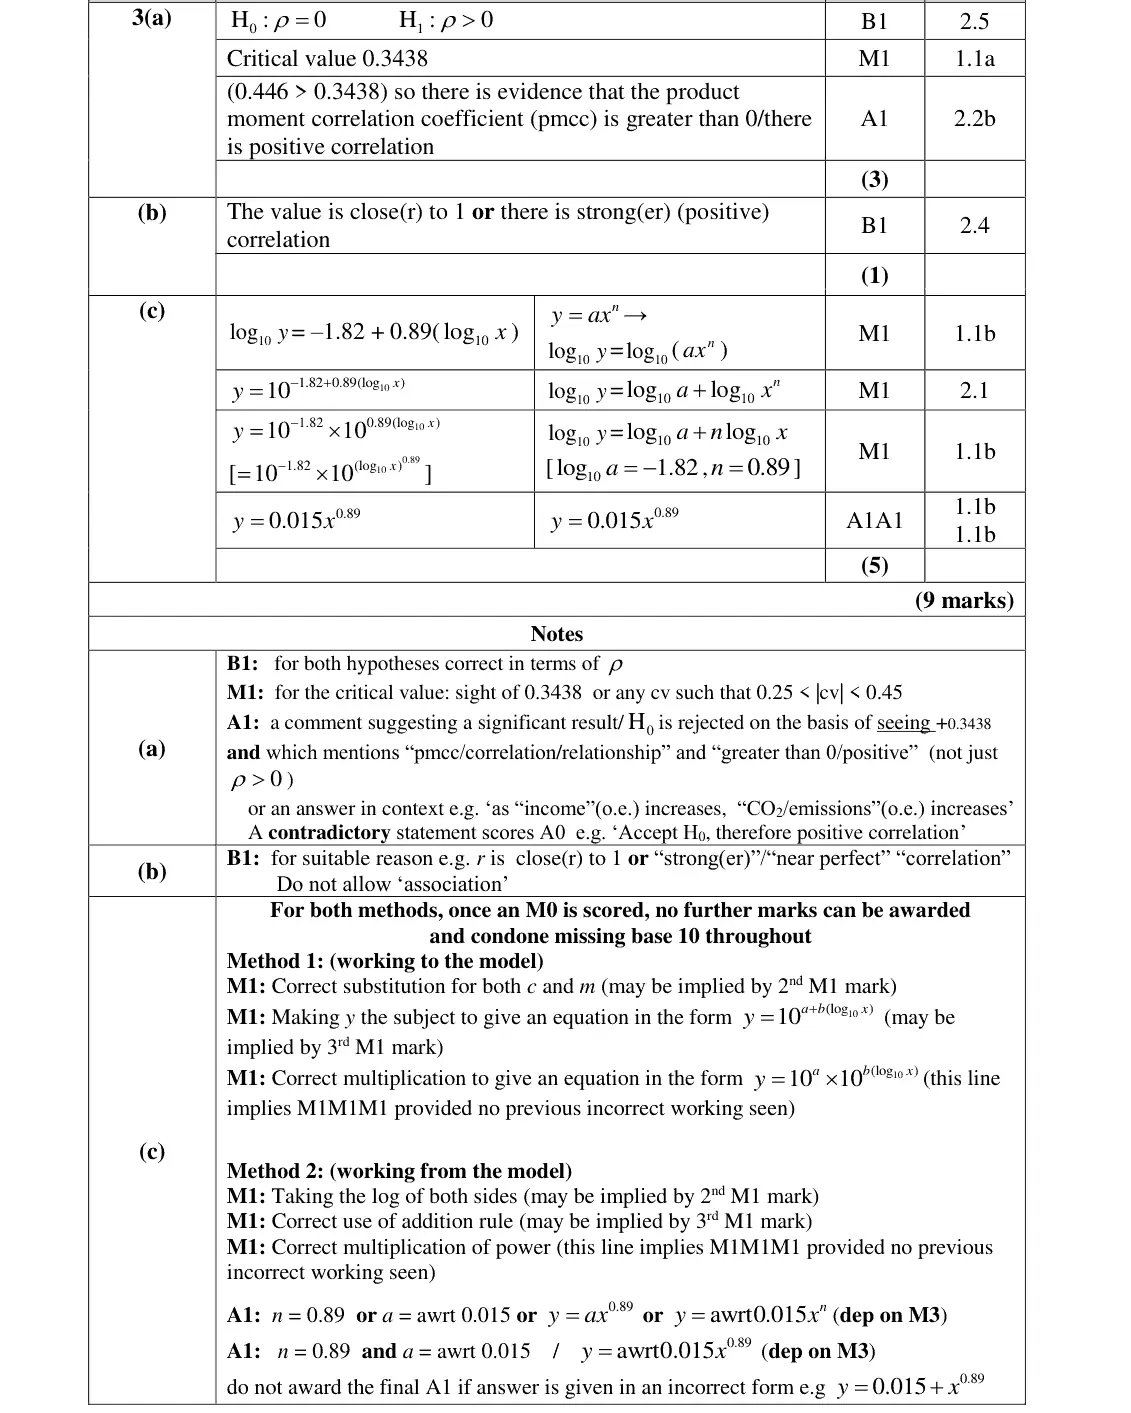
3(a) Hypothesis testing 3 —
3(b) Correlation and regression, Hypothesis testing 1 —
3(c) Correlation and regression, Indices and surds, Exponentials and logarithms 5 —
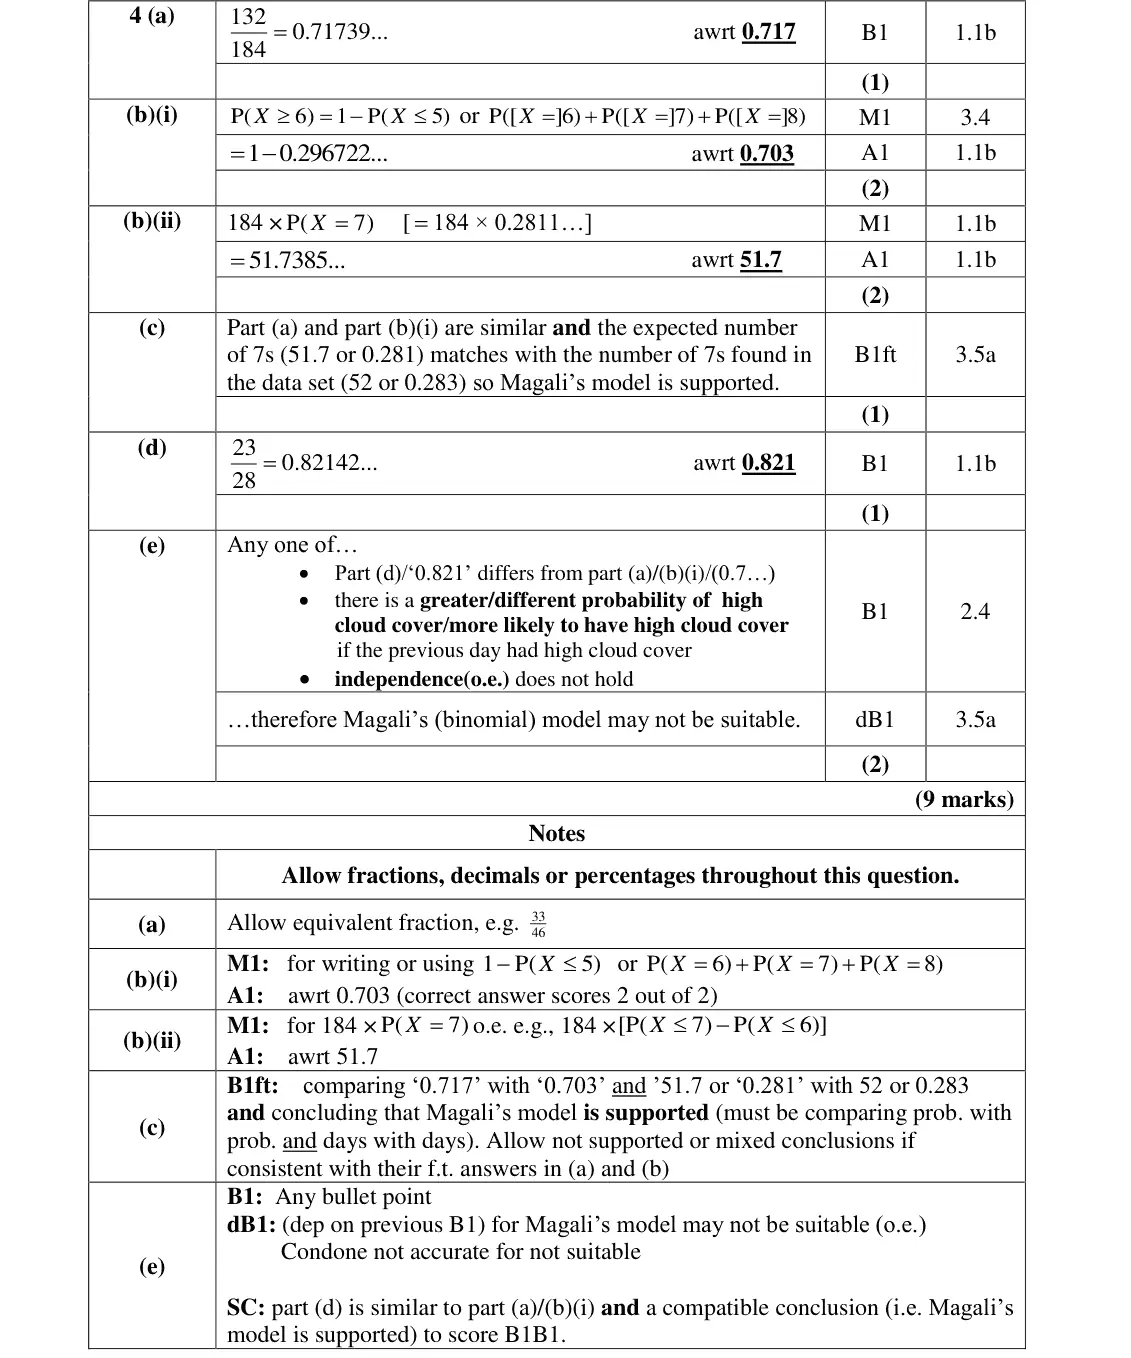
4(a) Probability, including conditional probability 1 —
4(b)(i) Discrete distributions and the binomial distribution 2 —
4(b)(ii) Discrete distributions and the binomial distribution 2 —
4(c) Normal distribution, Discrete distributions and the binomial distribution 1 —
4(d) Probability, including conditional probability 1 —
4(e) Normal distribution, Probability, including conditional probability 2 —
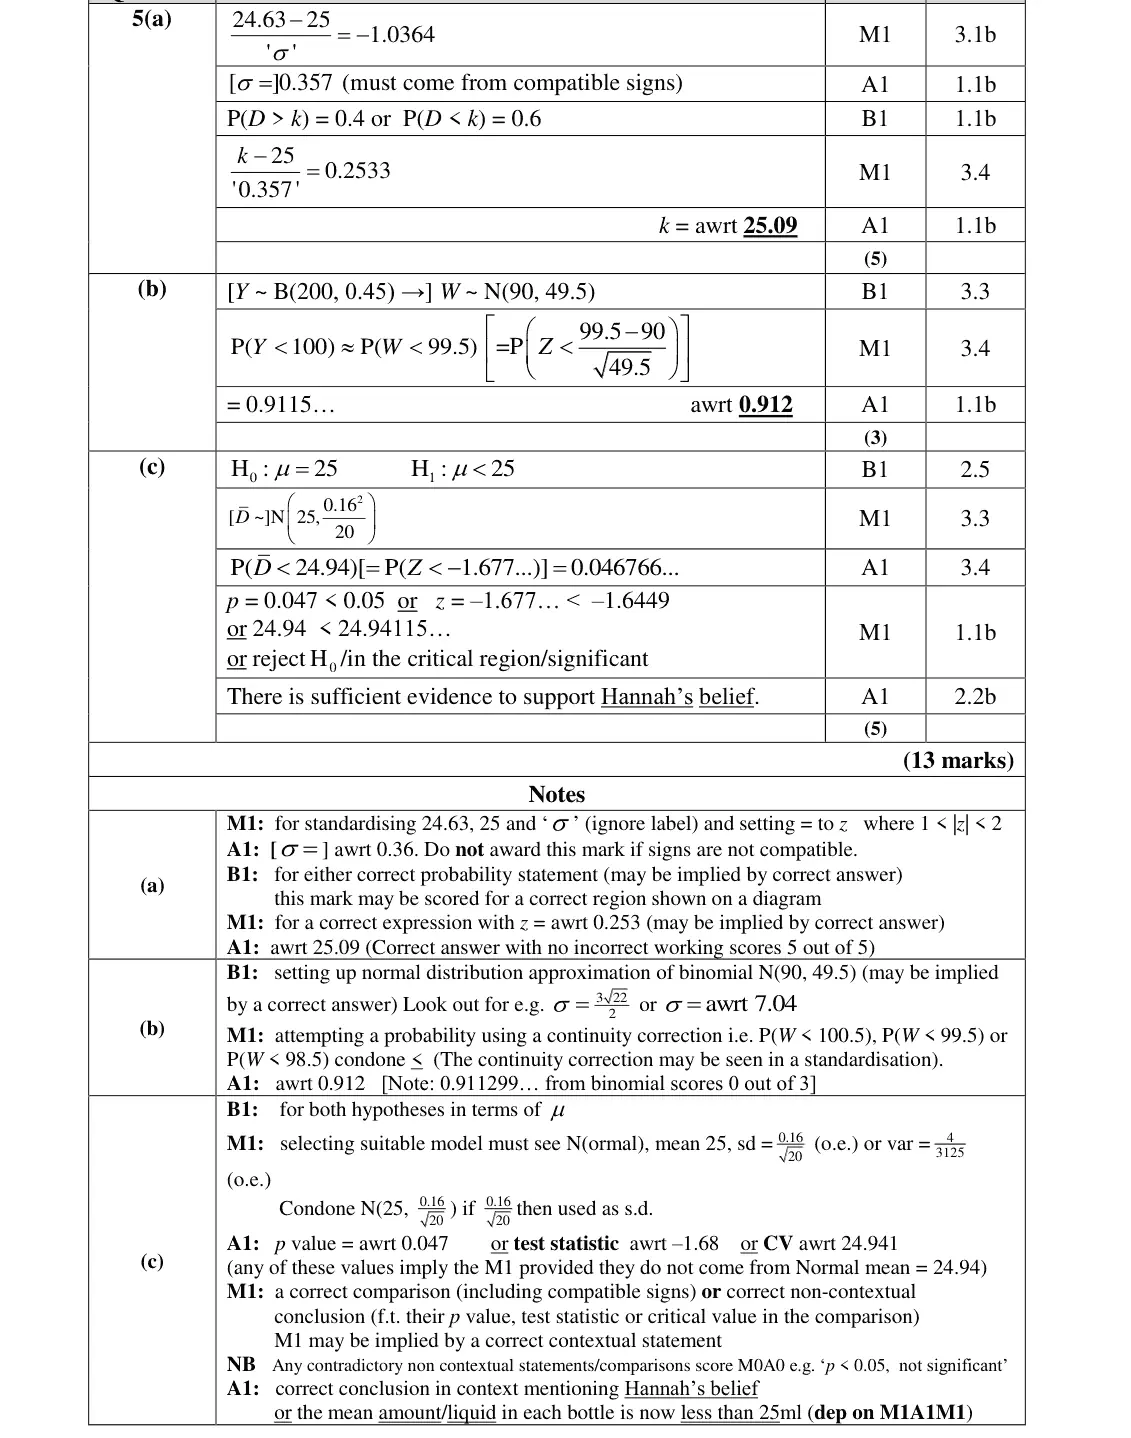
5(a) Normal distribution 5 —
5(b) Normal distribution, Discrete distributions and the binomial distribution 3 —
5(c) Hypothesis testing 5 —

The questions

1(a)1(b)1(c)1(d)2(a)2(b)2(c)2(d)2(e)3(a)3(b)3(c)4(a)4(b)(i)4(b)(ii)4(c)4(d)4(e)5(a)5(b)5(c)
June 2019 · Paper 3 (Statistics) · Q1(a) 2 marks Medium probability
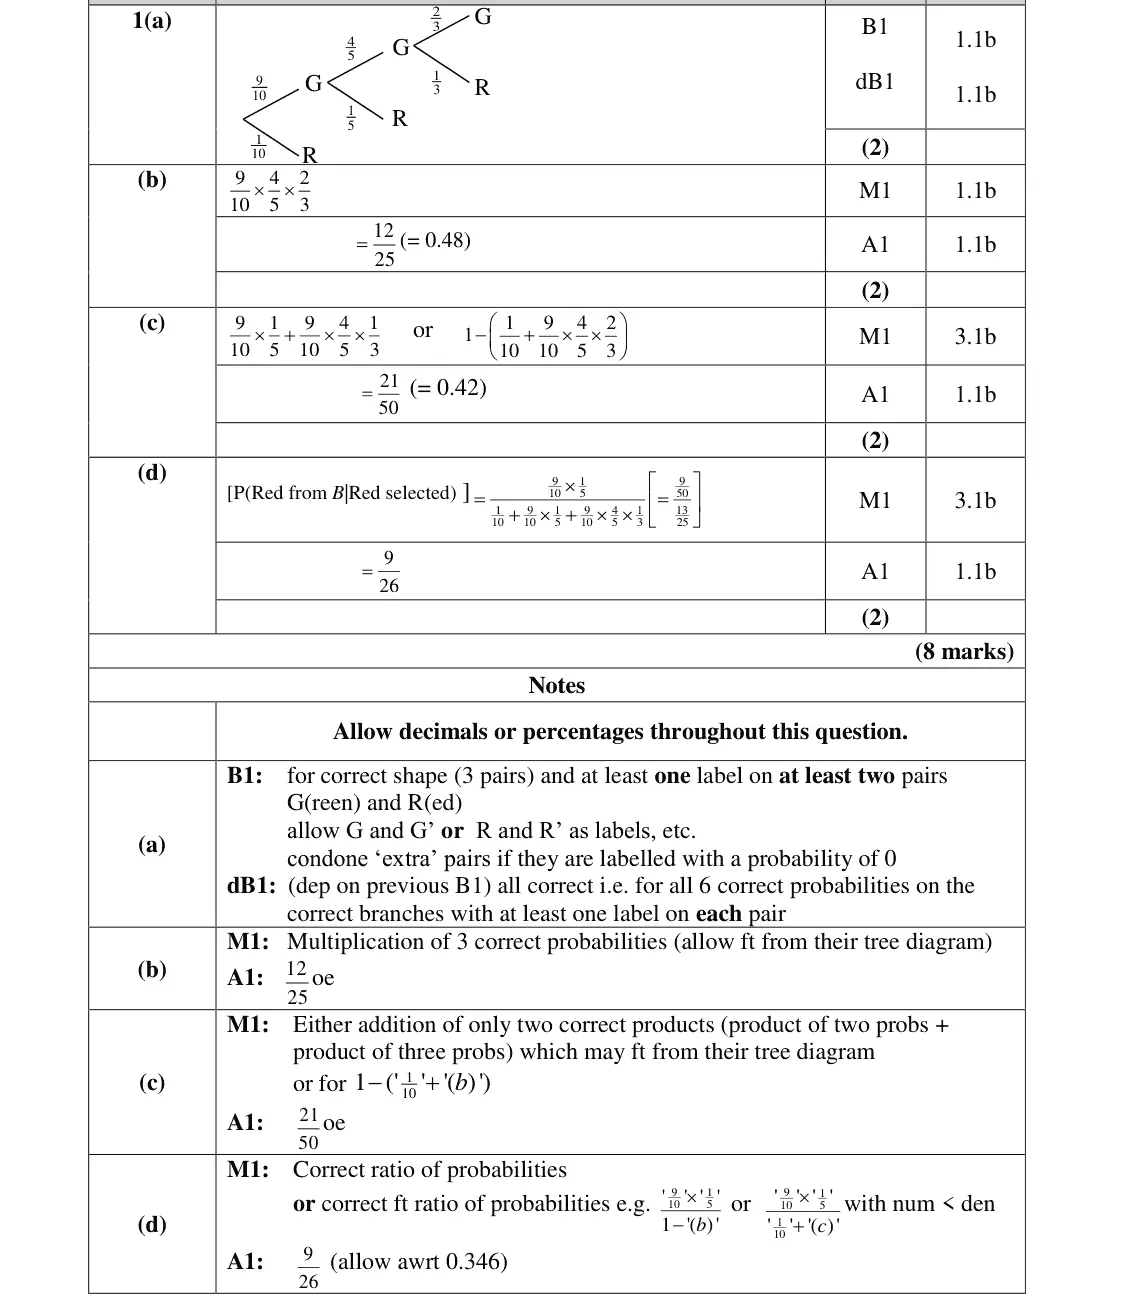
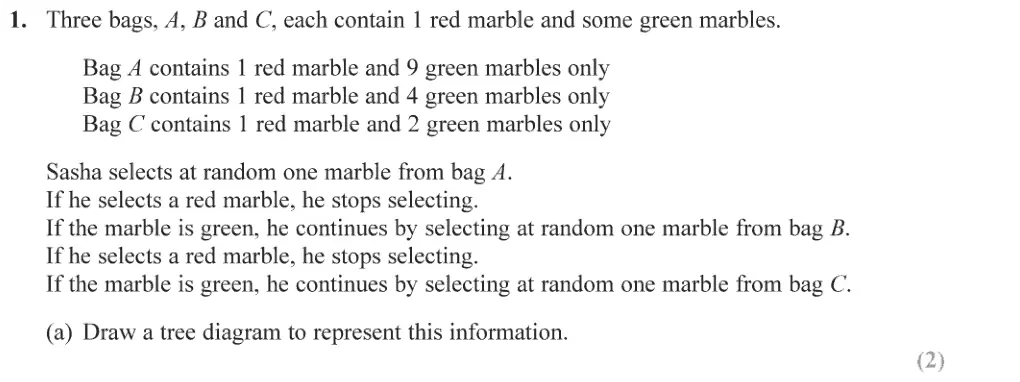
1. Three bags, A, B and C, each contain | red marble and some green marbles. Bag A contains | red marble and 9 green marbles only Bag B contains 1 red marble and 4 green marbles only Bag C contains 1 red marble and 2 green marbles only Sasha selects at random one marble from bag A. If he selects a red marble, he stops selecting. If the marble is green, he continues by selecting at random one marble from bag B. If he selects a red marble, he stops selecting. If the marble is green, he continues by selecting at random one marble from bag C. (a) Drawa tree diagram to represent this information. (2)
June 2019 · Paper 3 (Statistics) · Q1(b) 2 marks Medium probability
(b) Find the probability that Sasha selects 3 green marbles. (2)
June 2019 · Paper 3 (Statistics) · Q1(c) 2 marks Medium probability
(c) Find the probability that Sasha selects at least 1 marble of each colour. (2)
June 2019 · Paper 3 (Statistics) · Q1(d) 2 marks Medium probability
(d) Given that Sasha selects a red marble, find the probability that he selects it from bag B. (2)
June 2019 · Paper 3 (Statistics) · Q2(a) 4 marks data presentation
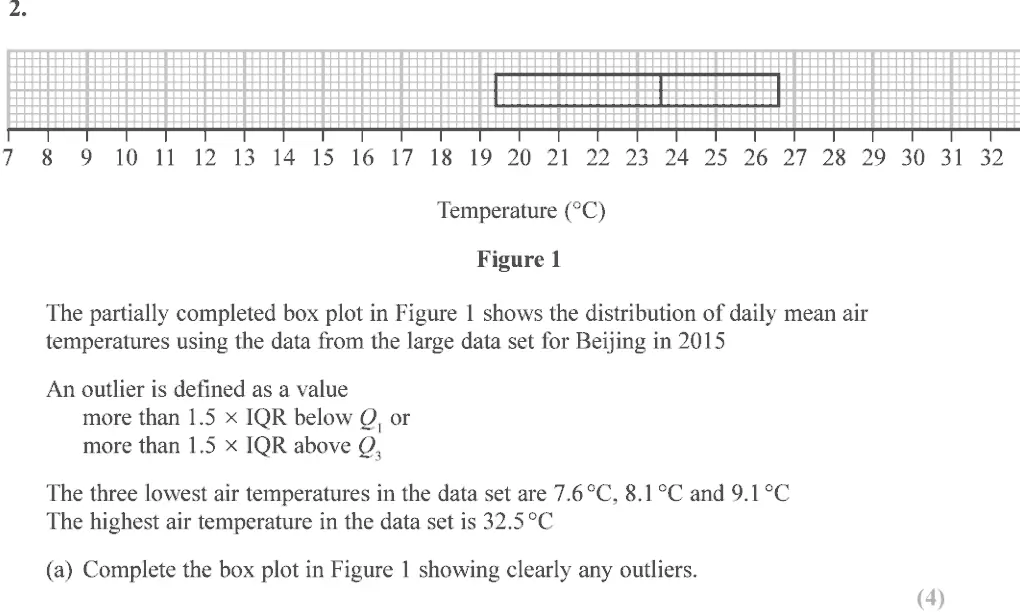
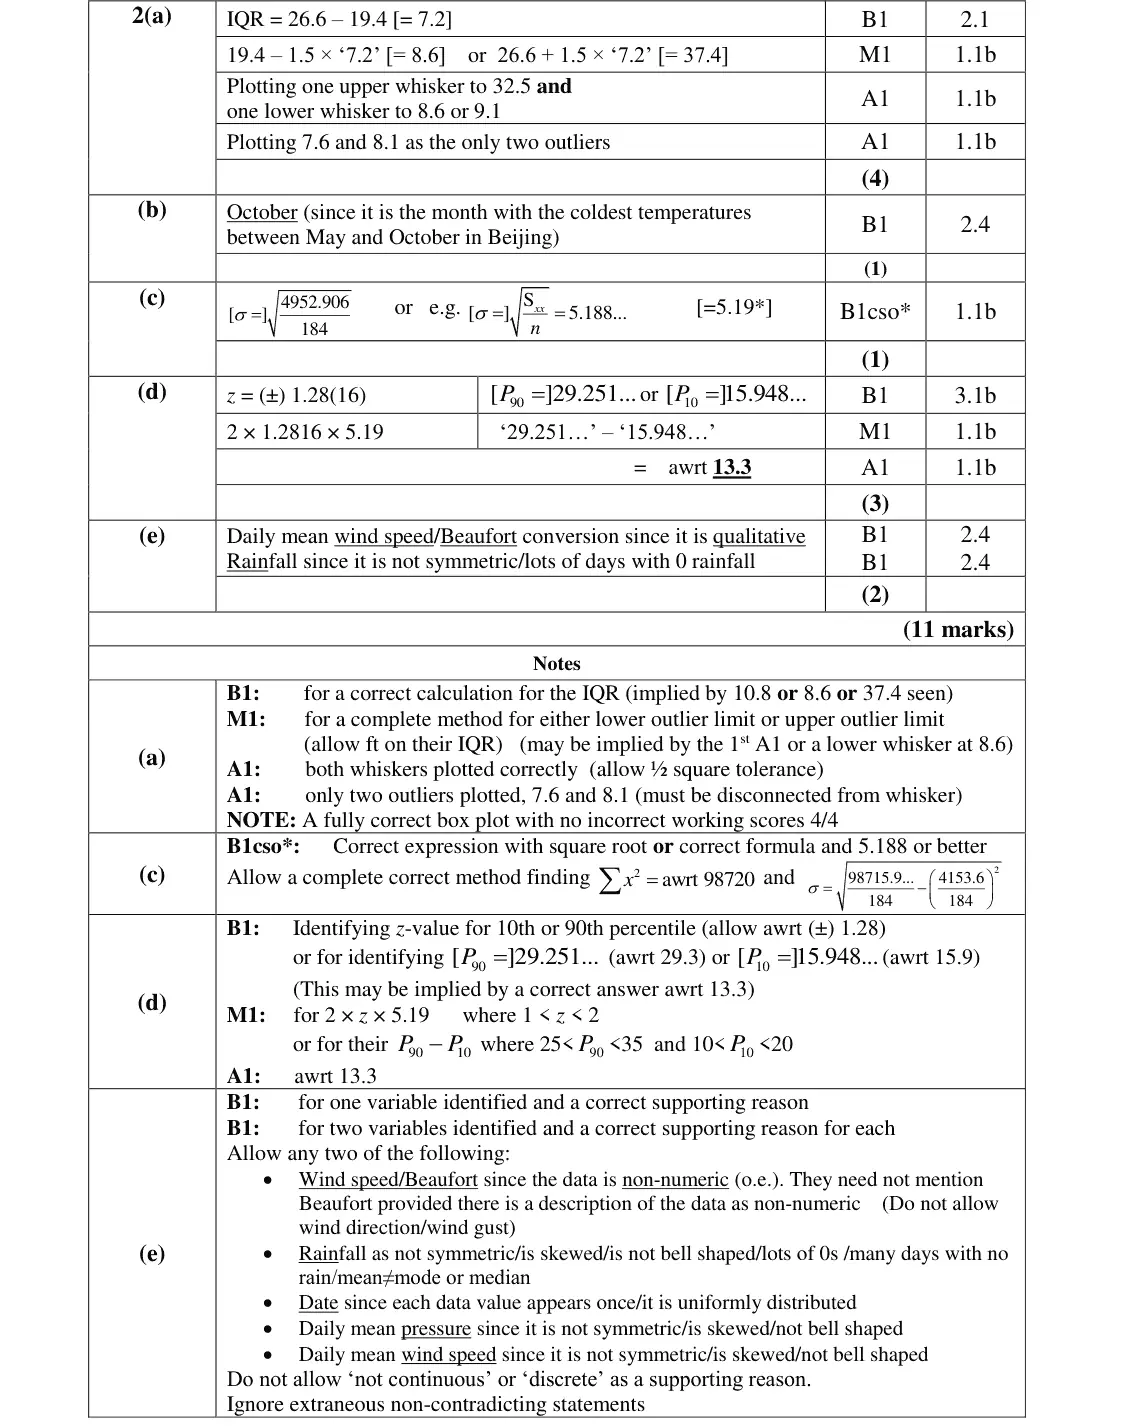
2. FEFEEeee ceedsEeeEEREEEEEC rT T TT %' +. | TT 7. | || | |. . . | || - . TT. Tt TIT TI -T T TT 7 8 9 10 11 12 13 14 15 16 17 18 19 20 21 22 23 24 25 26 27 28 29 30 31 32 3 Temperature (°C) Figure 1 The partially completed box plot in Figure 1 shows the distribution of daily mean air temperatures using the data from the large data set for Beijing in 2015 An outlier is defined as a value more than 1.5 x IQR below Q, or more than 1.5 x IQR above Q, The three lowest air temperatures in the data set are 7.6°C, 8.1°C and 9.1°C The highest air temperature in the data set is 32.5 °C (a) Complete the box plot in Figure 1 showing clearly any outliers.
June 2019 · Paper 3 (Statistics) · Q2(b) 1 mark data presentationlarge data set
(b) Using your knowledge of the large data set, suggest from which month the two outliers are likely to have come.
June 2019 · Paper 3 (Statistics) · Q2(c) 1 mark data presentation
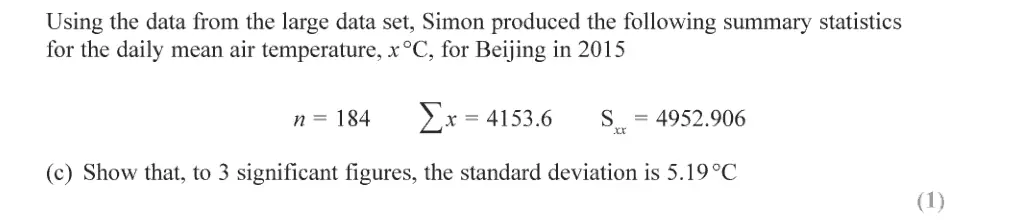
Using the data from the large data set, Simon produced the following summary statistics for the daily mean air temperature, x °C, for Beijing in 2015 n= 184 yix = 4153.6 S_. = 4952.906 (c) Show that, to 3 significant figures, the standard deviation is 5.19°C
June 2019 · Paper 3 (Statistics) · Q2(d) 3 marks normal distributiondata presentation
Simon decides to model the air temperatures with the random variable T ~ N(22.6, 5.197) (d) Using Simon’s model, calculate the 10th to 90th interpercentile range.
June 2019 · Paper 3 (Statistics) · Q2(e) 2 marks normal distributionlarge data set
Simon wants to model another variable from the large data set for Beijing using a normal distribution. (e) State two variables from the large data set for Beijing that are not suitable to be modelled by a normal distribution. Give a reason for each answer.
June 2019 · Paper 3 (Statistics) · Q3(a) 3 marks hypothesis testing
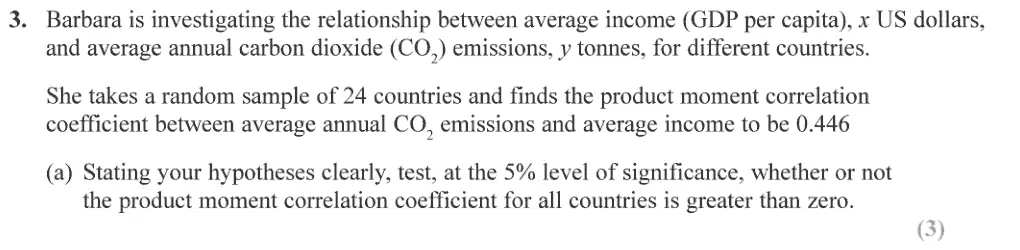
3. Barbara is investigating the relationship between average income (GDP per capita), x US dollars, and average annual carbon dioxide (CO,) emissions, y tonnes, for different countries. She takes a random sample of 24 countries and finds the product moment correlation coefficient between average annual CO, emissions and average income to be 0.446 (a) Stating your hypotheses clearly, test, at the 5% level of significance, whether or not the product moment correlation coefficient for all countries is greater than zero. 3)
June 2019 · Paper 3 (Statistics) · Q3(b) 1 mark correlation and regressionhypothesis testing
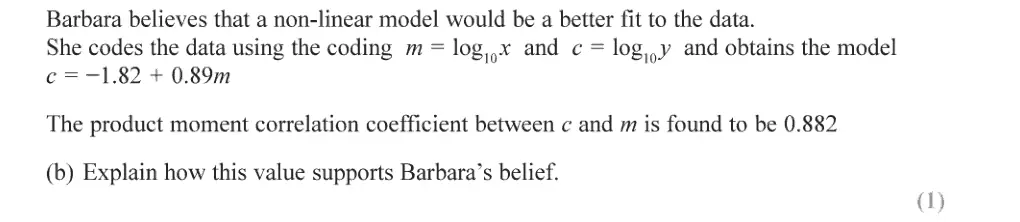
Barbara believes that a non-linear model would bea better fit to the data. She codes the data using the coding m = log,,x and c = log,,y and obtains the model c = -1.82 + 0.89m The product moment correlation coefficient between c and m is found to be 0.882 (b) Explain how this value supports Barbara’s belief. (1)
June 2019 · Paper 3 (Statistics) · Q3(c) 5 marks correlation and regressionindices and surdsexponentials and logs
(c) Show that the relationship between y and x can be written in the form y = ax” where a and v are constants to be found. (5)
June 2019 · Paper 3 (Statistics) · Q4(a) 1 mark probability
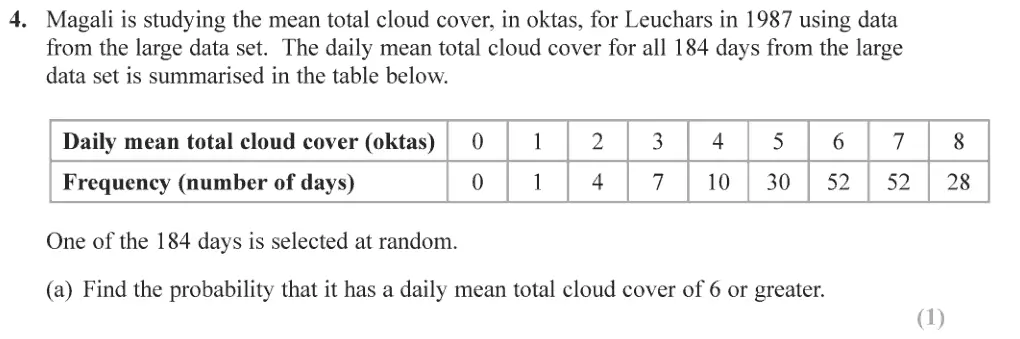
4. Magali is studying the mean total cloud cover, in oktas, for Leuchars in 1987 using data from the large data set. The daily mean total cloud cover for all 184 days from the large data set is summarised in the table below. Daily mean total cloud cover (oktas) | 0 1 2 3 4 5 6 7 8 Frequency (number of days) 0 1 4 7 10 | 30 | 52 | 52 | 28 One of the 184 days is selected at random. (a) Find the probability that it has a daily mean total cloud cover of6 or greater.
June 2019 · Paper 3 (Statistics) · Q4(b)(i) 2 marks binomial distribution
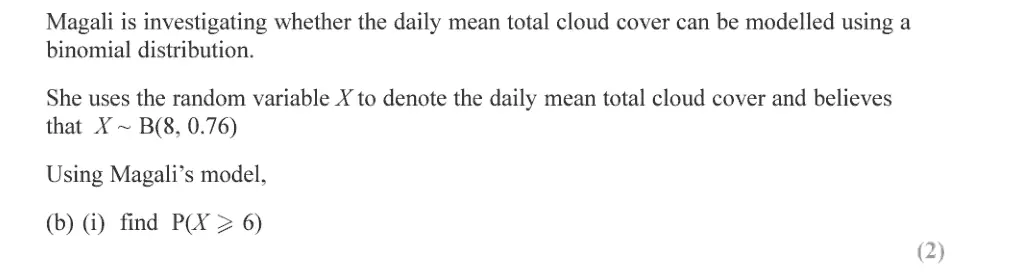
Magali is investigating whether the daily mean total cloud cover can be modelled using a binomial distribution. She uses the random variable X to denote the daily mean total cloud cover and believes that XY ~ B(8, 0.76) Using Magali’s model, (b) (i) find PCY > 6) (ii)
June 2019 · Paper 3 (Statistics) · Q4(b)(ii) 2 marks binomial distribution
(ii) find, to 1 decimal place, the expected number of days in a sample of 184 days with a daily mean total cloud cover of 7
June 2019 · Paper 3 (Statistics) · Q4(c) 1 mark normal distributionbinomial distribution
(c) Explain whether or not your answers to part (b) support the use of Magali’s model.
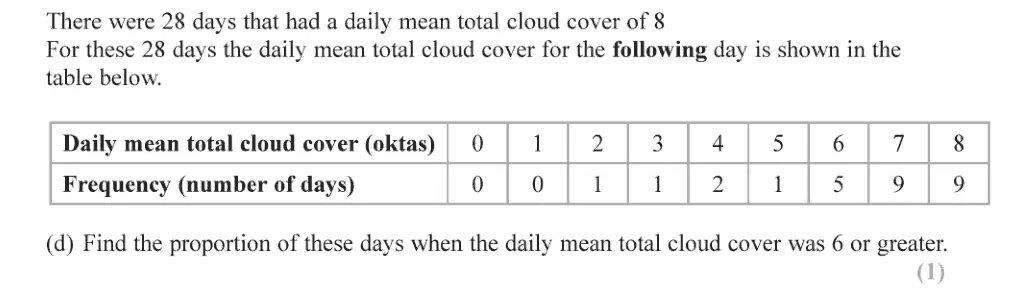
June 2019 · Paper 3 (Statistics) · Q4(d) 1 mark probability
There were 28 days that had a daily mean total cloud cover of 8 For these 28 days the daily mean total cloud cover for the following day is shown in the table below. Daily mean total cloud cover (oktas) | 0 1 2 3 4 5 6 7 8 Frequency (number of days) 0 0 1 1 2 1 5 9 9 (d) Find the proportion of these days when the daily mean total cloud cover was 6 or greater.
June 2019 · Paper 3 (Statistics) · Q4(e) 2 marks normal distributionprobability
(e) Comment on Magali’s model in light of your answer to part (d).
June 2019 · Paper 3 (Statistics) · Q5(a) 5 marks normal distribution
5. A machine puts liquid into bottles of perfume. The amount of liquid put into each bottle, Dm, follows a normal distribution with mean 25 ml Given that 15% of bottles contain less than 24.63 ml (a) find, to 2 decimal places, the value of & such that P(24.63 < D < k) = 0.45 (5) A
June 2019 · Paper 3 (Statistics) · Q5(b) 3 marks normal distributionbinomial distribution
A random sample of 200 bottles is taken. (b) Using a normal approximation, find the probability that fewer than half of these bottles contain between 24.63 ml and kml (3)
June 2019 · Paper 3 (Statistics) · Q5(c) 5 marks hypothesis testing
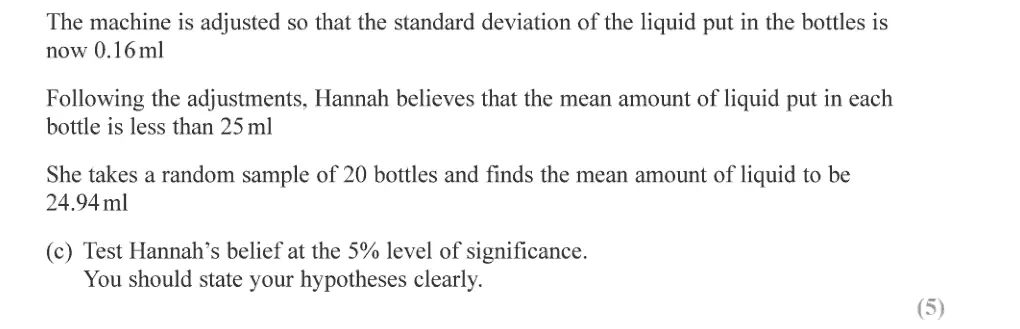
The machine is adjusted so that the standard deviation of the liquid put in the bottles is now 0.16ml Following the adjustments, Hannah believes that the mean amount of liquid put in each bottle is less than 25 ml She takes a random sample of 20 bottles and finds the mean amount of liquid to be 24.94 ml (c) Test Hannah’s belief at the 5% level of significance. You should state your hypotheses clearly. (5)

Find an Edexcel maths tutor

Want this paper marked and gone through with you? Message us.

Prefer email? Send an enquiry

If you are under 18, please include a parent's contact details. Enquiries go to enquiries@mathsaleveltutor.com and are deleted once handled.