Use logarithmic graphs to estimate parameters in relationships of the form y = axⁿ and y = kbˣ, given data for x and y.
Guidance
Plot log y against log x and obtain a straight line where the intercept is log a and the gradient is n. Plot log y against x and obtain a straight line where the intercept is log k and the gradient is log b.
Mark scheme (whole question; this part is marked with the orange bar)
Examiner's comment
This question tested the understanding of logarithmic graphs and exponential growth. This was successful in differentiating between candidates, although surprisingly
Common mistakes
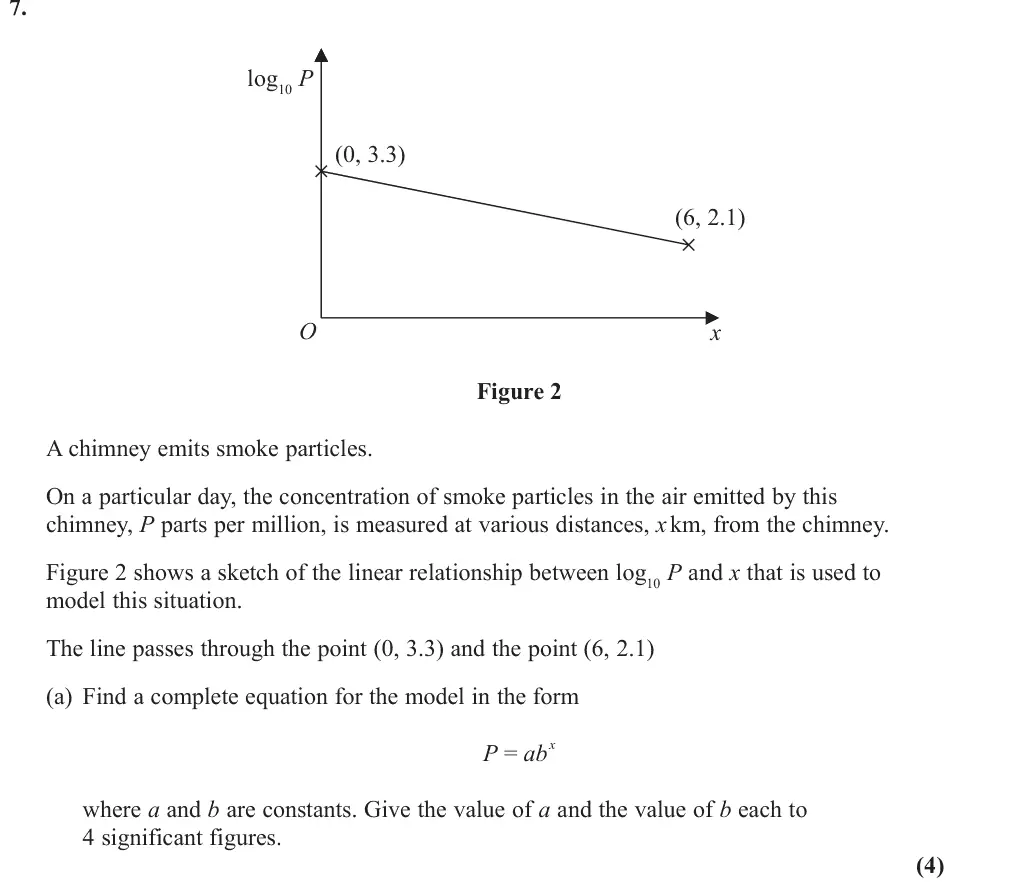
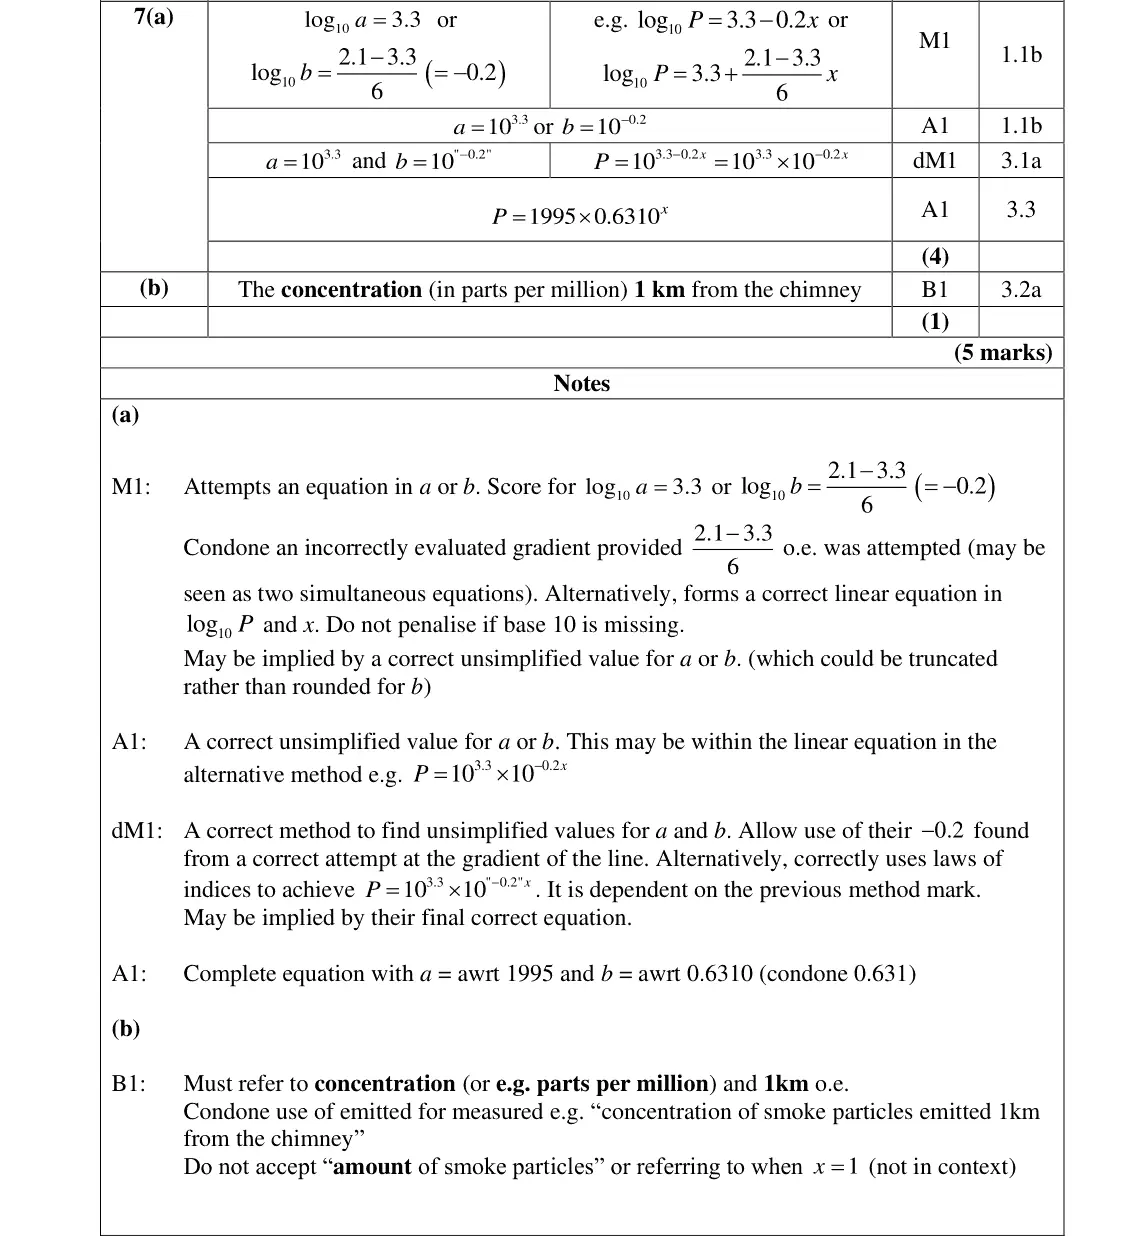
log₁₀P = 3.3 − 0.2x so a = 10^3.3 ≈ 1995 and b = 10^(−0.2) ≈ 0.6310 (4 s.f.)
gradient slips
using 3.3 instead of 10^3.3 for a
writing y for log₁₀P
June 2024 · AS Paper 1 · Q7(b)1 mark
Mark scheme (whole question; this part is marked with the orange bar)
Examiner's comment
This question tested the understanding of logarithmic graphs and exponential growth. This was successful in differentiating between candidates, although surprisingly candidates still struggle with this relationship. In addition, part (b) provided challenging for most who were unable to interpret in context. = x P ab Many candidates lacked confidence in relating the exponential form of the model to the log P against x. Whilst some very poor log work was seen, some straight-line graph of 10 candidates also made fundamental errors whilst forming the equation of a straight line, for - 6 0 = - 5 example, an incorrect method for calculating the gradient, e.g. - 2.1 3.3 log P when writing down the equation of the straight line. Many candidates used y instead of 10 log 3.3 within their Some candidates appeared confused as to whether they should use 3.3 or 10 equation, whilst others also showed a lack of robust understanding in manipulating indices after achieving a correct equation for P. A significant minority of candidates who achieved the correct values for both a and b failed to then write down the complete equation required. In part (b), the vast majority of candidates were unable to correctly explain the meaning of “ab”. ab = = 1005 0.6310 1259 Some thought that they simply had to calculate its value i.e . Many others assumed they needed to give the meanings of each of a and b separately, as on previous papers.
Common mistakes
ab is the concentration (parts per million) 1 km from the chimney
"amount of smoke" or "when x = 1" is not in context
June 2024 · Paper 2 · Q13(a)4 marks
Mark scheme (whole question; this part is marked with the orange bar)
Examiner's comment
Part (a) was generally well answered with candidates commonly using the main method in the mark scheme, having made the link with y = mx + c and taking logarithms. Most candidates recognised log a = 0.81 and log b = 0.0054 with minimal preamble. When this was recognised it almost always led to correct answers. There were occasional errors with logs such as using base e instead of base 10. The misread of the 0.0054 as 0.054 was seen quite often. A common issue was candidates not reading the 3 decimal place requirement and instead writing things such as b = 1.0125 (awrt was applied so no marks were lost) or giving 3 significant figures. The method where values for t were used to obtain the values for a and b was sometimes used, but often candidates made limited progress towards obtaining an accurate answer.
Common mistakes
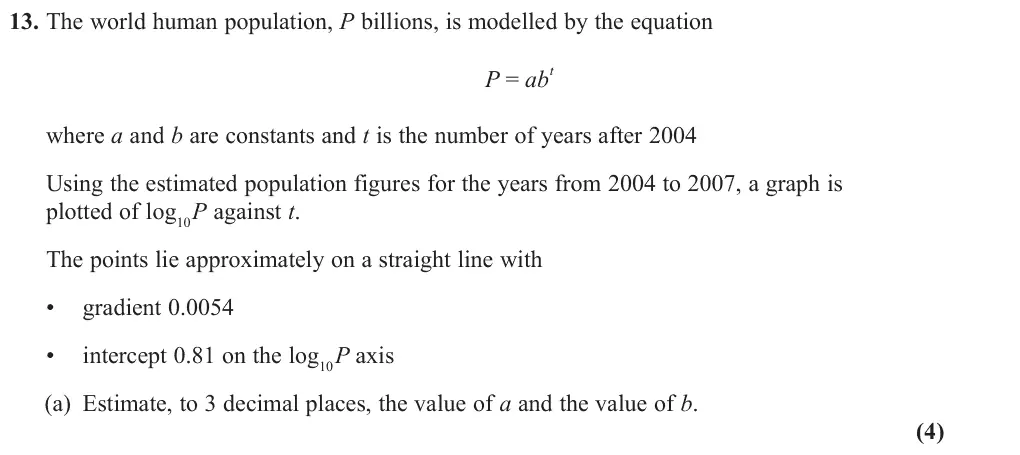
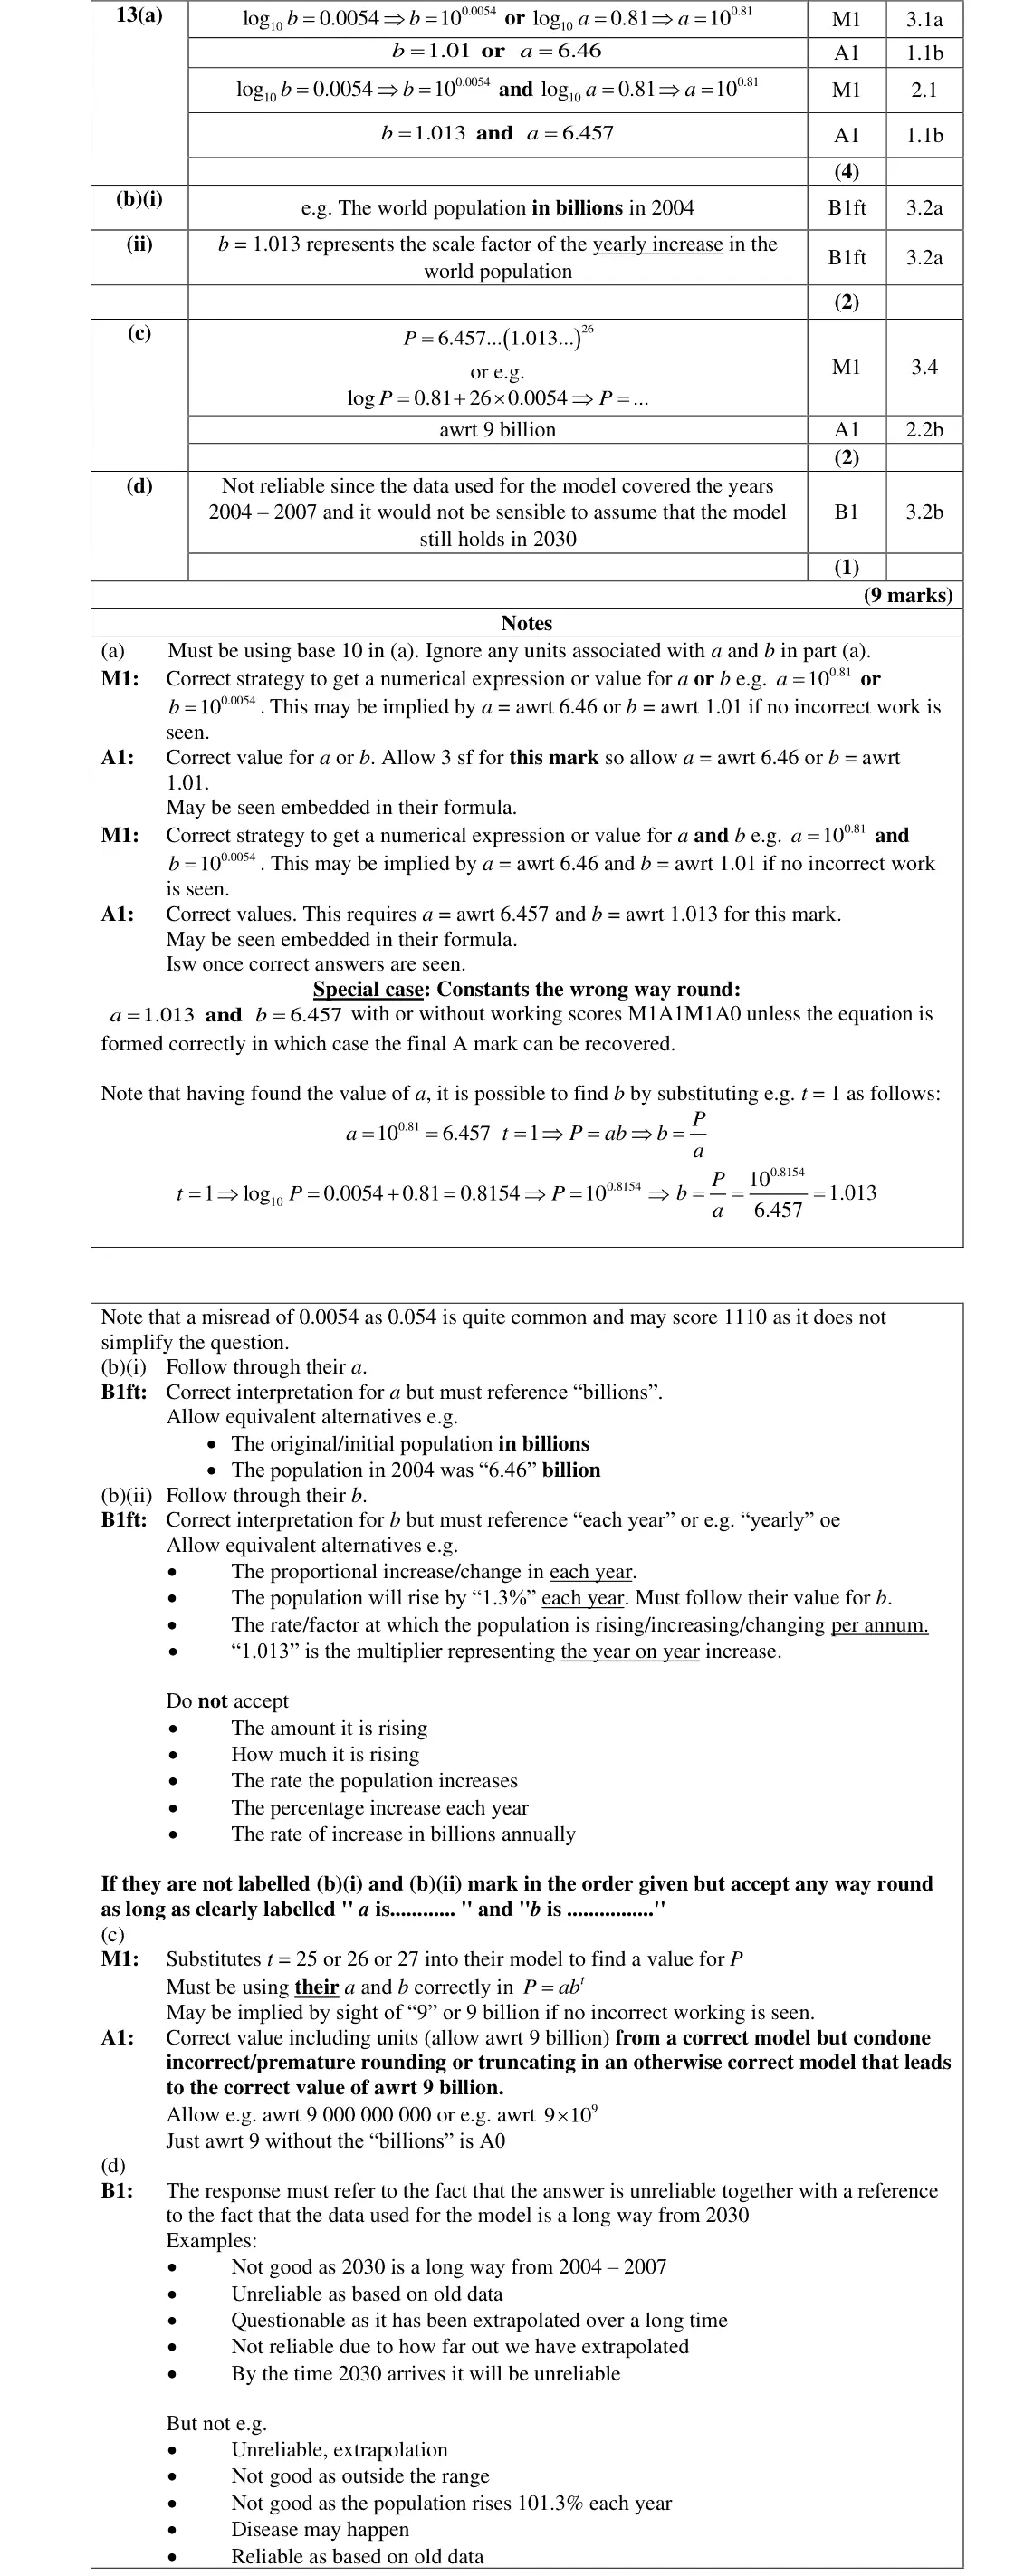
log P = log a + t log b so log₁₀a = 0.81, log₁₀b = 0.0054
a = 6.457, b = 1.013 (3 d.p., base 10 not e)
misreading 0.0054 as 0.054
June 2024 · Paper 2 · Q13(b)2 marks
Mark scheme (whole question; this part is marked with the orange bar)
Examiner's comment
For part (b)(i), most candidates understood that this was the initial population but the word billion was often omitted, showing a lack of full comprehension of the model. Part (b)(ii) was less well answered than (b)(i). The proportionality or rate was often recognised but “per year” was sometimes omitted. The wording of answers also cost candidates the mark as they often talked about the “amount” or “how much” the population went up by, or they wrote correct responses followed by it increases by “1.013 billion”.
Common mistakes
(i) a = world population in billions in 2004 ("billions" needed)
(ii) b = yearly scale factor (1.3% increase per year)
"how much it rises" or "1.013 billion" not accepted
June 2023 · Paper 1 · Q11(a)2 marks
Mark scheme (whole question; this part is marked with the orange bar)
Examiner's comment
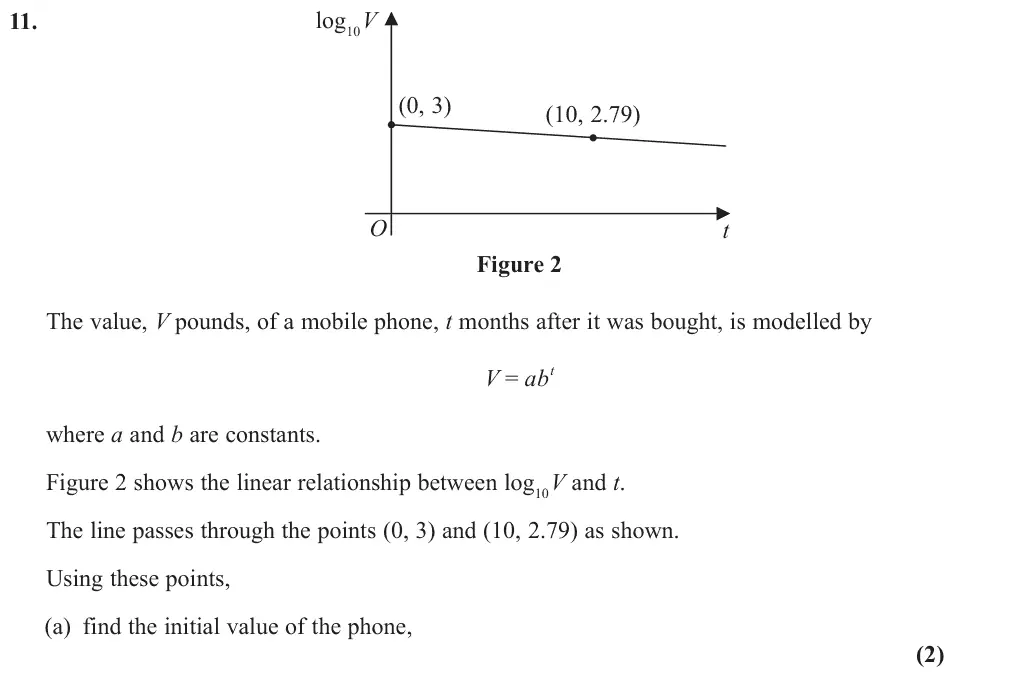
This question proved to be quite challenging for a number of candidates, however those who were able to manipulate logarithms using the rules correctly, along with calculating the gradient, were often very successful. It is worth noting that there were a number of candidates who did not pay attention to the labelling on the y-axis and therefore were unable to score any marks on this question. As with many modelling questions, candidates currently lack proficiency at relating the mathematics to the context of the question. In part (a), most candidates were able to find the initial value correctly, although several lost the accuracy mark by forgetting to include units. The location of the unit was condoned e.g. 1000£ was seen on many occasions. A common reason for candidates not achieving any marks was to assume 3 V = or 10 log 3 V = , instead of 10 log 3 V = . A few candidates used natural logs instead of 10 log , resulting in 3e V = instead of 3 10 V = . Some candidates just stated the initial value was 3, not fully appreciating what information the linear graph was representing.
Common mistakes
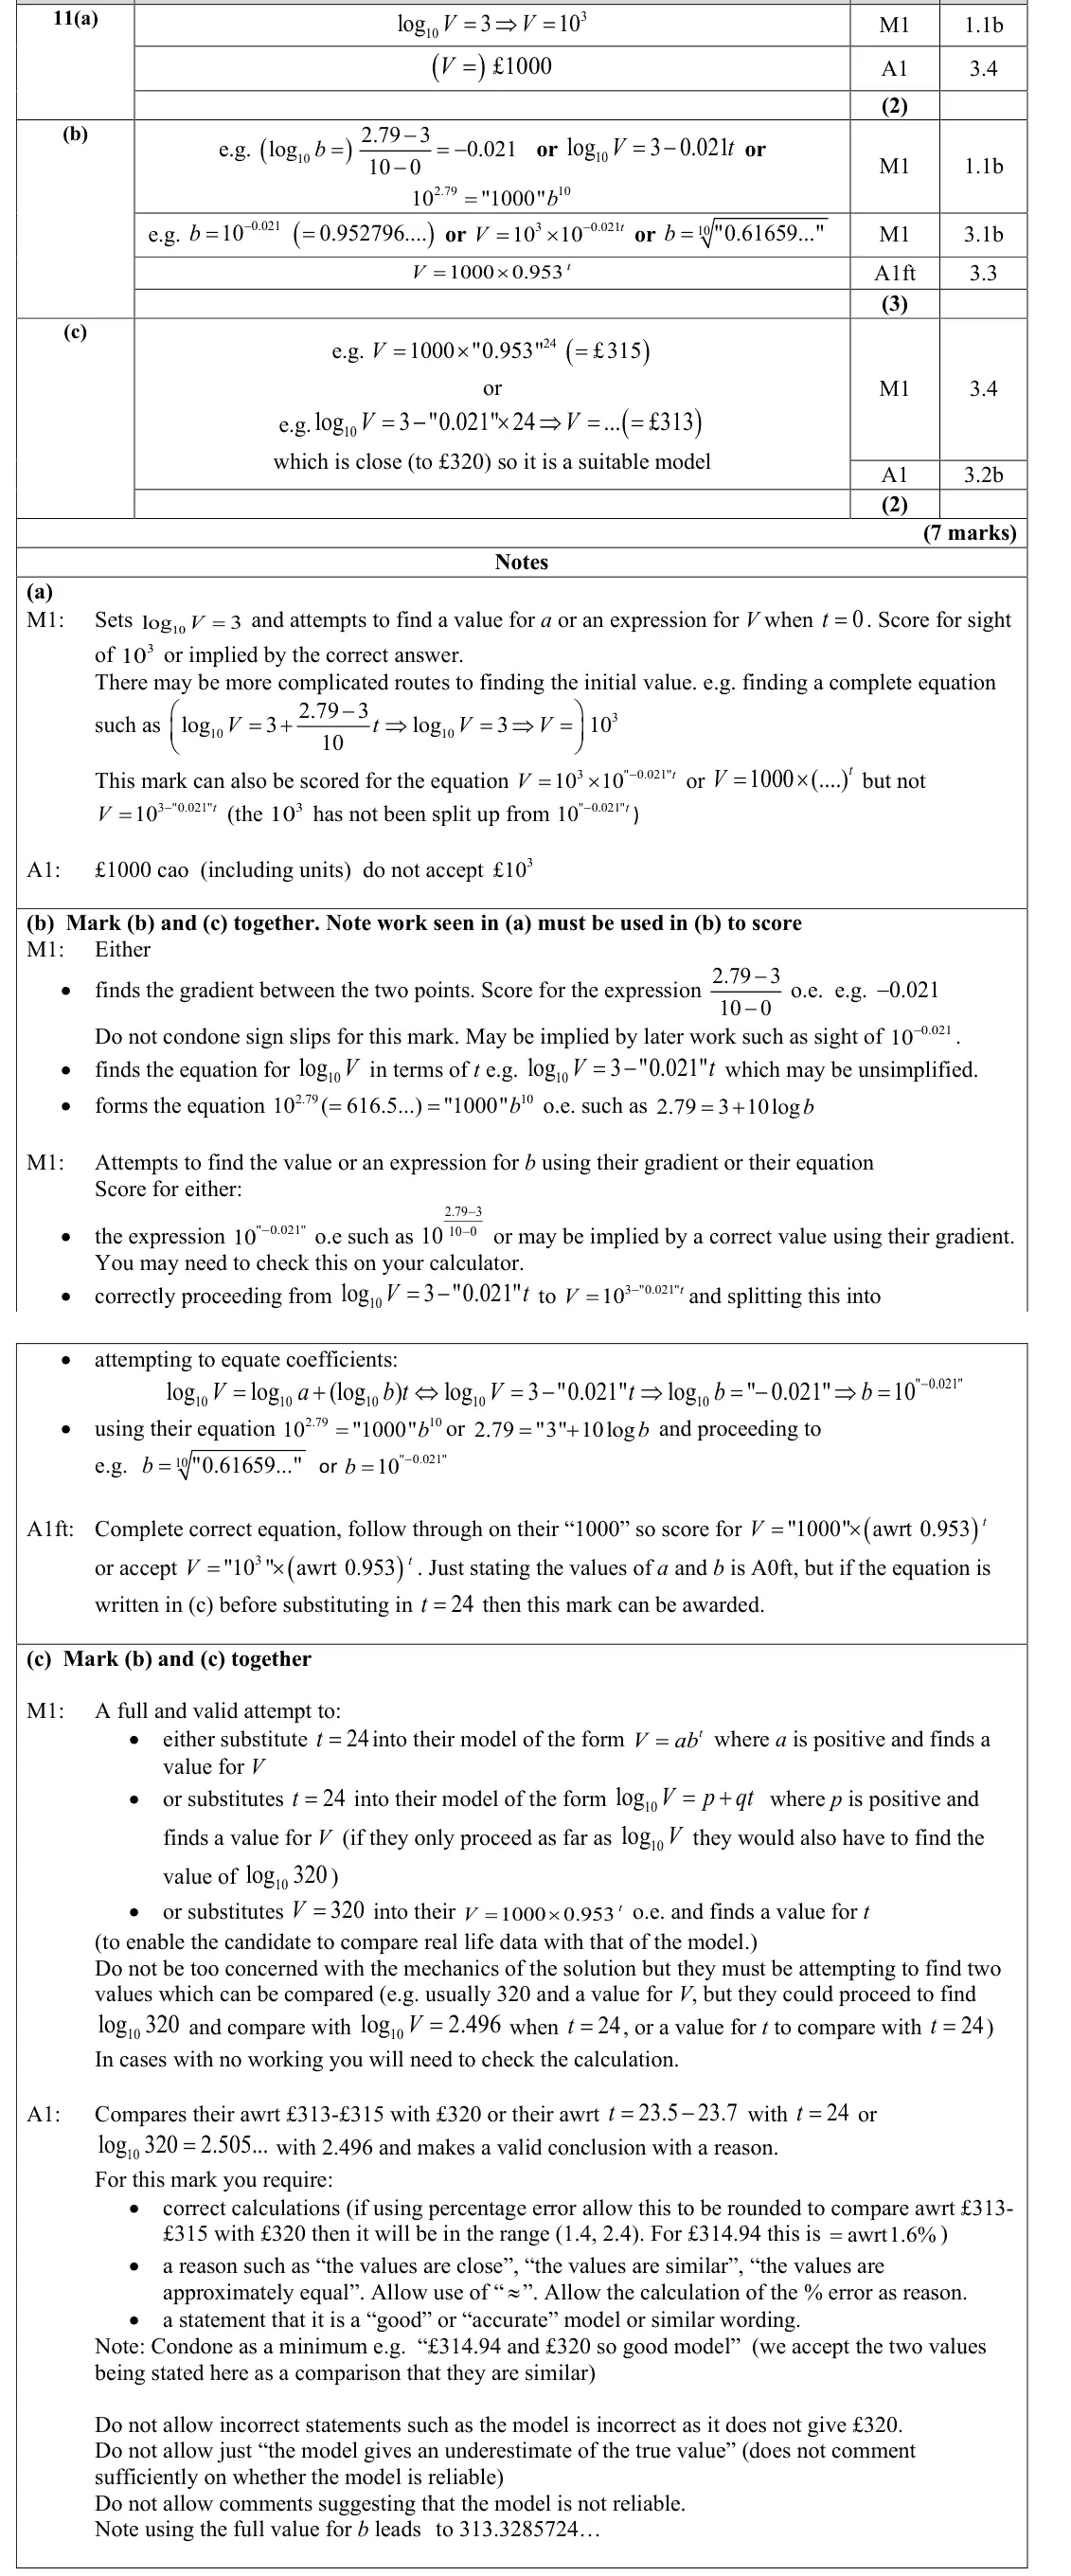
log₁₀V = 3 when t = 0, so V = 10³ = £1000 (units needed)
June 2023 · Paper 1 · Q11(b)3 marks
Mark scheme (whole question; this part is marked with the orange bar)
Examiner's comment
This question proved to be quite challenging for a number of candidates, however those who were able to manipulate logarithms using the rules correctly, along with calculating the gradient, were often very successful. It is worth noting that there were a number of candidates who did not pay attention to the labelling on the y-axis and therefore were unable to score any marks on this question. As with many modelling questions, candidates currently lack proficiency at relating the mathematics to the context of the question. Part (b) was discriminating, requiring some understanding of the relationship between t V ab = and the linear graph. Those candidates who were most successful with this part of the question, made the link between part (a) and the value of a without having to do additional calculations. Many candidates were able to find the gradient of the graph correctly and pick up the first method mark. However, finding a value for b was difficult for many candidates. Those candidates who did not make the link with part (a) often had to recalculate a or attempted to use simultaneous equations, often with little success. There were a lot of very convoluted incorrect solutions in this question which showed a poor grasp of logarithms and the associated rules; log t ab was commonly seen; others failed to correctly relate log log log V a t b = + to y mx c = + despite previous questions on the topic, confusing which were the variables and which were the constants. There were several cases of candidates mixing up the x, y coordinates in their substitution. It was encouraging to see that most candidates tried to give the full equation if they found values for a and b, but there was still a good number that did not and thus, lost the final mark. A few candidates were unable to score the final mark for leaving their answer as 10 log 3 0.021 V t = - . Candidates were able to gain the final mark of part (b), if the complete equation was seen in part (c), although this was rare to see.
Common mistakes
gradient −0.021 = log₁₀b, so b = 10^−0.021 ≈ 0.953
give the complete equation V = 1000 × 0.953ᵗ
June 2022 · AS Paper 1 · Q5(a)4 marks
Mark scheme (whole question; this part is marked with the orange bar)
Examiner's comment
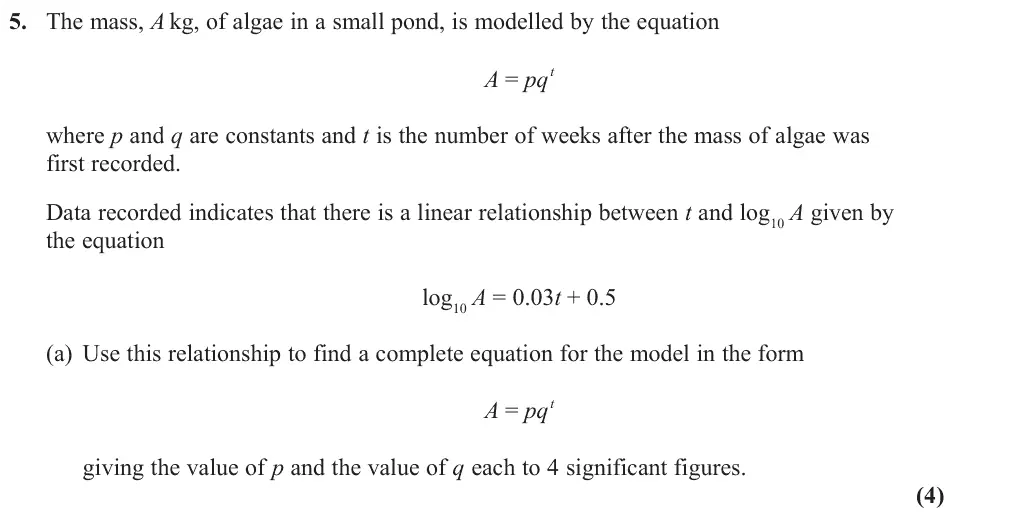
Generally, candidates found this question accessible with many scoring consistently throughout. In part (a), most candidates were able to make progress often correctly establishing the values of p and q following a valid method. A significant proportion of candidates, who correctly calculated the values of both p and q, failed to write down “a complete equation for the model” in the required form, and a small minority candidates failed to evaluate p and q to four decimal places. The need to carefully read the question’s requirements should be emphasised to candidates and whilst in a number of questions we will allow anything which rounds to that level of accuracy, the modelling questions in particular can sometimes require a specific level of rounding to score full marks.
Common mistakes
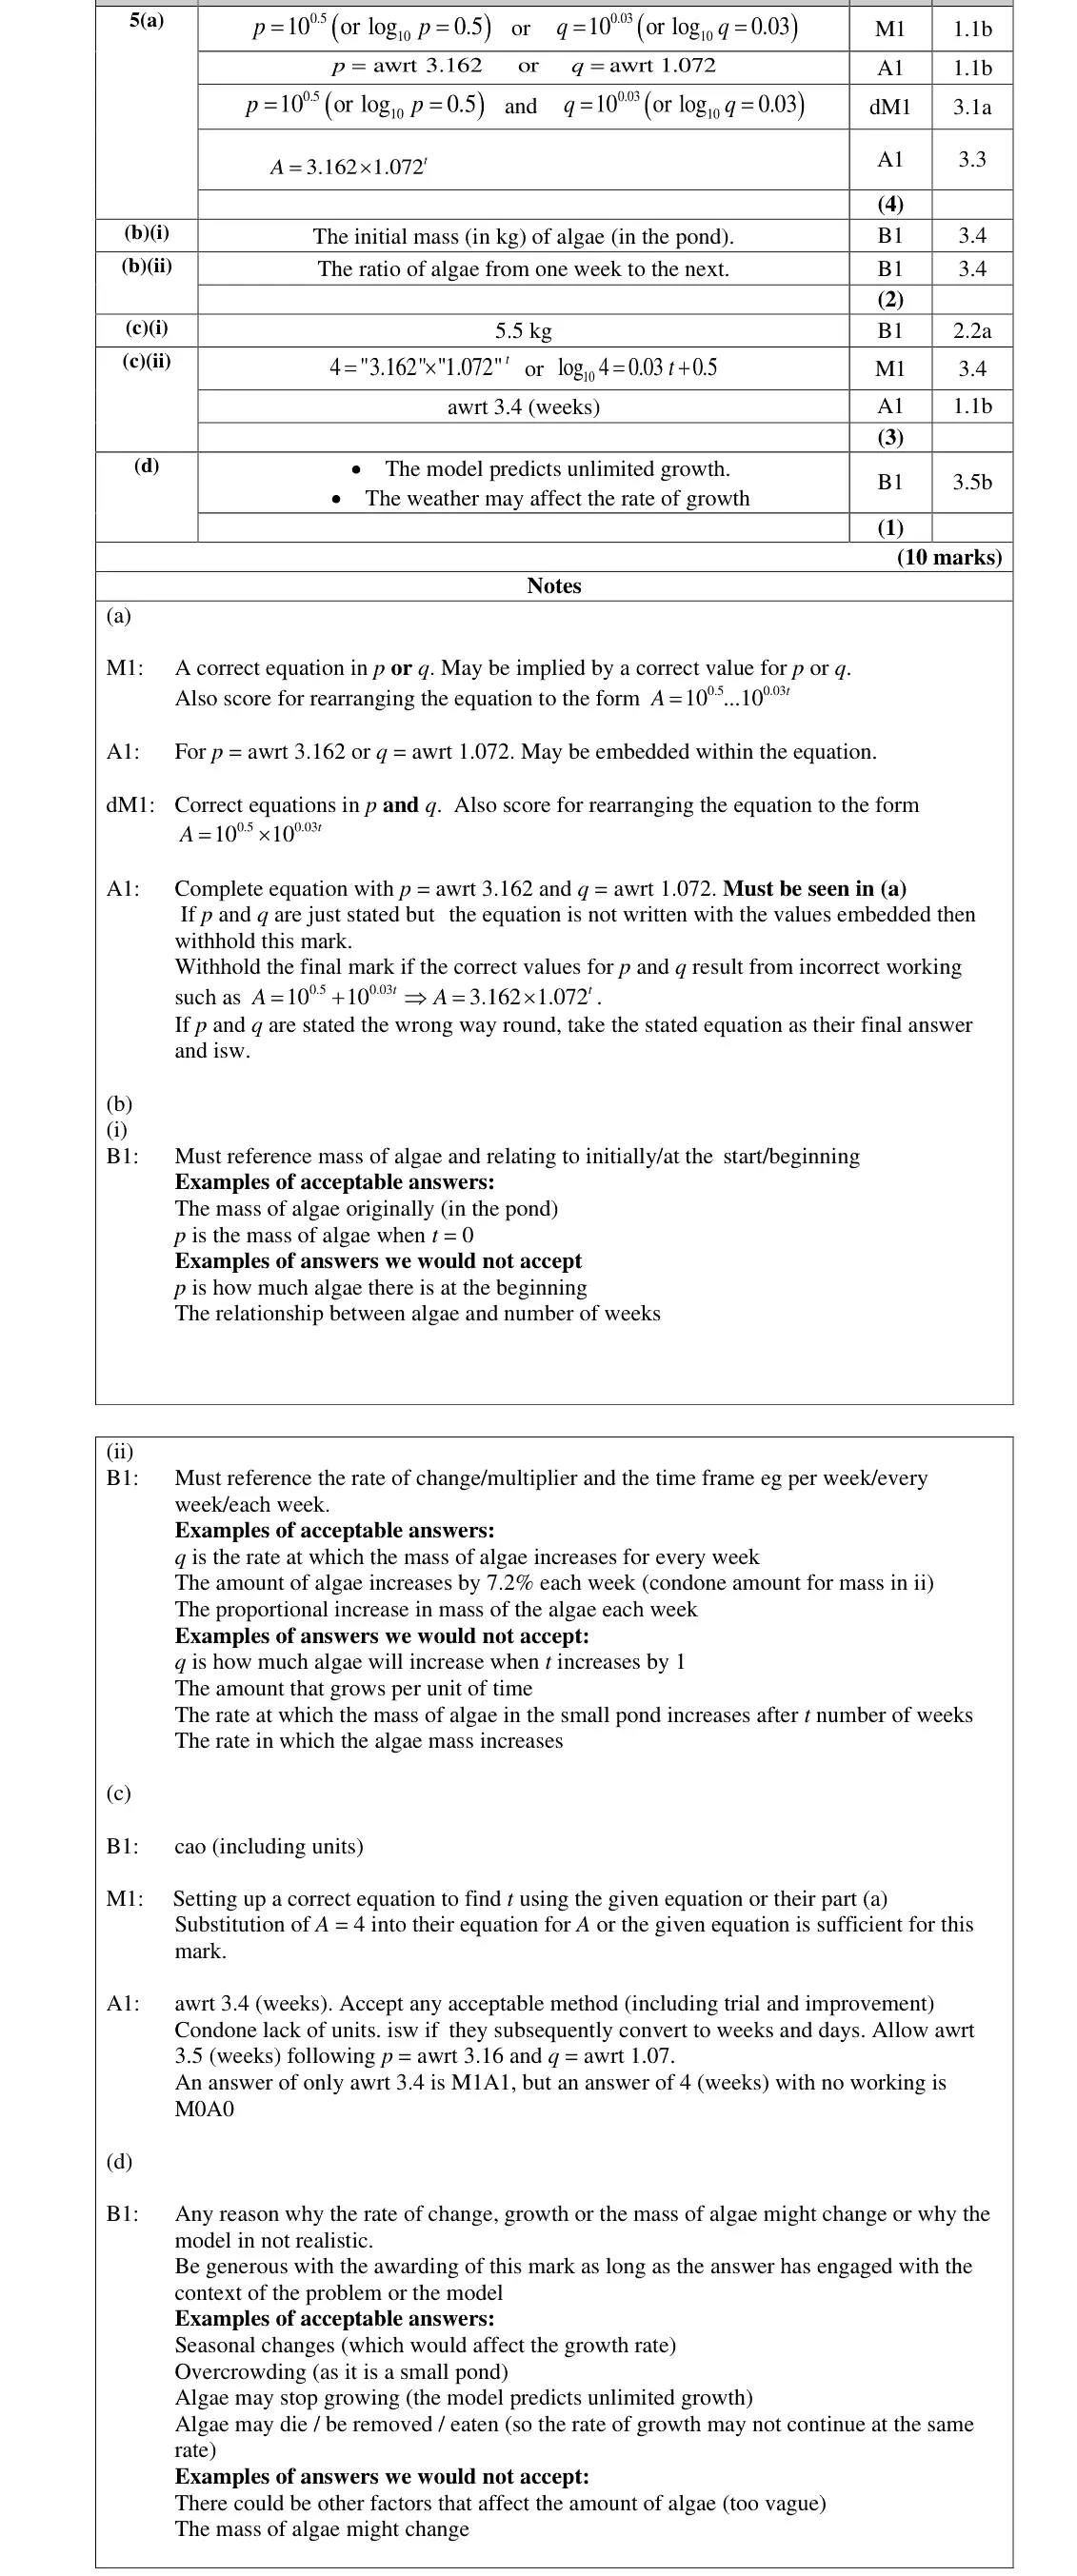
log₁₀p = 0.5 and log₁₀q = 0.03 so p = 3.162, q = 1.072 (4 s.f.)
must write the complete equation A = 3.162 × 1.072^t
A = 10^0.5 + 10^0.03t is wrong
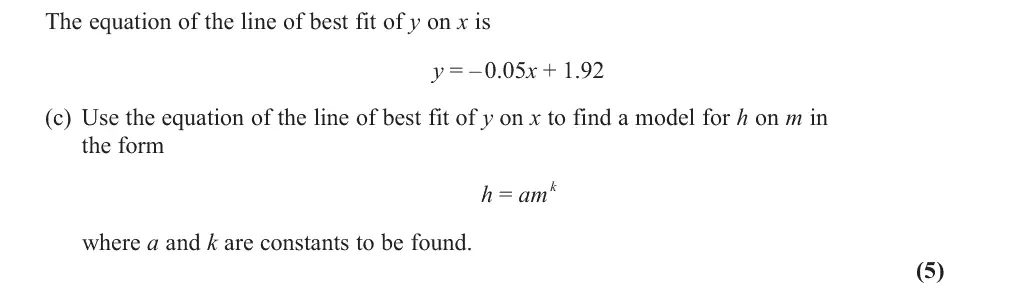
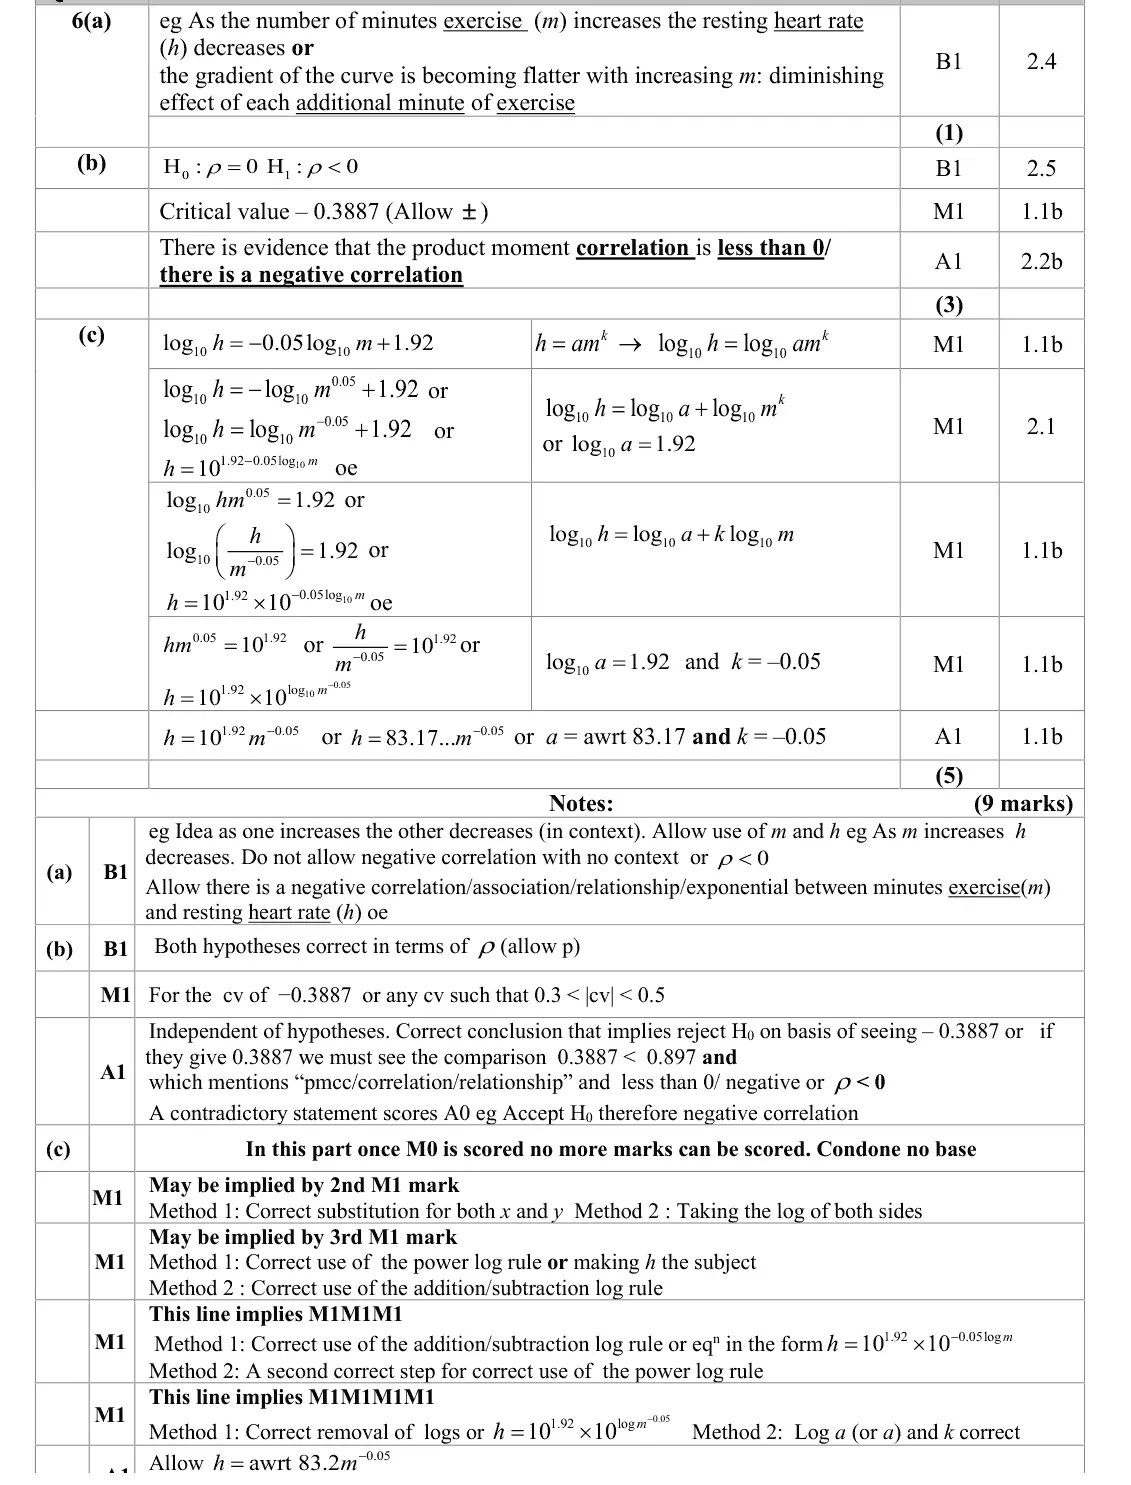
June 2022 · Paper 3 (Statistics) · Q6(c)5 marks
Mark scheme (whole question; this part is marked with the orange bar)
Examiner's comment
In part (a) a large number of students simply wrote ‘negative correlation’, with no context. The word Interpret in the question hints that context is required. Of the students that did try to truly interpret the correlation in a contextual statement, the vast majority were successful. Whilst many students realised that one- tailed hypotheses were needed in part (b) few used ρ for the parameter. Most students had ± the correct CV but the final A1 was lost by many students, as they compared the positive value 0.3887 to the negative test statistic. This showed these students were unfamiliar with the meaning of the CV/CR and how it related to their test statistic. Part (d) differentiated well between students with basic knowledge and those with deeper understanding. The majority of students scored 5/5 on this part. Almost all used the LH approach on the MS. This was usually well done, though a good number made errors with the laws of indices and maintained a + between the two terms after making the equation into powers of 10. The students knew their log rules, but many did only so to a basic degree, and came unstuck during their working. Sometimes this was to such an extent that they lost the marks. A surprisingly high number of students used natural logarithms and hence the exponential function in this question showing a less secure grip of this topic.
Common mistakes
substitute x = log₁₀m, y = log₁₀h
power and addition log laws
h = 10^1.92 × m^−0.05 = 83.2m^−0.05
keep the plus inside the log, not between powers of 10
use log base 10, not ln
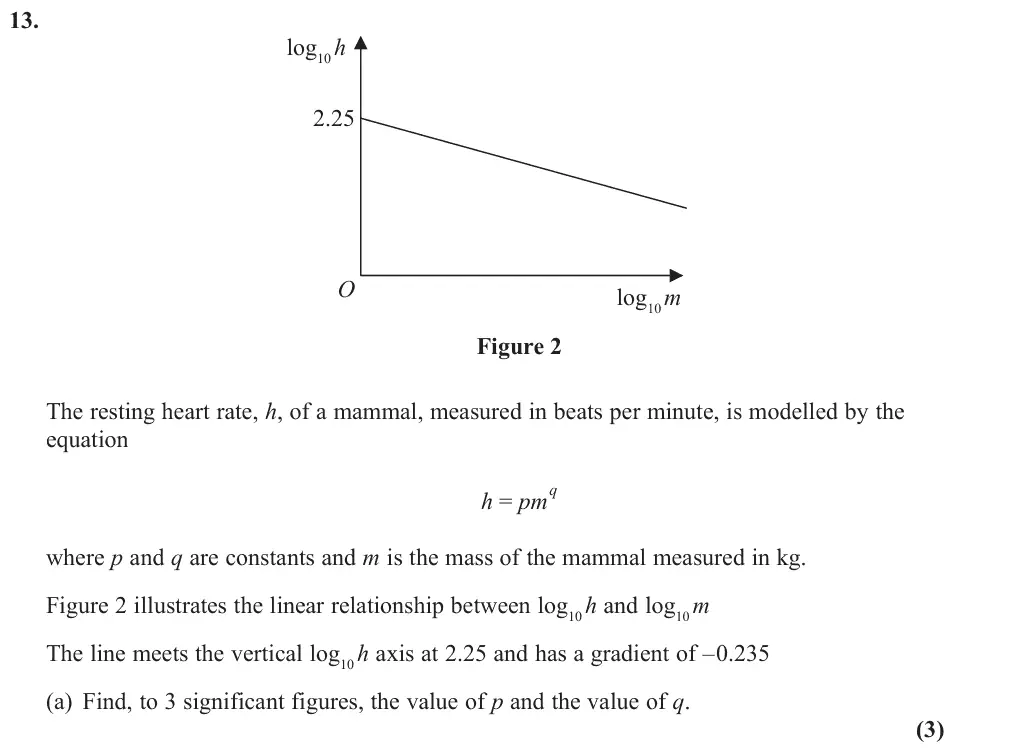
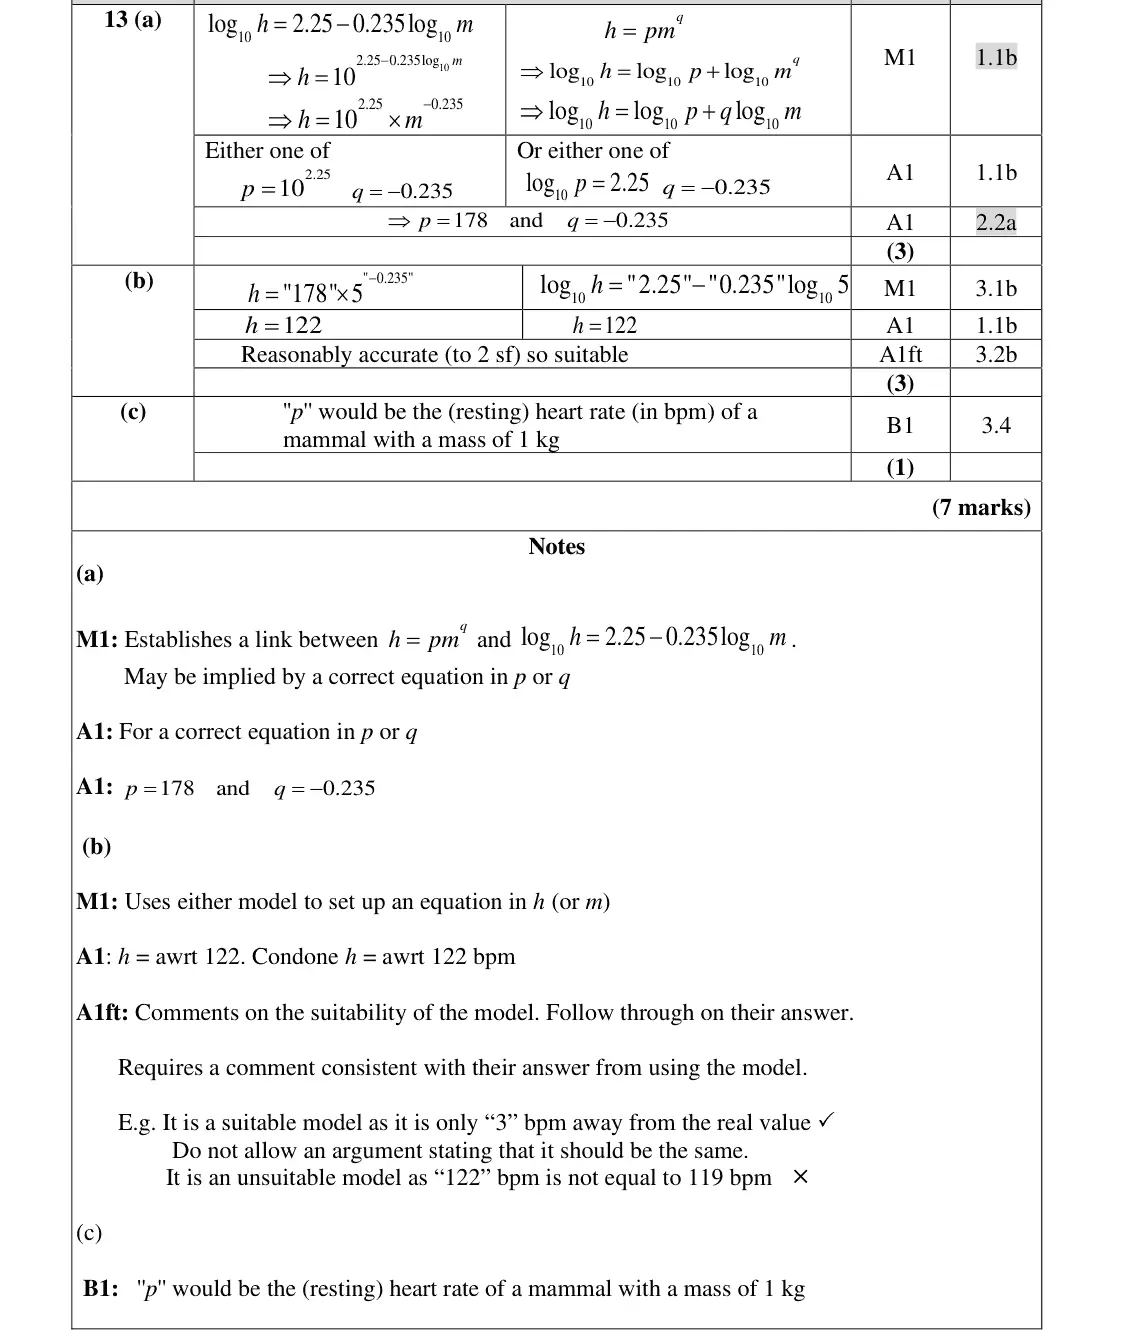
Oct 2021 · AS Paper 1 · Q13(a)3 marks
Mark scheme (whole question; this part is marked with the orange bar)
Examiner's comment
In part (a) candidates found forming a correct relationship between the linear graph and the given exponential model too difficult. Many produced incorrect equations and poor working with logarithms followed, resulting in incorrect values for p and q. As part (a) was not completed successfully in many cases, part (b) automatically was limited in its accessibility. Some candidates just made a comment, rather than use the model as they did not have values for p and q, or even those who did seemed unsure what they were finding.
Common mistakes
log h = log p + q log m: intercept log₁₀p = 2.25 gives p = 10^2.25 = 178, gradient q = −0.235
p is not 2.25
poor log work
Oct 2021 · AS Paper 1 · Q13(b)3 marks
Mark scheme (whole question; this part is marked with the orange bar)
Examiner's comment
As part (a) was not completed successfully in many cases, part (b) automatically was limited in its accessibility. Some candidates just made a comment, rather than use the model as they did not have values for p and q, or even those who did seemed unsure what they were finding.
Common mistakes
use the model with m = 5: h = 178 × 5^(−0.235) ≈ 122 bpm
compare with 119: close, so suitable
"not equal so unsuitable" does not score
must use the model, not just comment
Oct 2021 · AS Paper 1 · Q13(c)1 mark
Mark scheme (whole question; this part is marked with the orange bar)
Examiner's comment
Part (c) had a range of responses, but it was extremely rare for a mark to be scored and most failed to appreciate that the resting heart rate related to a mammal with a mass of 1 kg.
Common mistakes
p is the resting heart rate (bpm) of a mammal of mass 1 kg (m = 1 so h = p)
answered correctly very rarely
Oct 2021 · Paper 2 · Q10(a)2 marks
Mark scheme (whole question; this part is marked with the orange bar)
Examiner's comment
The majority of candidates scored both marks for part (a). A common error was omitting base 10 when writing their final equation. In “show that” questions, we need to see the equation as stated in the question.
Common mistakes
take logs base 10 and use addition and power laws
base 10 must appear in the final line
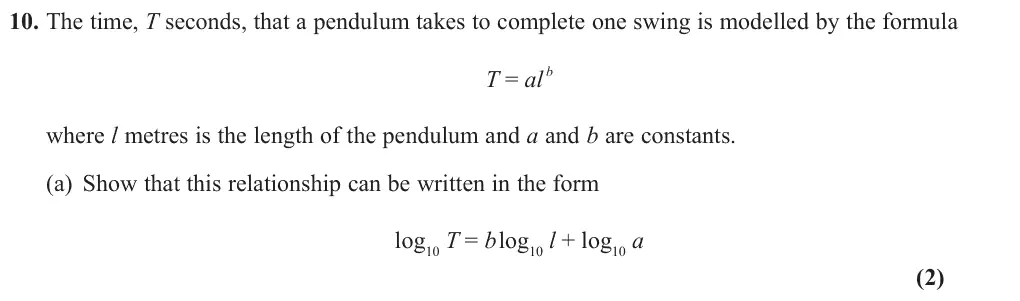
Oct 2021 · Paper 2 · Q10(b)3 marks
Mark scheme (whole question; this part is marked with the orange bar)
Examiner's comment
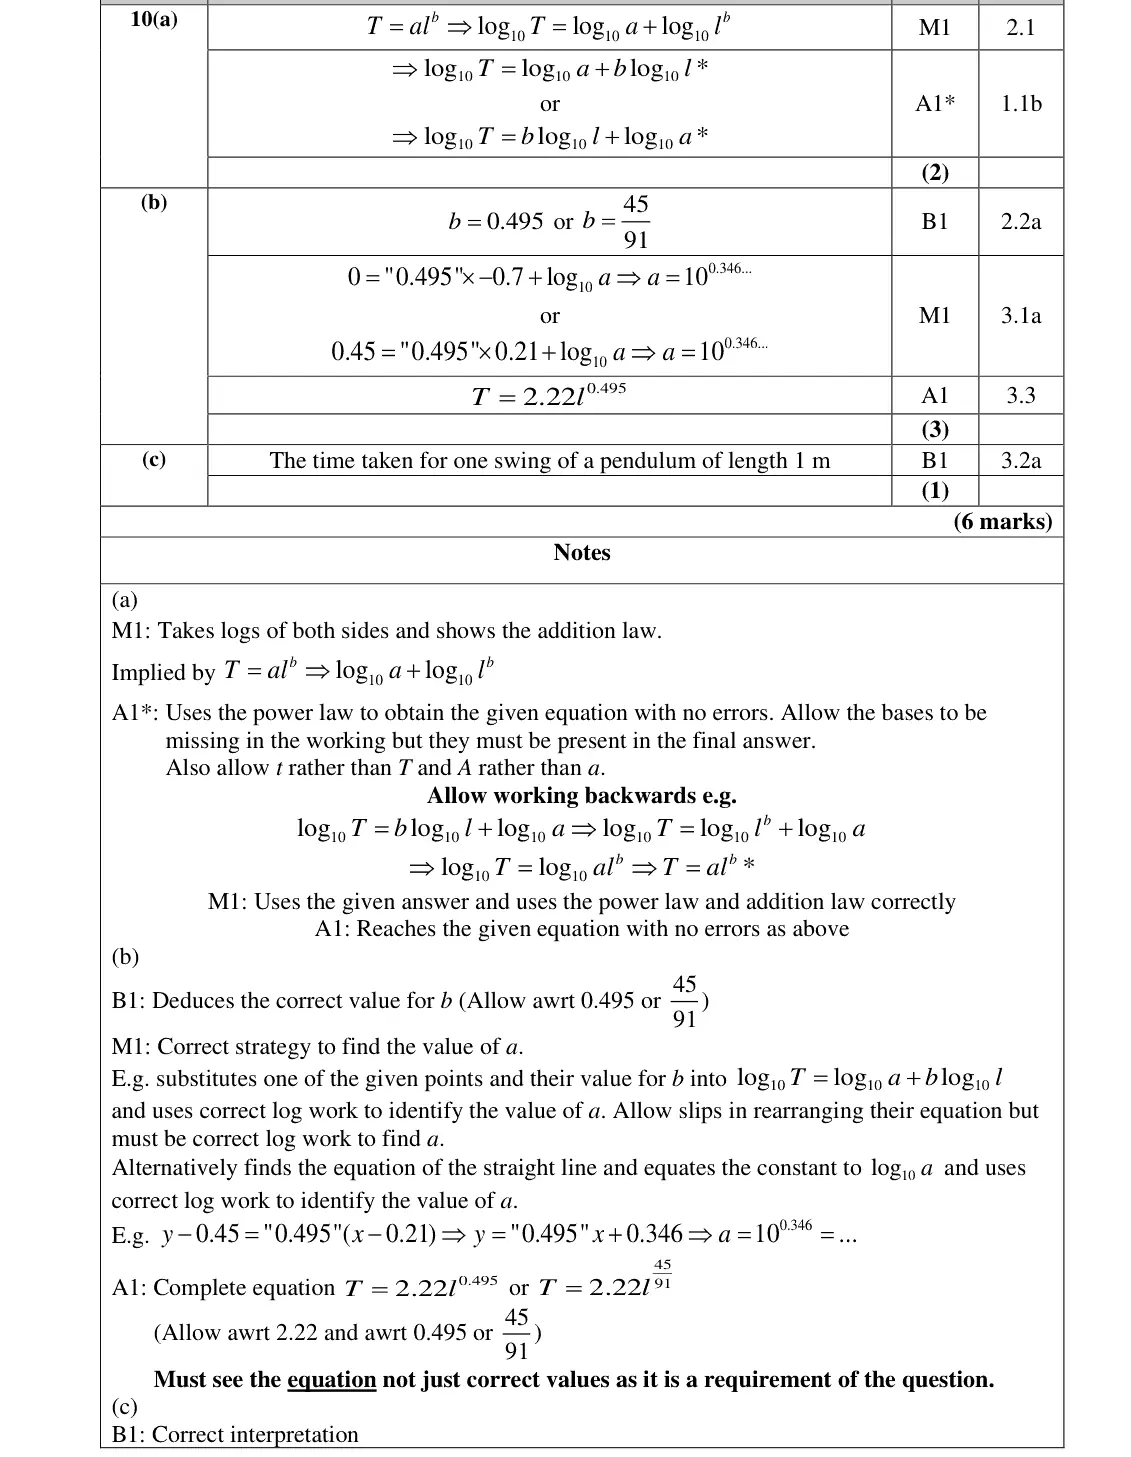
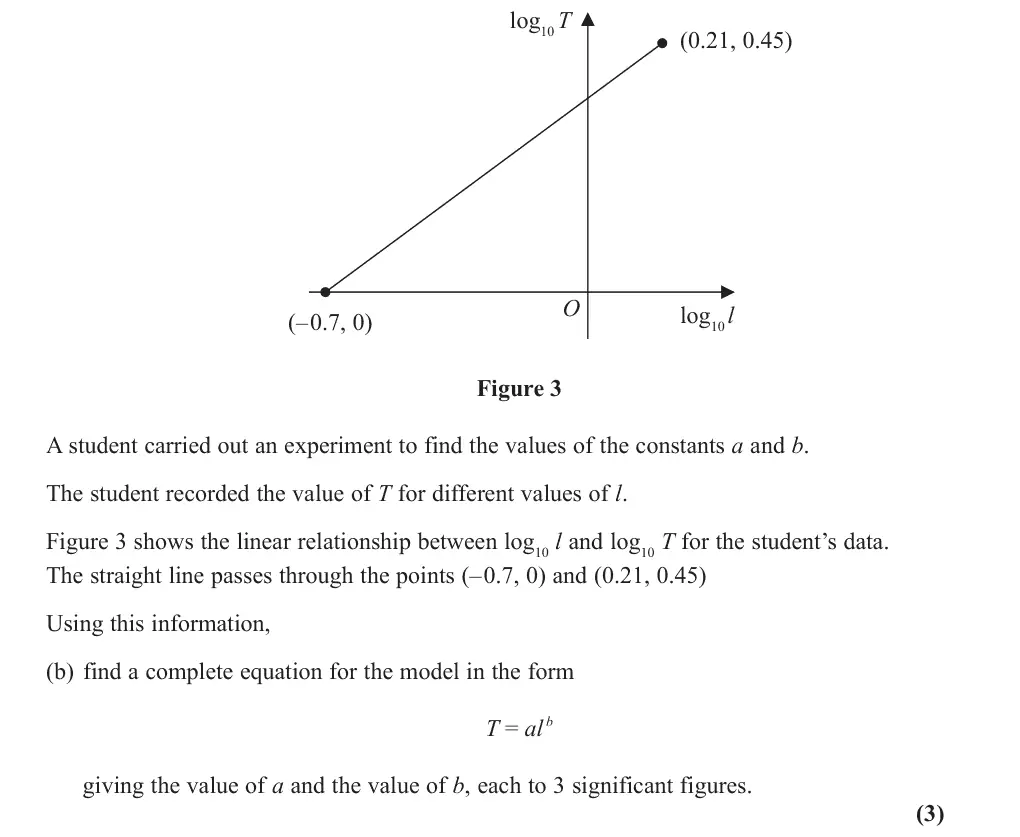
Part (b) was demanding for many candidates, with confusion as to how to correctly deal with the log terms. Most candidates who were successful found the value of by finding the gradient of the line. A less popular but usually successful approach was using simultaneous equations to eliminate . Solving the equation to find the value of caused some problems. The question required a complete equation for the model, so just stating the correct values of and without the equation written explicitly meant candidates scored 3 out of 4 marks, which was a very common error.
Common mistakes
gradient b = 0.45/0.91 = 0.495
intercept is log₁₀a so a = 10^0.346 = 2.22
must write the complete equation T = 2.22l^0.495
Oct 2021 · Paper 2 · Q10(c)1 mark
Mark scheme (whole question; this part is marked with the orange bar)
Examiner's comment
Part (c) was very rarely completed successfully. Common errors were thinking was the intercept on the T axis or the time for the initial swing of the pendulum.
Common mistakes
a is the time (s) for one swing of a 1 m pendulum (l = 1)
not the intercept or the time of the first swing
Oct 2020 · AS Paper 1 · Q12(a)4 marks
Mark scheme (whole question; this part is marked with the orange bar)
Examiner's comment
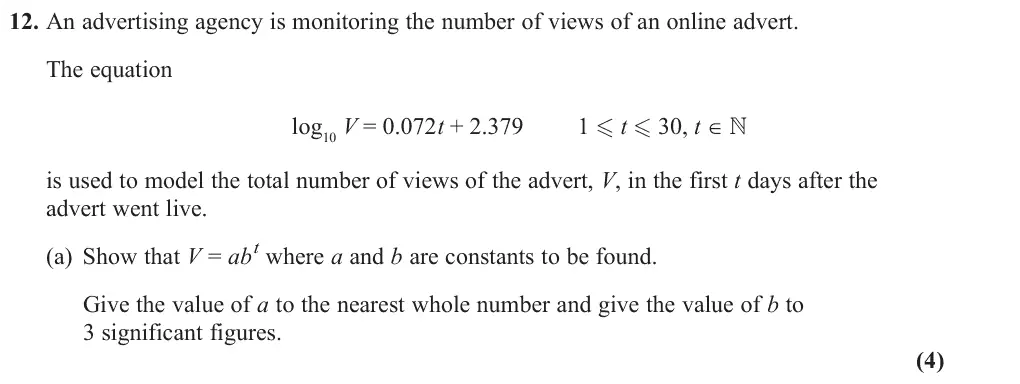
This question proved to be more challenging for candidates than was anticipated. There were a large number of candidates who did not attempt the question at all, or of those who did, most seemed to struggle with showing the relationship between the log form of the equation and t V ab = . It was very rare for full marks to be achieved, with most securing around half of the available marks in total for the question. In part (a) many candidates were able to correctly calculate the value for ‘a’ and ‘b’, however, they lost marks due to the fact that they did not appreciate the “show that” nature of the question. Missing out writing both log log log t V a b = + and log log log V a t b = + was common and this resulted in the first mark. As it was an incomplete solution, candidates also lost the final mark, too. A number of candidates rounded both of their values to the nearest whole number, which was only required for a. This was only penalised if they never had 1.18 b = at some point. Usually, candidates had lost the first mark anyway from insufficient working, so it rarely was the reason for not achieving full marks.
Common mistakes
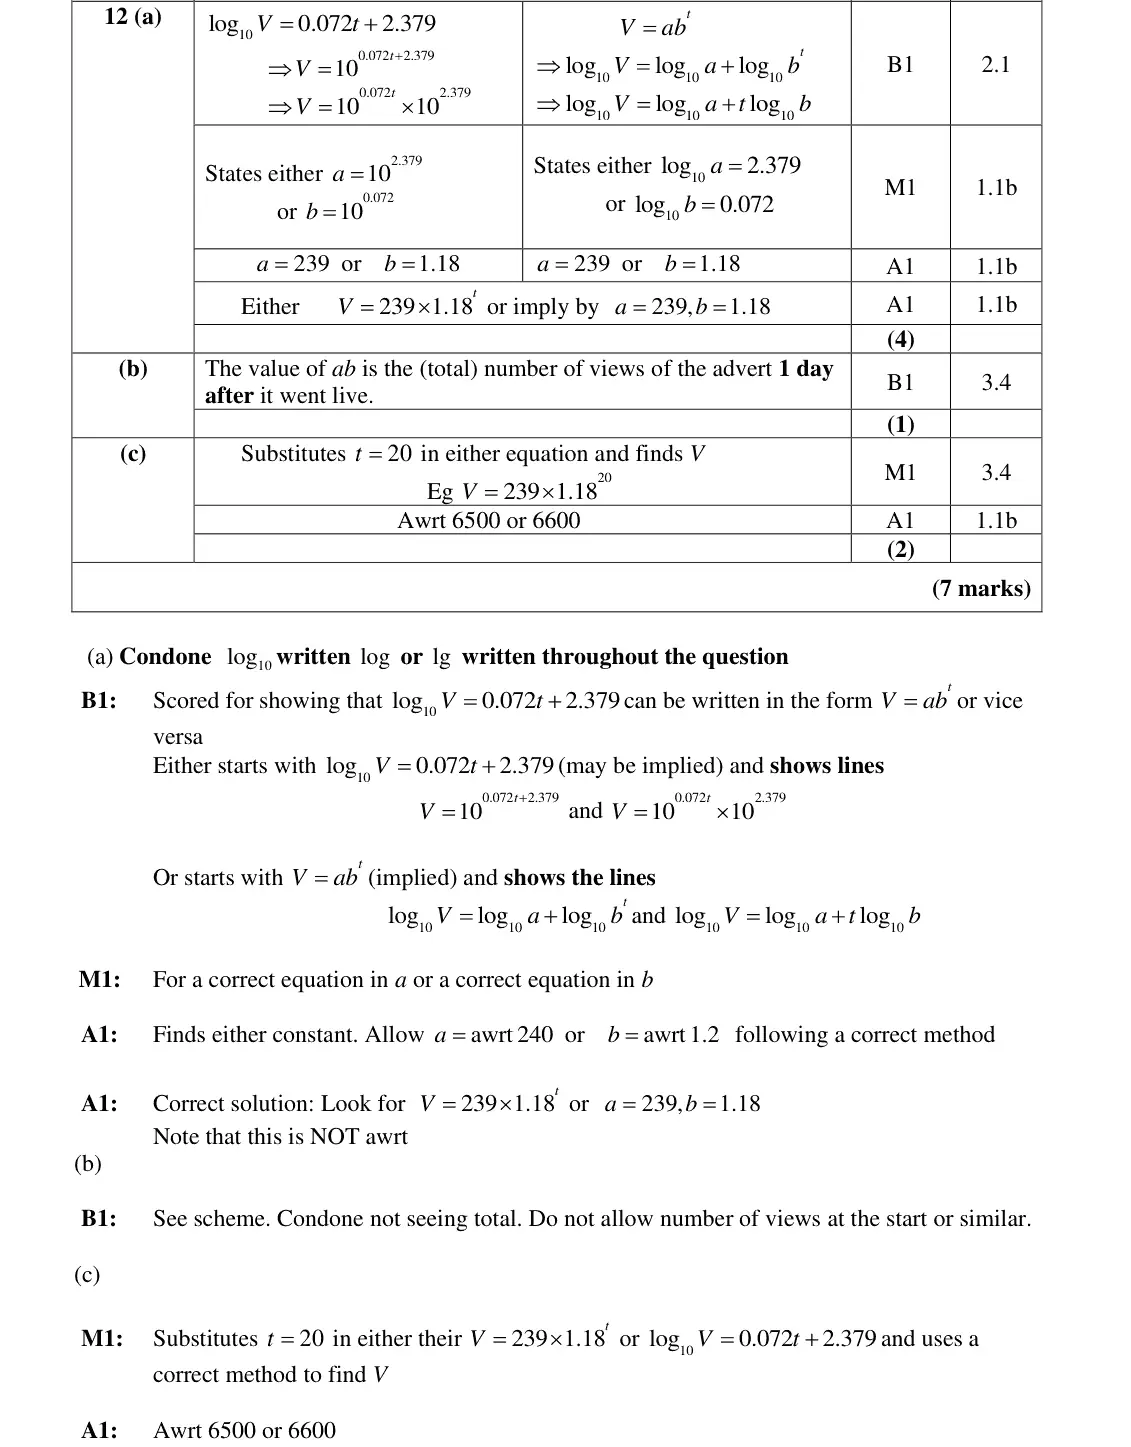
must show V = 10^(0.072t) × 10^2.379 (or log V = log a + t log b)
a = 239, b = 1.18
only a is to the nearest whole number
Oct 2020 · AS Paper 1 · Q12(b)1 mark
Mark scheme (whole question; this part is marked with the orange bar)
Examiner's comment
This question proved to be more challenging for candidates than was anticipated. There were a large number of candidates who did not attempt the question at all, or of those who did, most seemed to struggle with showing the relationship between the log form of the equation and t V ab = . It was very rare for full marks to be achieved, with most securing around half of the available marks in total for the question. Very few candidates were successful in part (b). Most went with a standard response of stating it was the “the initial number of views” which was incorrect as t could not be 0. Had they just copied the relevant part at the start of the question replacing t with one, they would have scored the mark. 11
Common mistakes
ab is the total views 1 day after the advert went live (t = 1), not the initial number of views (t ≥ 1)
June 2019 · Paper 2 · Q9(a)3 marks
Mark scheme (whole question; this part is marked with the orange bar)
Examiner's comment
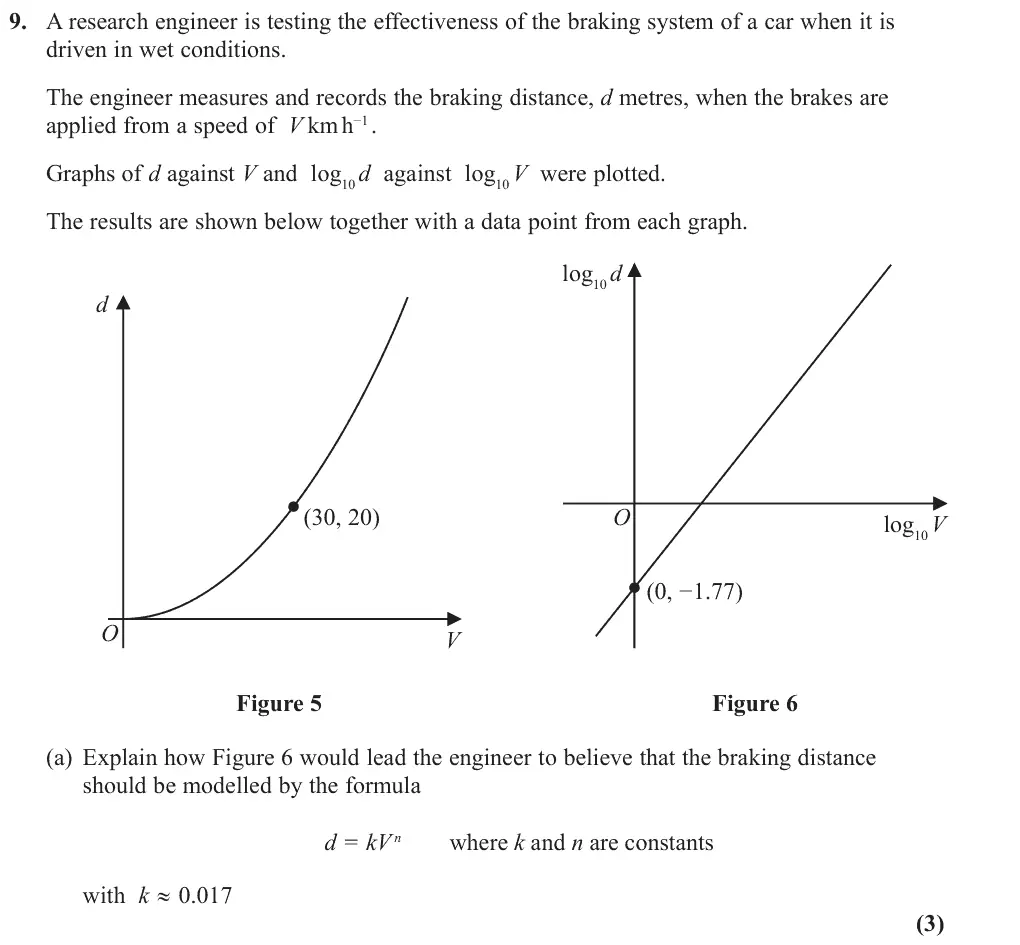
In general, Q09 discriminated well between candidates of all abilities. Q09(b) and Q09(c) were more accessible to candidates than Q09(a). Some candidates left Q09(a) blank while others struggled to make any creditable progress. In Q09(a), many candidates wrote down a valid log equation as part of their explanation. log log log d k n V Those who used mathematical reasoning to progress from 10 10 10 n d kV to (or vice versa) usually showed an intermediate step in their working and so were successful in their explanation. A few candidates made errors in progressing between these two equations, such as an incorrect method of combining logarithms (e.g. c n log log d n kV 10 ). d V ), or an incorrect use of powers (e.g. Those who 10 10 usually did so clearly made a direct comparison of their log equation with y mx c n log k in d kV enough but sometimes did not allude to (if using 1.77 rather than 10 10 1.77 their log equation). A significant number of candidates did not apply or use k logarithms to show that 0.017. V d n d kV In Q09(b), the majority of candidates substituted and into and 30 20 n 2.08. applied logarithms correctly, leading to the correct value of A few 0.017(30)n candidates used the incorrect method of simplifying 20 to give n 20 (0.51) . Some candidates substituted in V and d the wrong way around, usually n 2.50, leading to and a few used both V and d as 20. A small minority substituted V d and into a correct log equation, while a few others correctly found n by 30 20 (log 30, log 20). finding the gradient between the known points (0, 1.77) and 10 10 2.08 (0.017) d V The most common mistake was not writing a complete equation or n log 1.77 2.08log d V 2.08. after finding a correct 10 10 V In Q09(c), most candidates applied to their exponential model and found the 60 braking distance. Some then used the incorrect method of comparing this breaking distance with the overall stopping distance. The majority attempted to calculate the thinking distance and either added it to their breaking distance d or subtracted it from 100. The main error was due to the units. Some candidates did not attempt to convert 60 kmh to ms and simply multiplied 60 by the thinking time of 0.8 seconds to 1 1 obtain a thinking distance of 48 metres. Others only managed a partial conversion, with 1 some using 1 instead of 13.3m km 75 metres as their thinking distance. In 75 some of the answers, candidates used an incorrect method of combining their values to give a dimensionally incorrect quantity. For example, they might add their breaking distance to either a speed or a time. Candidates who obtained a thinking distance of 13.3m usually reached a correct answer and conclusion. A few compared the maximum speed needed to stop at the puddle with the given 60, while even fewer n 2.08; compared the maximum value of n needed to stop at the puddle with and with correct conclusions these were valid solutions.
Common mistakes
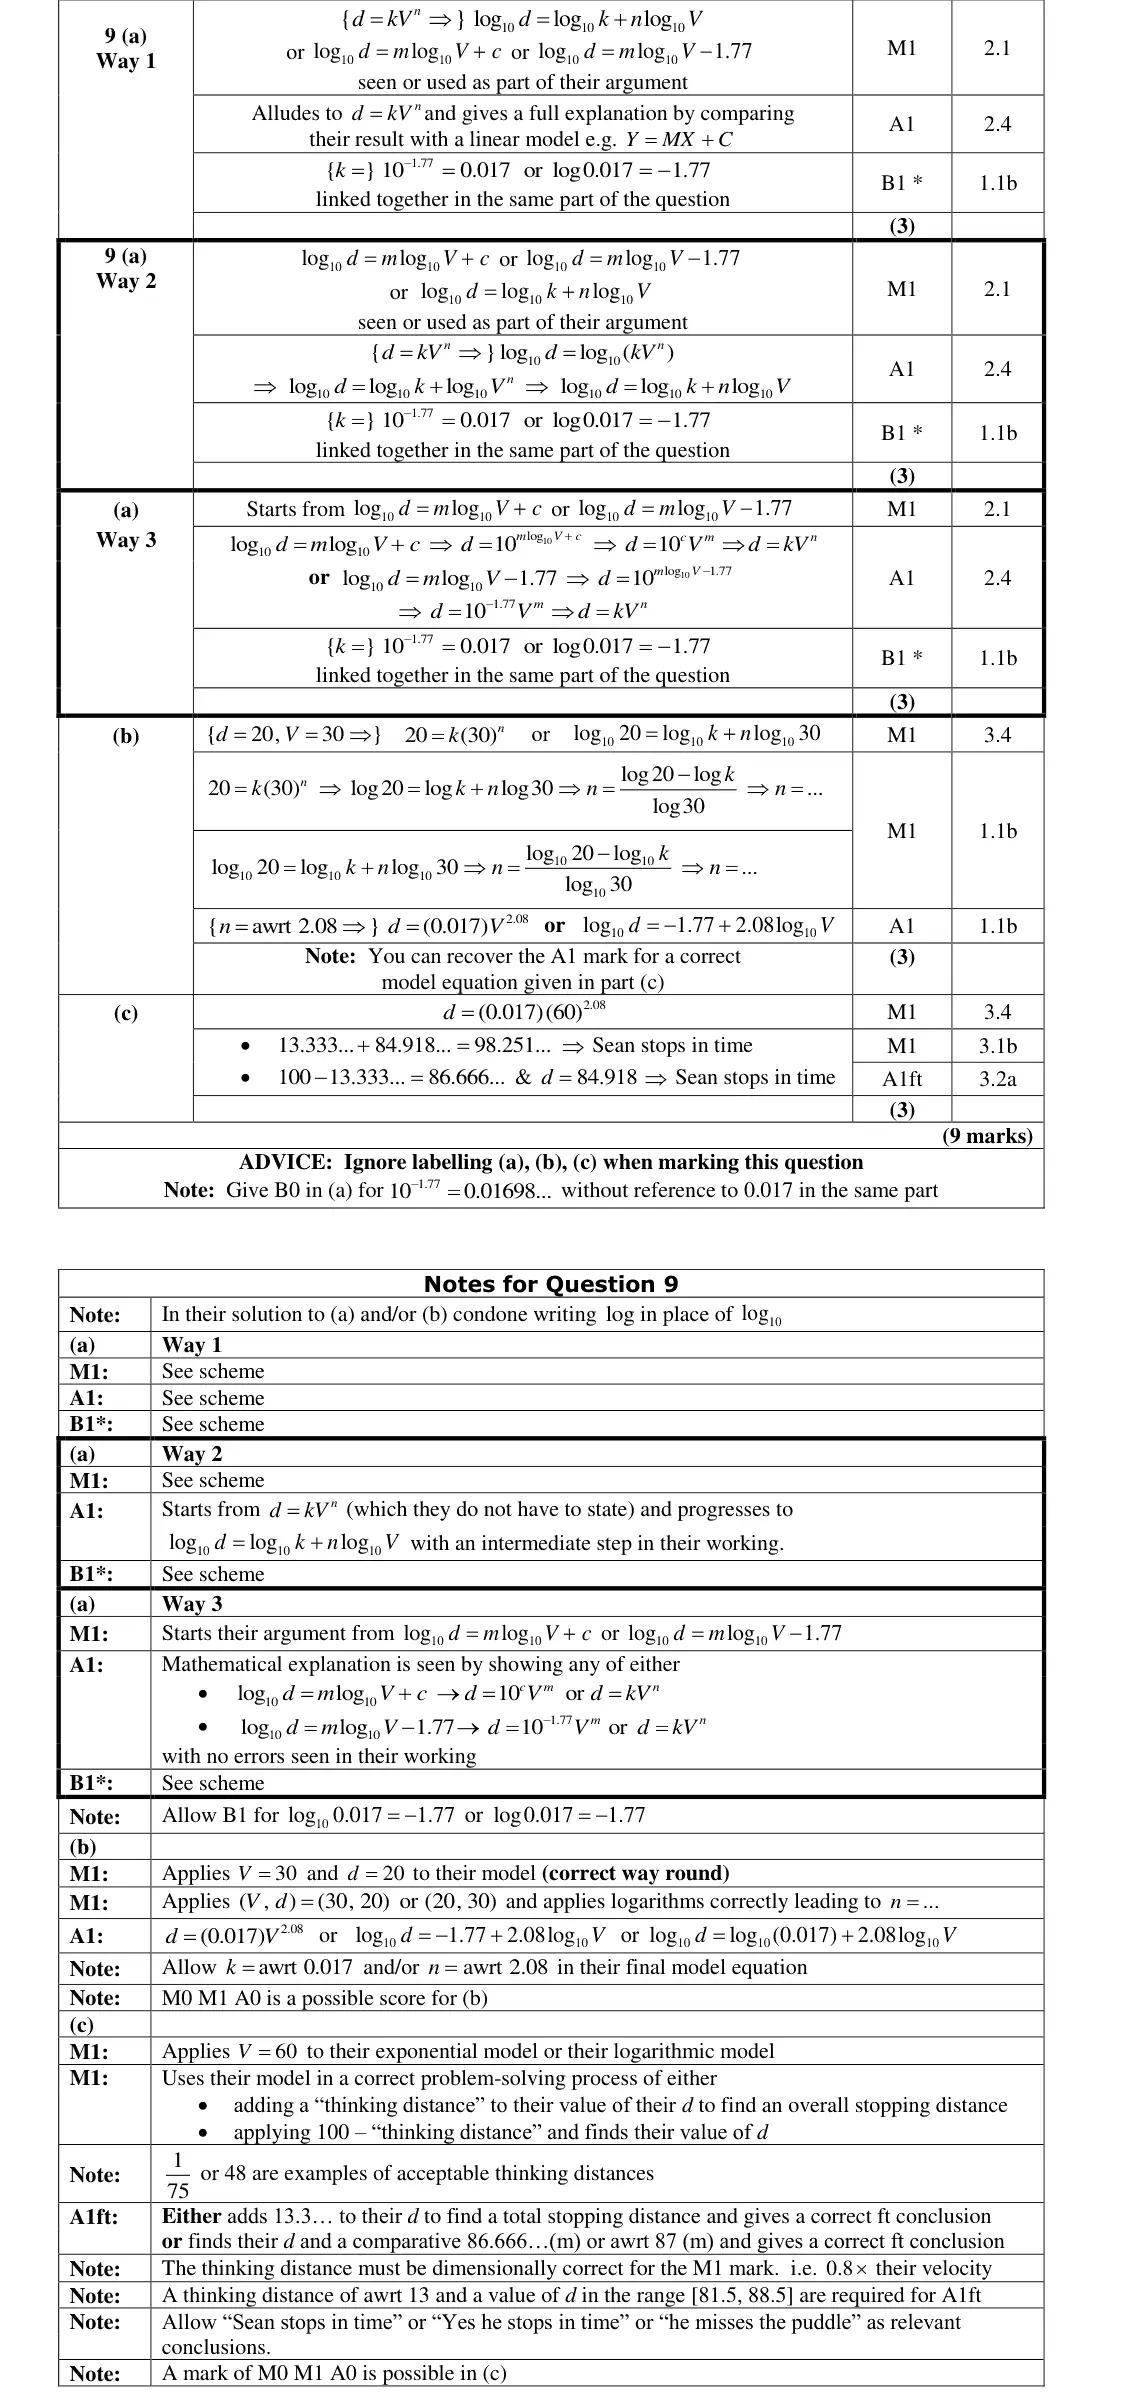
log d = log k + n log V compared with Y = mX + c, with an intermediate step
intercept −1.77 gives k = 10^−1.77 = 0.017 (must be linked)
log(kVⁿ) wrongly as n log(kV)
June 2019 · Paper 2 · Q9(b)3 marks
Mark scheme (whole question; this part is marked with the orange bar)
Examiner's comment
In general, Q09 discriminated well between candidates of all abilities. Q09(b) and Q09(c) were more accessible to candidates than Q09(a). Some candidates left Q09(a) blank while others struggled to make any creditable progress. In Q09(a), many candidates wrote down a valid log equation as part of their explanation. log log log d k n V Those who used mathematical reasoning to progress from 10 10 10 n d kV to (or vice versa) usually showed an intermediate step in their working and so were successful in their explanation. A few candidates made errors in progressing between these two equations, such as an incorrect method of combining logarithms (e.g. c n log log d n kV 10 ). d V ), or an incorrect use of powers (e.g. Those who 10 10 usually did so clearly made a direct comparison of their log equation with y mx c n log k in d kV enough but sometimes did not allude to (if using 1.77 rather than 10 10 1.77 their log equation). A significant number of candidates did not apply or use k logarithms to show that 0.017. V d n d kV In Q09(b), the majority of candidates substituted and into and 30 20 n 2.08. applied logarithms correctly, leading to the correct value of A few 0.017(30)n candidates used the incorrect method of simplifying 20 to give n 20 (0.51) . Some candidates substituted in V and d the wrong way around, usually n 2.50, leading to and a few used both V and d as 20. A small minority substituted V d and into a correct log equation, while a few others correctly found n by 30 20 (log 30, log 20). finding the gradient between the known points (0, 1.77) and 10 10 2.08 (0.017) d V The most common mistake was not writing a complete equation or n log 1.77 2.08log d V 2.08. after finding a correct 10 10 V In Q09(c), most candidates applied to their exponential model and found the 60 braking distance. Some then used the incorrect method of comparing this breaking distance with the overall stopping distance. The majority attempted to calculate the thinking distance and either added it to their breaking distance d or subtracted it from 100. The main error was due to the units. Some candidates did not attempt to convert 60 kmh to ms and simply multiplied 60 by the thinking time of 0.8 seconds to 1 1 obtain a thinking distance of 48 metres. Others only managed a partial conversion, with 1 some using 1 instead of 13.3m km 75 metres as their thinking distance. In 75 some of the answers, candidates used an incorrect method of combining their values to give a dimensionally incorrect quantity. For example, they might add their breaking distance to either a speed or a time. Candidates who obtained a thinking distance of 13.3m usually reached a correct answer and conclusion. A few compared the maximum speed needed to stop at the puddle with the given 60, while even fewer n 2.08; compared the maximum value of n needed to stop at the puddle with and with correct conclusions these were valid solutions.
Common mistakes
substitute V = 30, d = 20 the correct way round: n = 2.08
give the complete equation d = 0.017V^2.08
20 = 0.017(30)ⁿ wrongly simplified to (0.51)ⁿ
June 2019 · Paper 2 · Q9(c)3 marks
Mark scheme (whole question; this part is marked with the orange bar)
Examiner's comment
In general, Q09 discriminated well between candidates of all abilities. Q09(b) and Q09(c) were more accessible to candidates than Q09(a). Some candidates left Q09(a) blank while others struggled to make any creditable progress. In Q09(a), many candidates wrote down a valid log equation as part of their explanation. log log log d k n V Those who used mathematical reasoning to progress from 10 10 10 n d kV to (or vice versa) usually showed an intermediate step in their working and so were successful in their explanation. A few candidates made errors in progressing between these two equations, such as an incorrect method of combining logarithms (e.g. c n log log d n kV 10 ). d V ), or an incorrect use of powers (e.g. Those who 10 10 usually did so clearly made a direct comparison of their log equation with y mx c n log k in d kV enough but sometimes did not allude to (if using 1.77 rather than 10 10 1.77 their log equation). A significant number of candidates did not apply or use k logarithms to show that 0.017. V d n d kV In Q09(b), the majority of candidates substituted and into and 30 20 n 2.08. applied logarithms correctly, leading to the correct value of A few 0.017(30)n candidates used the incorrect method of simplifying 20 to give n 20 (0.51) . Some candidates substituted in V and d the wrong way around, usually n 2.50, leading to and a few used both V and d as 20. A small minority substituted V d and into a correct log equation, while a few others correctly found n by 30 20 (log 30, log 20). finding the gradient between the known points (0, 1.77) and 10 10 2.08 (0.017) d V The most common mistake was not writing a complete equation or n log 1.77 2.08log d V 2.08. after finding a correct 10 10 V In Q09(c), most candidates applied to their exponential model and found the 60 braking distance. Some then used the incorrect method of comparing this breaking distance with the overall stopping distance. The majority attempted to calculate the thinking distance and either added it to their breaking distance d or subtracted it from 100. The main error was due to the units. Some candidates did not attempt to convert 60 kmh to ms and simply multiplied 60 by the thinking time of 0.8 seconds to 1 1 obtain a thinking distance of 48 metres. Others only managed a partial conversion, with 1 some using 1 instead of 13.3m km 75 metres as their thinking distance. In 75 some of the answers, candidates used an incorrect method of combining their values to give a dimensionally incorrect quantity. For example, they might add their breaking distance to either a speed or a time. Candidates who obtained a thinking distance of 13.3m usually reached a correct answer and conclusion. A few compared the maximum speed needed to stop at the puddle with the given 60, while even fewer n 2.08; compared the maximum value of n needed to stop at the puddle with and with correct conclusions these were valid solutions.
Common mistakes
d(60) = 84.9 m
thinking distance 60 km/h = 16.7 m/s × 0.8 = 13.3 m (not 48 m – convert units)
98.3 < 100 so he stops in time
compare total stopping distance, not braking distance alone
June 2019 · Paper 3 (Statistics) · Q3(c)5 marks
Mark scheme (whole question; this part is marked with the orange bar)
Examiner's comment
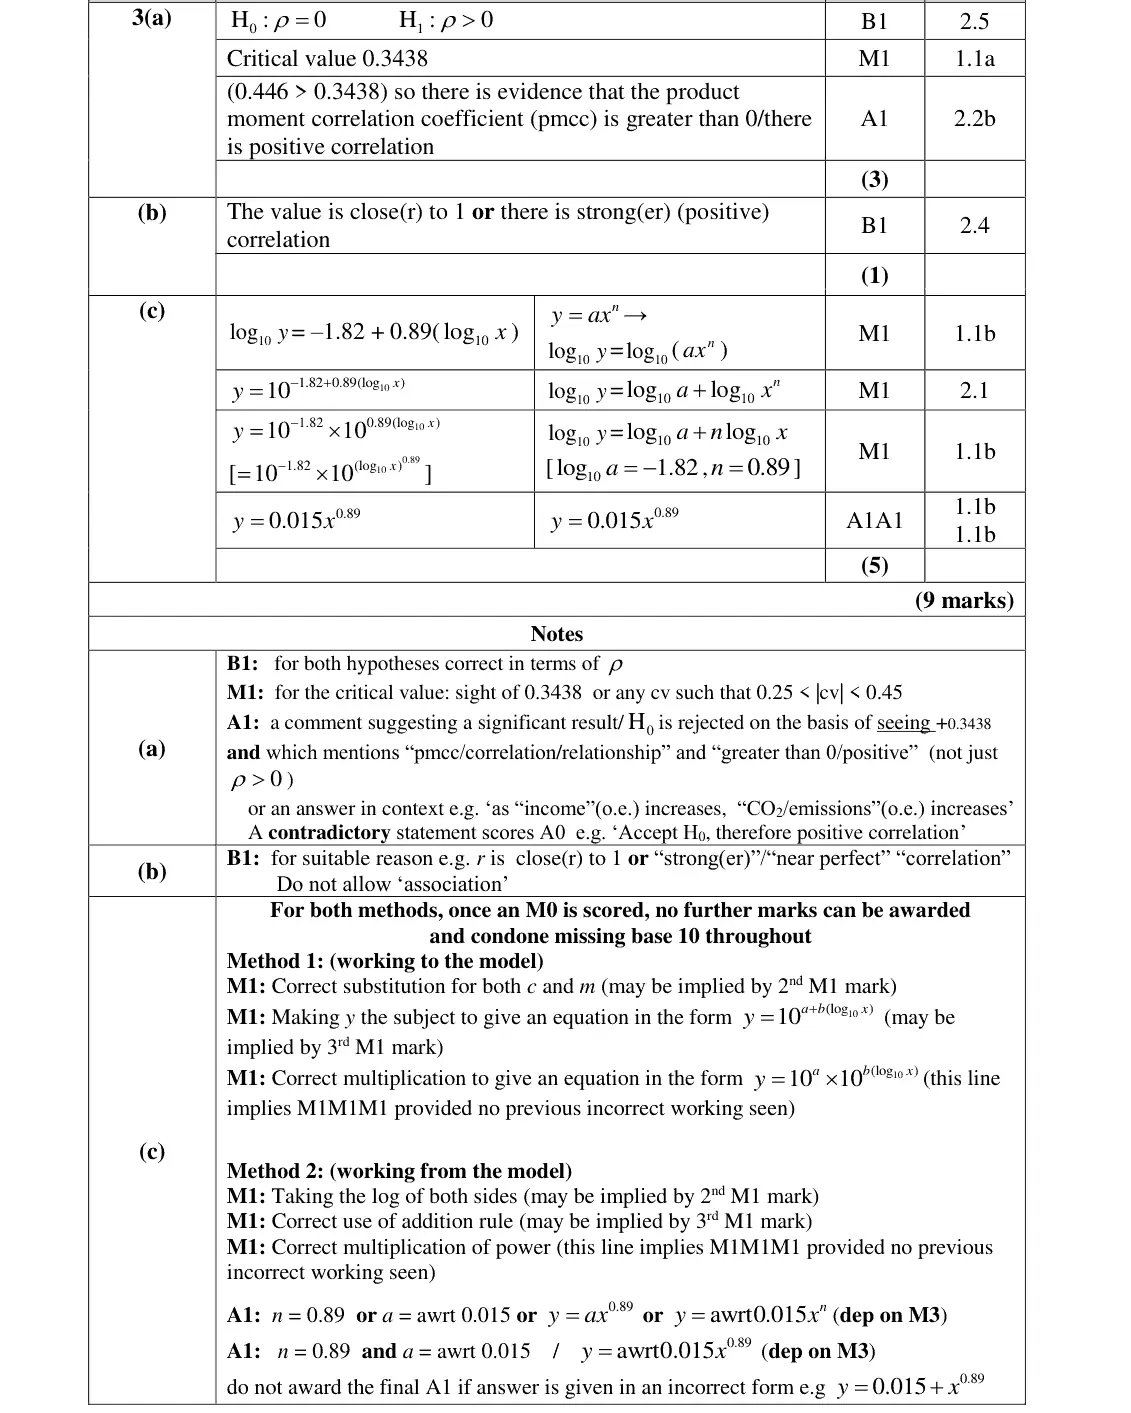
This was the second most successful question on the paper with nearly a quarter of candidates A variety of approaches were taken to answer part (c). Those that opted to take method 2 (working from the model) on the whole were usually more successful, as many could jump . A common error was to give n = 7.762… .0.89 log log log y a n x straight to 10 10 10 10 Those candidates that struggled with this question were able to score the first mark as many log 1.82 0.89(log ) y x could state but then failed to make y the subject. Even those 10 10 candidates that could deal with logarithms often lost the final mark as did not evaluate their 10 1.82 value of a (too many left this as ).
Common mistakes
log y = −1.82 + 0.89 log x
make y the subject: y = 10^−1.82 × x^0.89 = 0.015x^0.89
evaluate a (not left as 10^−1.82)
n = 0.89 not 10^0.89
June 2018 · AS Paper 1 · Q13(a)4 marks
Mark scheme (whole question; this part is marked with the orange bar)
Examiner's comment
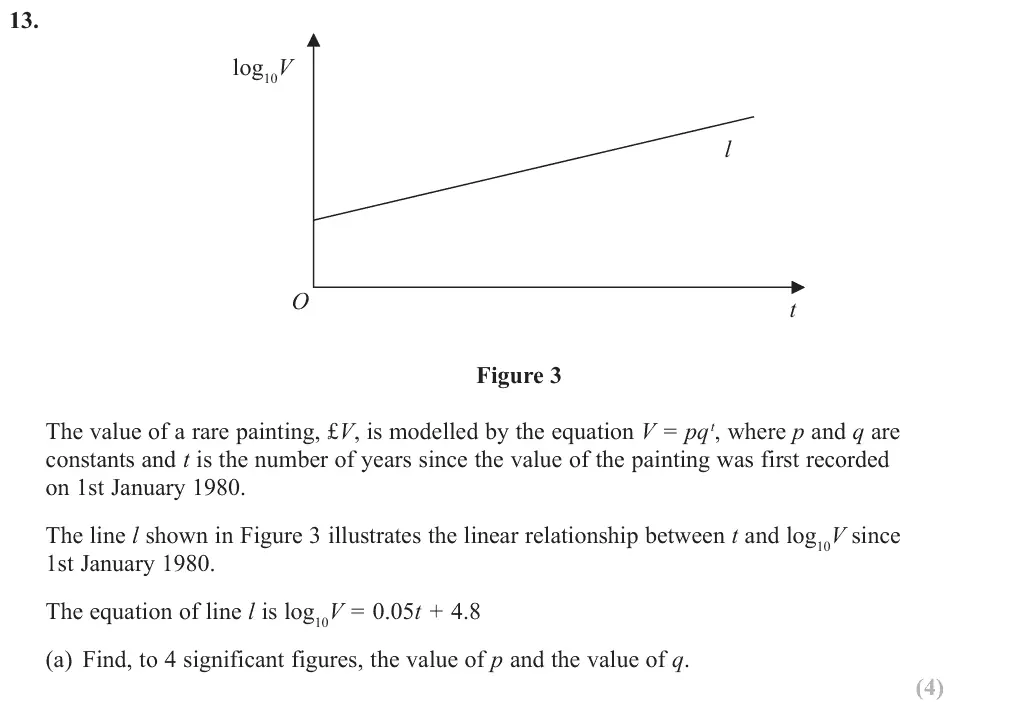
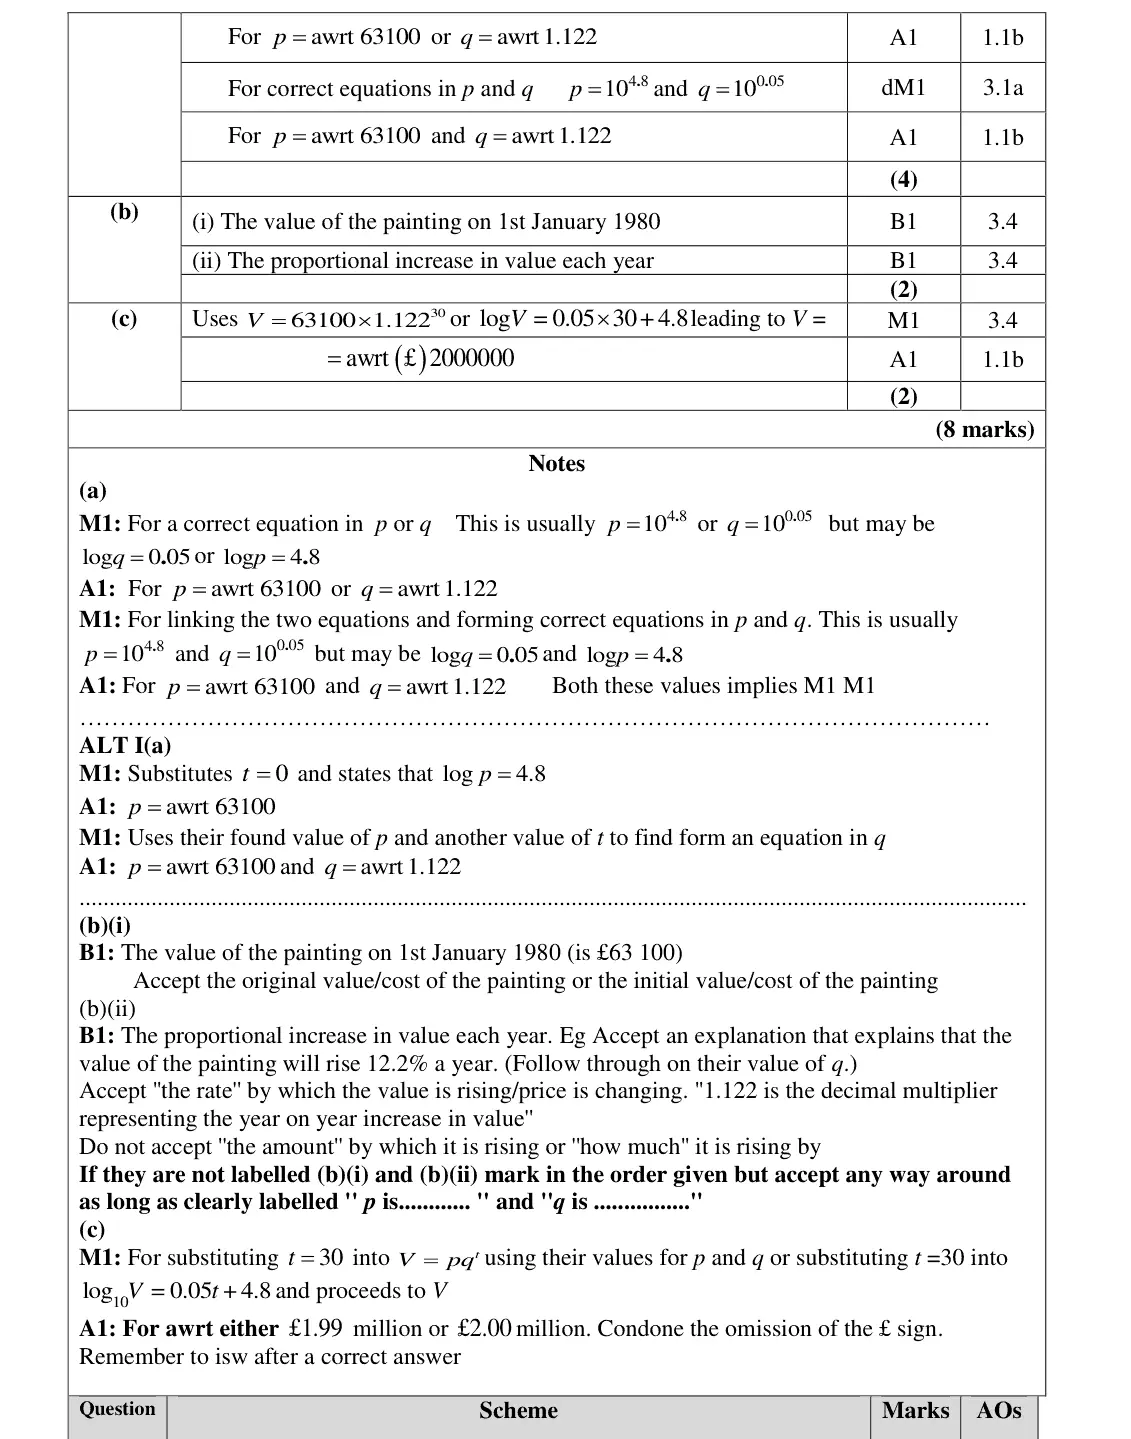
Although this was another new question, it was less well attempted than others with more students leaving this question blank, or starting the question but not gaining any marks. (a) where students correctly identified the link with p, q and the formula, they were able to correctly work out the values of p and q. The most common method was to convert to powers of 10. A common error was incorrectly rounding p = 63095. to 6310, instead of 63100. Although this was not penalised in part (a), it did often lead to a wrong answer in part (c). A small number of students converted the question into logs and a few also substituted values in for t and used logs to solve. Part (b) was attempted by the majority of students, even for those who failed to attempt part (a). Part (i) was well answered with the majority of students identifying p as the initial value of the painting. A few students did not put their statement in the context of the model. In part (ii) common mistakes were to state it was the increase in value, rather than to link it to the rate or proportional increase, or to state it was the gradient of the line. Very few students explained that the value of the painting would rise by 12.2% a year or that 1.122 was the decimal multiplier representing the year on year increase in value. part (a) often led to the loss of the accuracy mark here.
Common mistakes
log V = log p + t log q, so p = 10^4.8 = 63 100 and q = 10^0.05 = 1.122 (4 s.f.)
rounding p to 6310 is a common slip that spoils (c)
June 2018 · AS Paper 1 · Q13(b)2 marks
Mark scheme (whole question; this part is marked with the orange bar)
Examiner's comment
Although this was another new question, it was less well attempted than others with more students leaving this question blank, or starting the question but not gaining any marks. Part (b) was attempted by the majority of students, even for those who failed to attempt part (a). Part (i) was well answered with the majority of students identifying p as the initial value of the painting. A few students did not put their statement in the context of the model. In part (ii) common mistakes were to state it was the increase in value, rather than to link it to the rate or proportional increase, or to state it was the gradient of the line. Very few students explained that the value of the painting would rise by 12.2% a year or that 1.122 was the decimal multiplier representing the year on year increase in value.
Common mistakes
p is the value on 1 January 1980 (initial value)
q is the proportional increase per year (rises 12.2% a year), not "the amount" it rises by or the gradient of the line
Find an Edexcel maths tutor
Stuck on this? Book a trial session with an Edexcel specialist.