76 question parts, 184 marks, 10 with a difficulty rating from the examiner's report
Notes, worked examples and practice for this topic are being written by our tutors. The past-paper questions below are ready now: work each one on paper, then open the mark scheme and the examiner's comment.
Tap a question to zoom it. Mark scheme and examiner's comment open under each question.
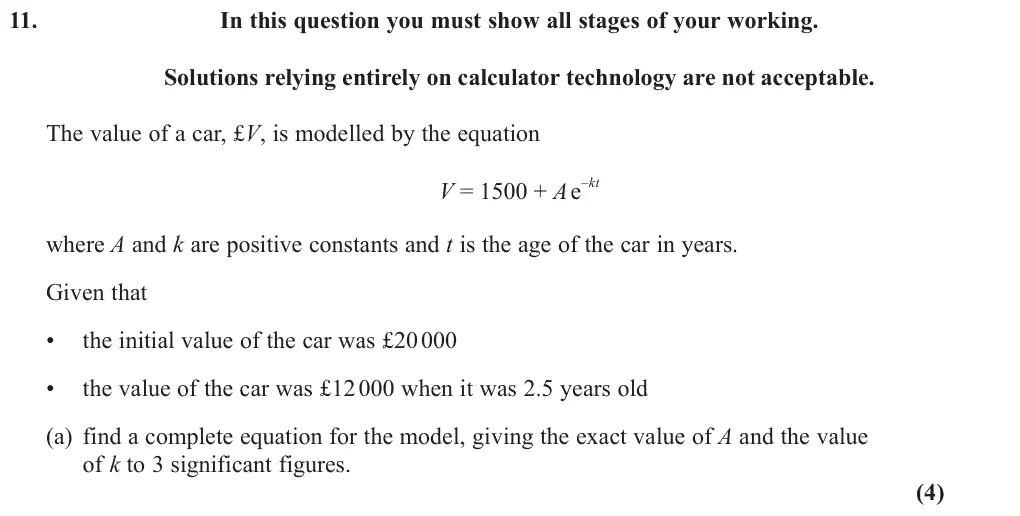
June 2025 · Paper 1 · Q11(a)4 marks
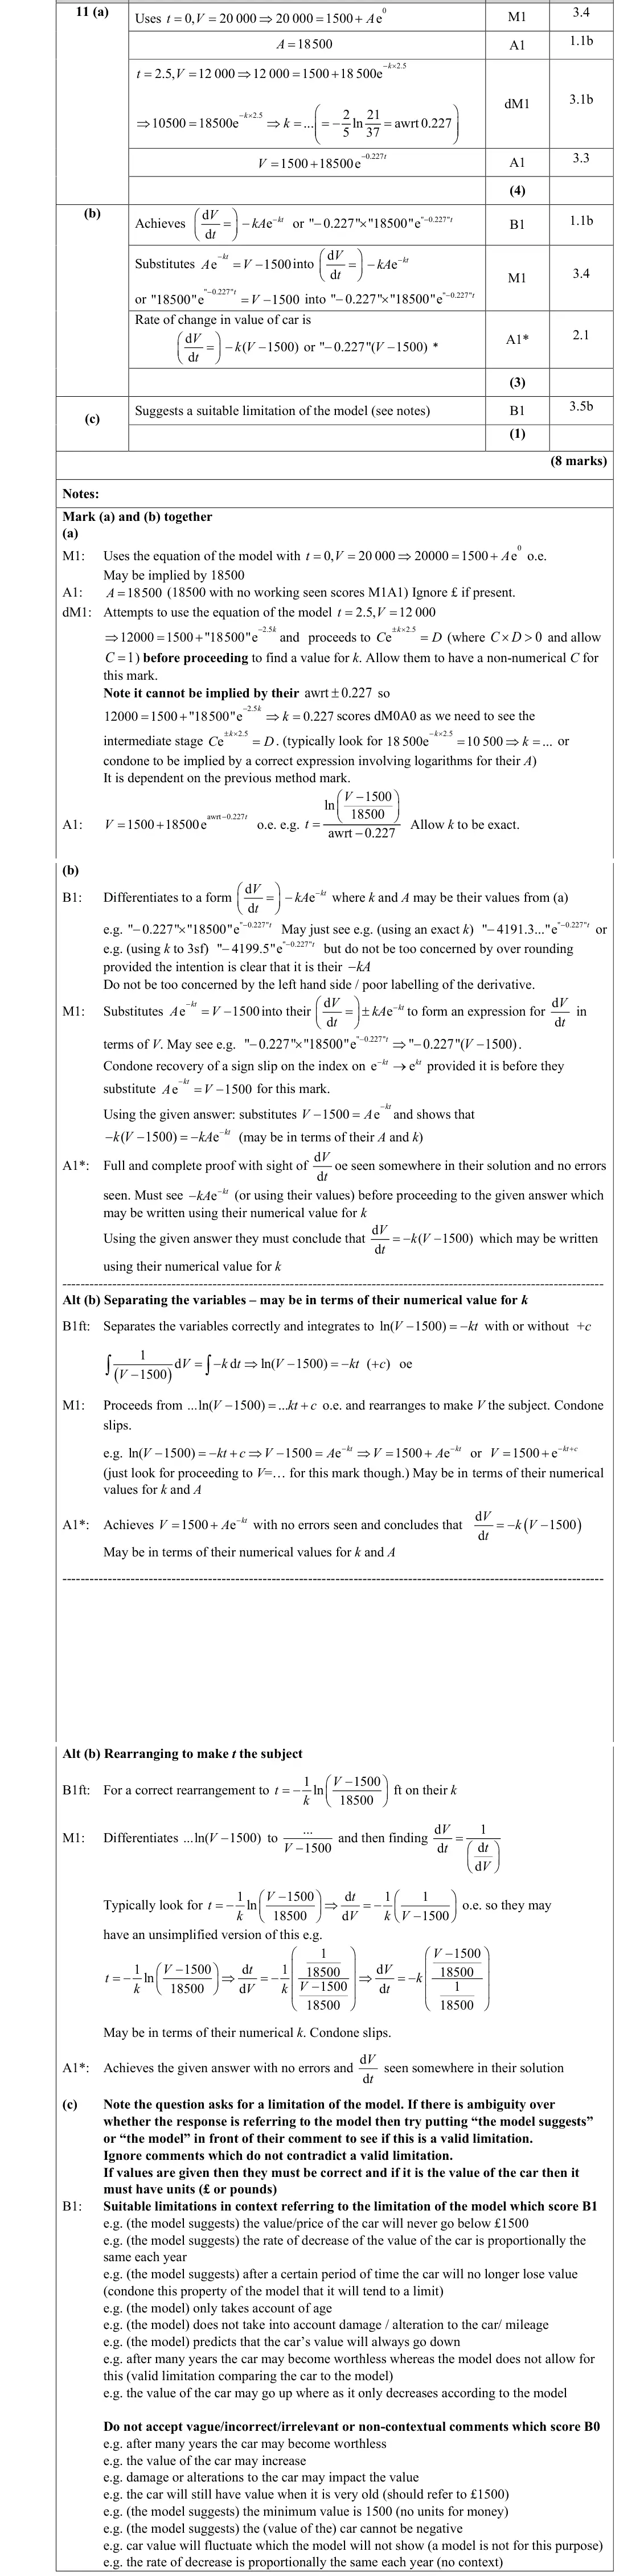
Mark scheme (whole question; this part is marked with the orange bar)
Examiner's comment
0, 20000 t V In part (a) many responses substituted in and proceeded correctly to = = to score the first two marks. The majority were able to rearrange the equation 18500 A = appropriately to find k , with accurate logarithmic manipulation following an equation of the required form. Calculation errors were rare and primarily arose from minor slips rather than conceptual misunderstandings. The most common reason for not gaining the final accuracy mark was due to not writing out the full exponential model explicitly after finding A and k . However, a small number retrieved this mark in part (b) by correctly stating the equation at k but many used their own model from part (a) which could also score all the marks. Nearly all learners who completed (b) included d V t in their solution. Some learners tried to use the d given answer in their working but to score full marks they needed to conclude that d V ( ) 1500 . k V t = - - d e kt - kA Those who worked in terms of A and k and differentiated to get tended to be more - successful in completing the proof, as the substitution step was more direct: simply e kt e kt 1500 - A - and replacing in the derivative. When they used V A to isolate rearranging = + d V 0.227 t 0.227 18500e - numerical values, it would typically result in which was the most = - x d t successful form, as they continued from here with a logical method to get to the final stage of 0.227 t 0.227 18500e - the proof. A very efficient way to do this was by rewriting as - x ( ) ( ) , which made their proof very clear 0.227 t 0.227 1500 18500e 1500 0.227 1500 - V - + - = - - d d V V 0.227 0.227 t t 4191.3e 4199.5e - - and easy to follow. Those using or were often = - = - d d t t unable to rearrange it in the desired form or made errors and wrote down the correct answer at the end, without clear steps in their working There were several alternative methods that were used by a minority of learners. Those who attempted to start with the given answer, separate the variables and then integrate rarely scored more than one mark. A common error was to omit the c + , but of those who included the they were often unable to rearrange to make V the subject or did not include a ,c + conclusion. Some learners rearranged the original equation to a form without the exponential and then used implicit differentiation. 1 1500 ln V - Another alternative method was to rearrange to get then proceed to find t = - k A d V before finding d 1 t V . Here the most common error was with the coefficient when = d t d d t d V 1500 ln V - trying to apply the chain rule to . These learners were still usually able to score A two marks if there were no other errors. Learners should note that the question asks for a limitation of the model so if there was ambiguity in their answer, it was assumed that the comment was referring to the model. A large proportion made sensible comments relating to the model's limitation, with the most common correct answers being a reference to the car’s value approaching but never going below £1500, or suggesting the model does not take into account any additional damage to the car, or that, according to the model, the value only decreases whereas it may also increase in value. Responses that did not score the mark included vague statements or those which misunderstood the mathematics, such as claiming the model suggested the car could have a negative value or saying damage would impact the value without any reference to the model. A number of responses did not gain the mark due to omitting units, e.g. stating “1500” instead of “£1500”. 16 17
Common mistakes
t = 0 gives A = 18500
12000 = 1500 + 18500e^(−2.5k) gives e^(−2.5k) = 21/37, k = 0.227 (working with logs shown)
must write the complete model V = 1500 + 18500e^(−0.227t)
misreads 1200 or 15000
June 2025 · Paper 1 · Q11(b)3 marks
Mark scheme (whole question; this part is marked with the orange bar)
Examiner's comment
However, a small number retrieved this mark in part (b) by correctly stating the equation at the beginning of their working. There were only a few examples of not using enough significant figures or incorrectly rounding the value of k. Misreads were fairly common on this question (usually 1200 instead of 12000 or 15000 instead of 1500) which often meant that learners were unable to proceed to a value of k as they ended up with an equation with no real solutions. In part (b), most were able to identify the need for differentiation. The execution of the method was well-attempted, although some struggled to make the necessary links for the final part of the solution. The intention was that the question would be answered in terms of A and k but many used their own model from part (a) which could also score all the marks. Nearly
Common mistakes
dV/dt = −kAe^(−kt) then substitute Ae^(−kt) = V − 1500 to get −k(V − 1500)
dV/dt must be seen
working backwards by separating variables rarely scored
June 2025 · Paper 1 · Q11(c)1 mark
Mark scheme (whole question; this part is marked with the orange bar)
Examiner's comment
This was a modelling question relating to the value of a car. Many correct answers were seen in the early parts, although learners often struggled to give a clear explanation in the final part.
Common mistakes
must refer to the model: value never falls below £1500 (units needed), only depends on age, does not allow for damage or mileage, value can only decrease
"the car cannot have a negative value" or vague comments score 0
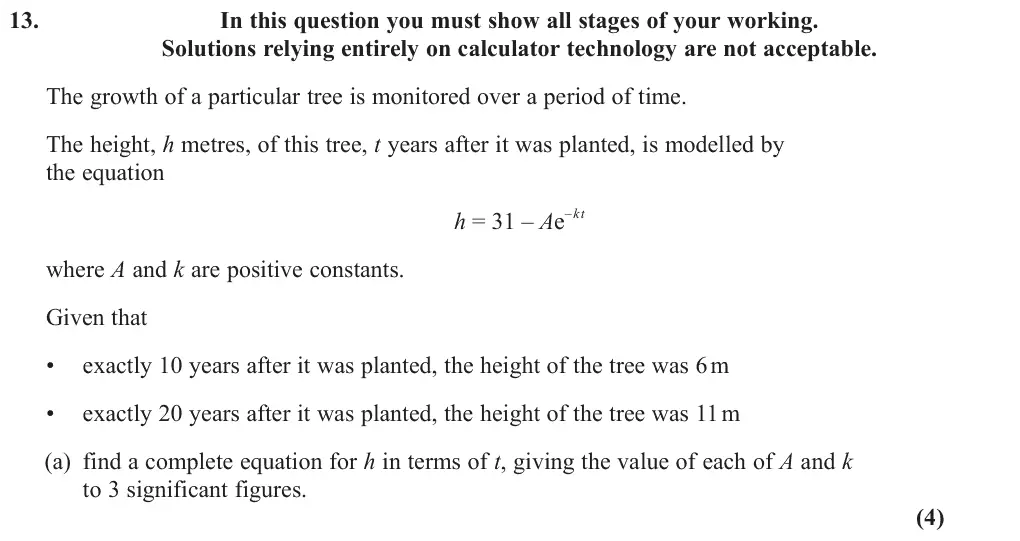
June 2025 · AS Paper 1 · Q13(a)4 marks
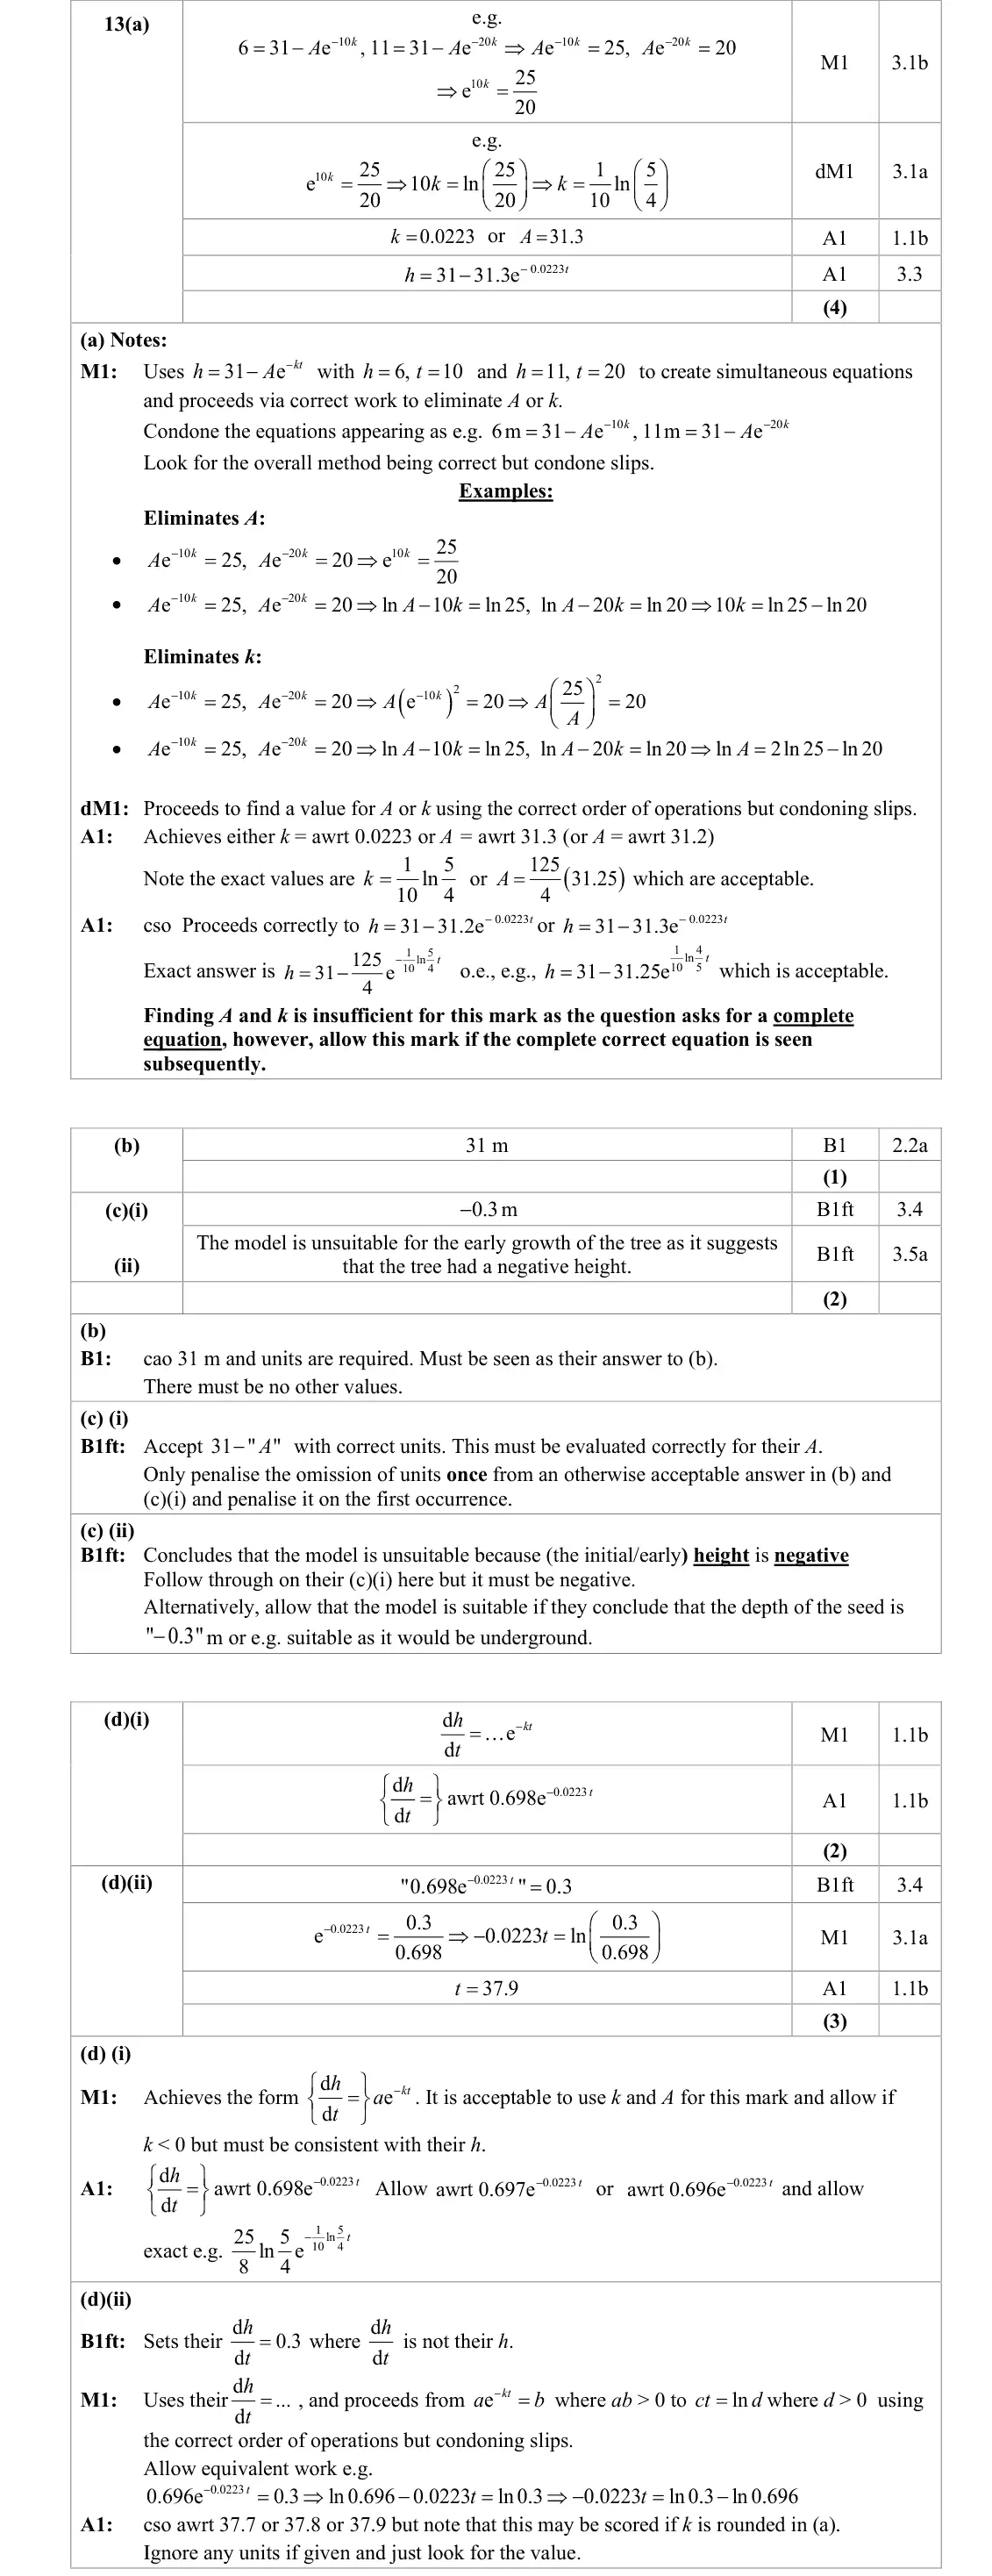
Mark scheme (whole question; this part is marked with the orange bar)
Examiner's comment
Candidates’ performances in this exponential modelling question were varied with some able to obtain full or nearly full marks, whilst others made very little progress. Candidates who did fail to score marks in (a) were often able to gain credit later in the question. Units were required in the answers to (b) and (c)(i), and the omission of these were penalised the first time it In part (a), candidates who had the necessary algebra skills successfully used the given equation and information to set up simultaneous equations in A and k and correctly solved them to reach 0.0223 31 31.3e t - h or a similar acceptable equation. Candidates often, however, made major = - algebraic mistakes after initially setting up the correct equations, often involving the use of incorrect log or indices work, and made no progress in (a). Others failed to appreciate that the question was asking for an exponential model and attempted to use the given information to set up a linear model instead. A number of candidates failed to write down the complete equation of the model and just gave the values of A and k, losing the final mark in (a). Many candidates realised that in (b) the required limit to the height of the tree was 31m,
Common mistakes
form Ae^(−10k) = 25 and Ae^(−20k) = 20 and divide: e^(10k) = 5/4, k = 0.0223, A = 31.3
log or index errors
must give the complete equation h = 31 − 31.3e^(−0.0223t)
June 2025 · AS Paper 1 · Q13(b)1 mark
Mark scheme (whole question; this part is marked with the orange bar)
Examiner's comment
Candidates’ performances in this exponential modelling question were varied with some able to obtain full or nearly full marks, whilst others made very little progress. Candidates who did Many candidates realised that in (b) the required limit to the height of the tree was 31m, although many omitted the units losing the mark. For some candidates this was the only mark scored in this question.
Common mistakes
as t → ∞, e^(−kt) → 0 so h → 31 m (units required)
June 2025 · AS Paper 1 · Q13(c)2 marks
Mark scheme (whole question; this part is marked with the orange bar)
Examiner's comment
Candidates’ performances in this exponential modelling question were varied with some able to obtain full or nearly full marks, whilst others made very little progress. Candidates who did in the answers to (b) and (c)(i), and the omission of these were penalised the first time it happened in an otherwise correct answer. In this way, marks were frequently withheld for missing units. In (c)(i) many candidates were able to use their equation for the model, even if it was incorrect, to find a value for the initial height of the tree. Again, missing units were common. In (c)(ii) explanations were allowed to follow through on the answer to (c)(i) provided that answer was negative. Acceptable explanations were often given either stating that the model was not suitable as the initial height of the tree could not be negative, or that the model was suitable because the tree had been planted below ground level.
Common mistakes
t = 0 gives h = 31 − A = −0.3 m (units)
model unsuitable as a height cannot be negative (or suitable if the seed is planted 0.3 m deep)
June 2025 · AS Paper 1 · Q13(d)(ii)3 marks
Mark scheme (whole question; this part is marked with the orange bar)
Examiner's comment
Candidates’ performances in this exponential modelling question were varied with some able to obtain full or nearly full marks, whilst others made very little progress. Candidates who did aften awarded to candidates who made little progress elsewhere in this question. In (d)(ii) candidates knew they needed to set their d h t equal to 30cm, but often confused the units and d used d rather than d . Having set up an equation using d h h h t candidates were often 30 0.3 t = t = d d d able to use appropriate log rules to progress from a suitable equation to obtain a value for t. The final correct answer of 37.9 was obtained by some, but errors often appeared during the course of this long question, causing the final answer to be incorrect.
Common mistakes
30 cm per year = 0.3 m per year (not 30)
set dh/dt = 0.3, not h = 0.3
take ln: t ≈ 37.9
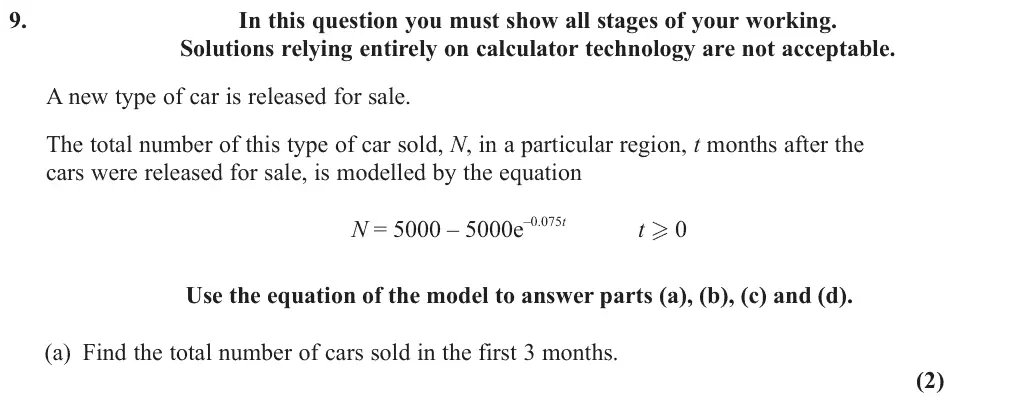
June 2025 · Paper 2 · Q9(a)2 marks
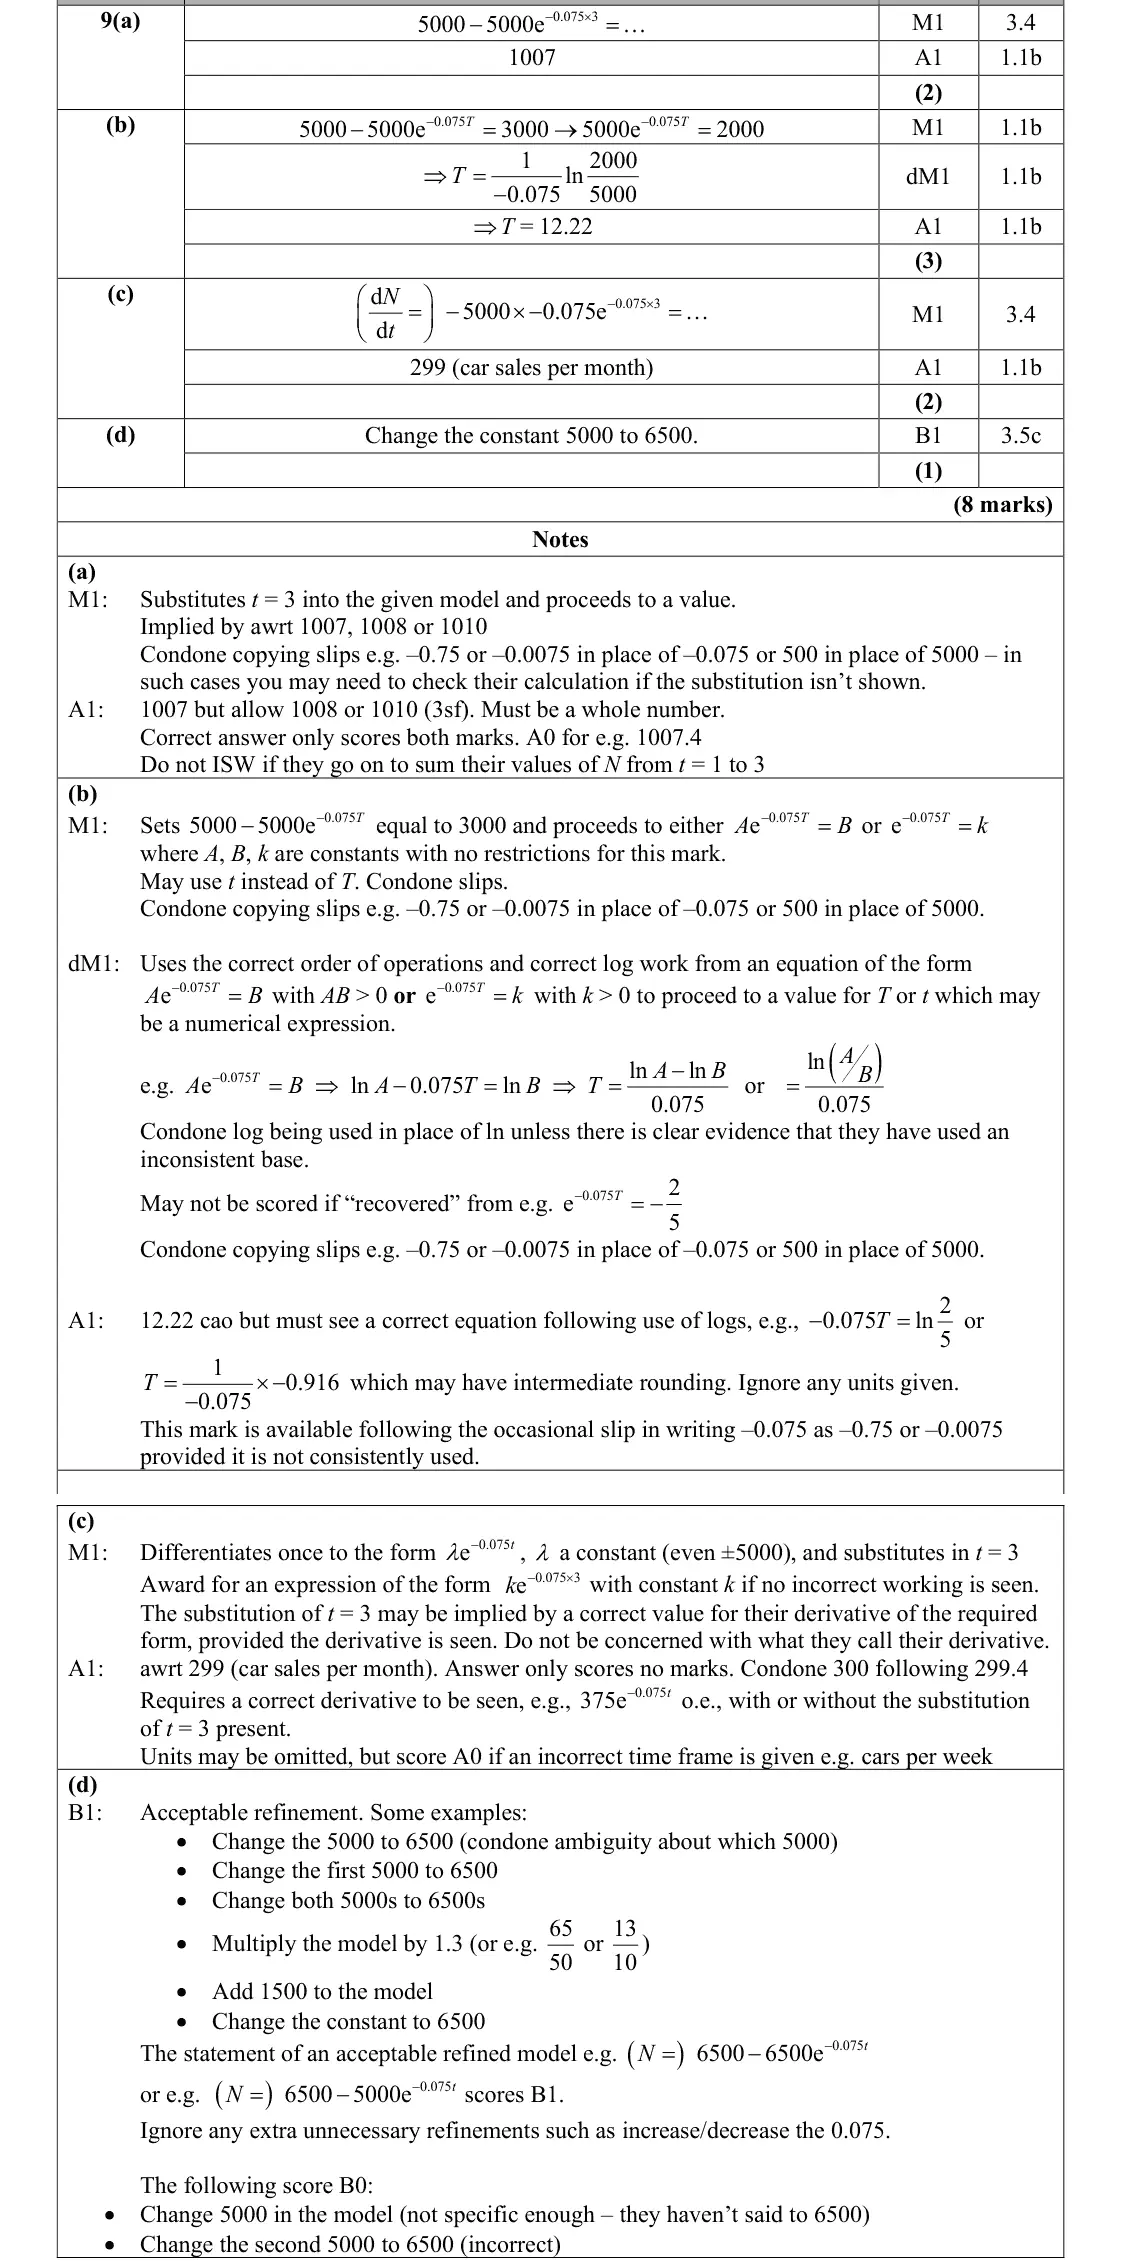
Mark scheme (whole question; this part is marked with the orange bar)
Examiner's comment
This question assessed understanding of exponential modelling and differentiation. Performance across the question was generally very good, but common errors in dealing with exponential equations and differentiating exponential models persist. In part (a), learners were required to substitute t = 3 into the given model for N. Many were successful in this part. Some responses gave the answer as an unrounded decimal and scored A0, while others appeared to misunderstand the “total number of this type of car sold” and found the sum of the values of N for t = 1, 2 and 3, scoring M1A0.
Common mistakes
substitute t = 3 (total sold, do not add values for t = 1, 2, 3)
whole number 1007
June 2025 · Paper 2 · Q9(b)3 marks
Mark scheme (whole question; this part is marked with the orange bar)
Examiner's comment
This question assessed understanding of exponential modelling and differentiation. Performance across the question was generally very good, but common errors in dealing with exponential equations and differentiating exponential models persist. Part (b) required setting N = 2000, rearrangement of the resulting equation using rules of logarithms correctly to achieve a value of T. The question required sufficient working to be shown and had the warning that solutions should not rely entirely on calculator technology. While most solutions showed intermediate working leading to the correct answer of T = 12.22, there were attempts where the equation was immediately followed by a solution. This was not sufficient and could only achieve a maximum of one mark out of three. Errors seen included taking logarithms to different bases on each side, rounding the final answer incorrectly and seeing logarithms of negative numbers due to an earlier error.
Common mistakes
5000e^(−0.075T) = 2000 then take ln correctly (same base both sides)
show the log step, not just the answer
T = 12.22
June 2025 · Paper 2 · Q9(c)2 marks
Mark scheme (whole question; this part is marked with the orange bar)
Examiner's comment
This question assessed understanding of exponential modelling and differentiation. Performance across the question was generally very good, but common errors in dealing with exponential equations and differentiating exponential models persist. Part (c) was the least well answered part of the question with learners often not realising that differentiation was required to find the rate of increase. Finding two values of N using the gradient of a straight-line formula was seen. Another common error was to substitute t = 3 first and then try to differentiate which gained no credit. The final answer did not require units to be given but occasionally incorrect time periods were referred to, thus changing the rate, which scored A0.
Common mistakes
rate of increase needs dN/dt = 375e^(−0.075t), not the gradient of a chord
do not substitute t = 3 before differentiating
299 cars per month (wrong time unit loses the A mark)
June 2025 · Paper 2 · Q9(d)1 mark
Mark scheme (whole question; this part is marked with the orange bar)
Examiner's comment
This question assessed understanding of exponential modelling and differentiation. Performance across the question was generally very good, but common errors in dealing with exponential equations and differentiating exponential models persist. In part (d), reference to changing the constant of 5000 to 6500 was the most straightforward answer. Some learners misunderstood what was being asked and instead commented on the limiting behaviour of the original model and/or deduced the model to be unsuitable if the limit was required to be 6500, rather than refining the model with this limiting behaviour.
Common mistakes
change the (first) 5000 to 6500
changing only the second 5000 is wrong
commenting on the limit of the old model is not a refinement
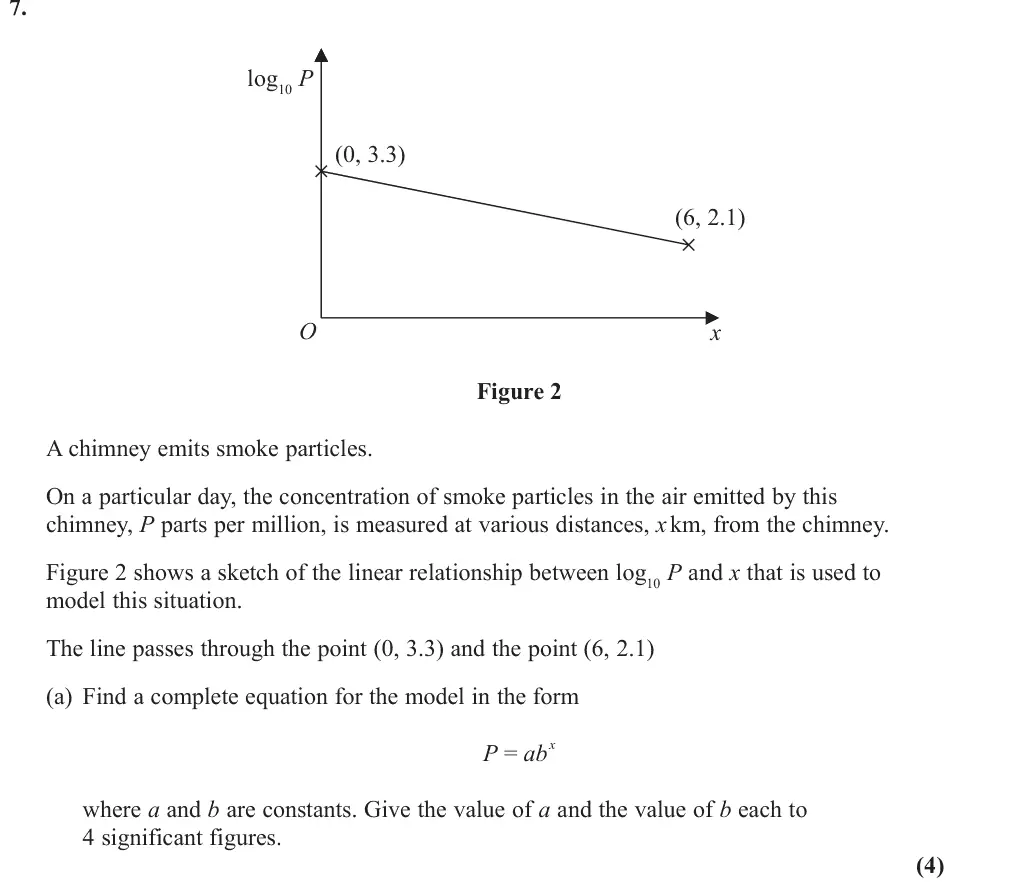
June 2024 · AS Paper 1 · Q7(a)4 marks
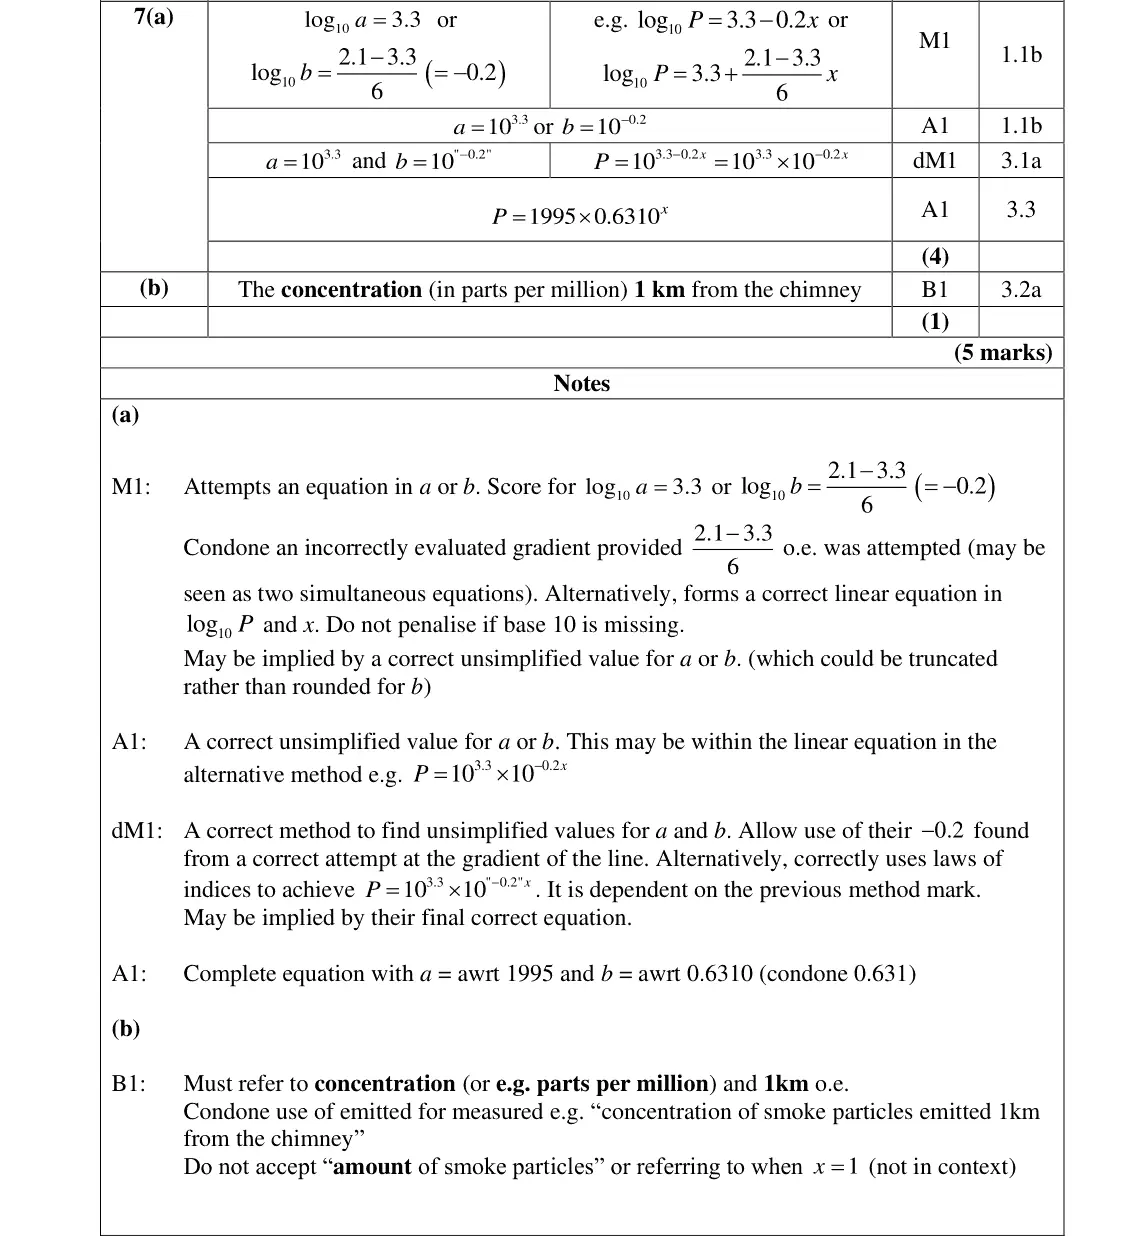
Mark scheme (whole question; this part is marked with the orange bar)
Examiner's comment
This question tested the understanding of logarithmic graphs and exponential growth. This was successful in differentiating between candidates, although surprisingly
Common mistakes
log₁₀P = 3.3 − 0.2x so a = 10^3.3 ≈ 1995 and b = 10^(−0.2) ≈ 0.6310 (4 s.f.)
gradient slips
using 3.3 instead of 10^3.3 for a
writing y for log₁₀P
June 2024 · Paper 1 · Q7(a)3 marks
Mark scheme (whole question; this part is marked with the orange bar)
Examiner's comment
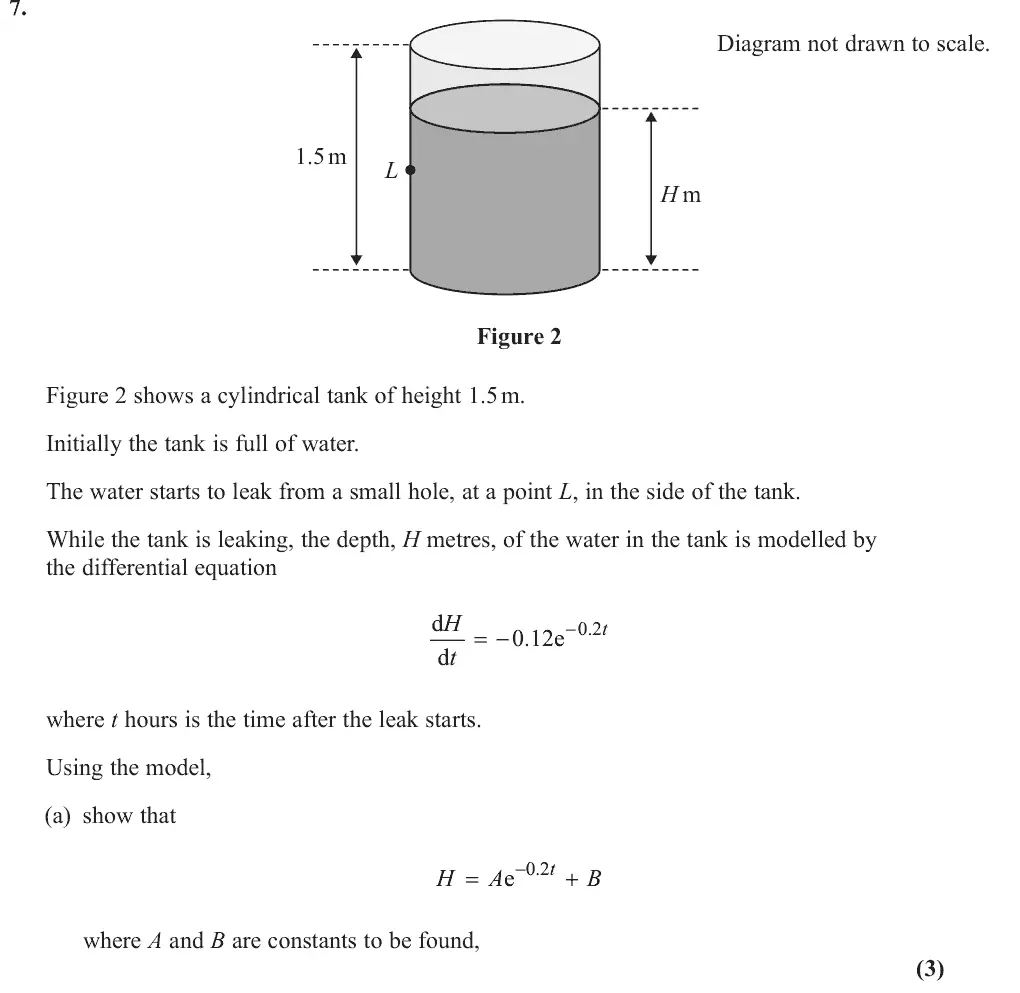
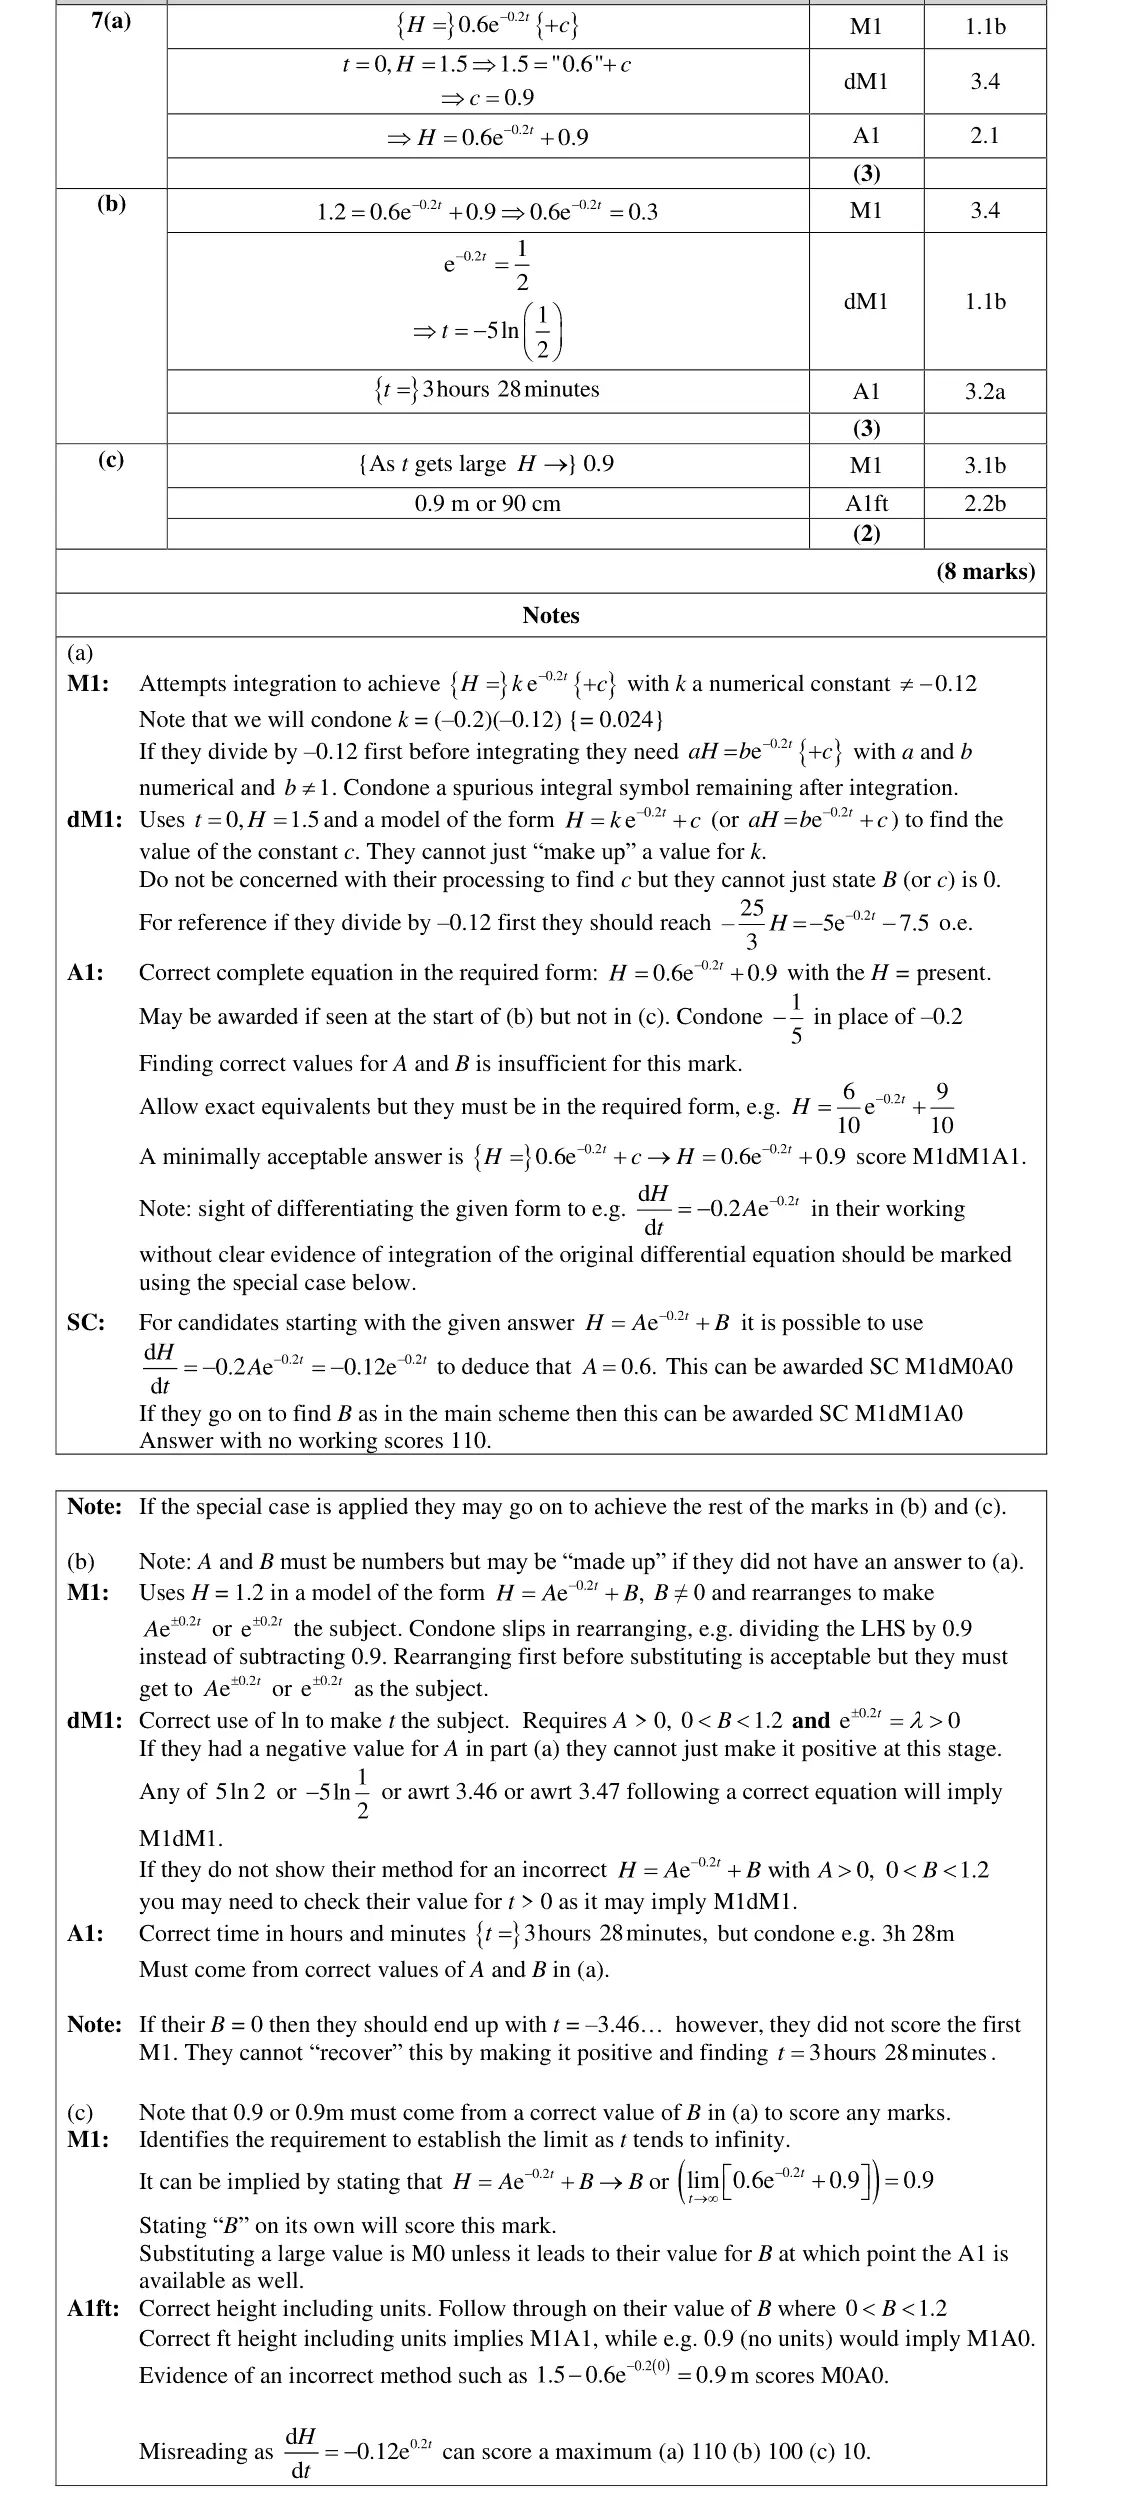
part (a) to do so. In part (a), most candidates recognised the need to integrate the expression and were able to integrate an exponential function; various methods were seen here but the majority followed the main approach in the mark scheme. A significant minority of candidates multiplied by –0.2 instead of dividing, resulting in an incorrect model and marks being lost in (b) and (c) due to having an impossible equation to solve. The vast Candidates who had a correct answer in part (a) generally performed well in part (b), with the majority able to rearrange the equation and use logarithms correctly to find the value of t. If these candidates were not awarded full marks, it was often because they were unable to convert their decimal into hours and minutes correctly, and therefore lost the final accuracy mark. Candidates who did not have a correct answer to part (a) A 0.2 t e generally gained the first method mark for making the subject of the equation, but many were not able to achieve the second method mark due to the context of the model. Candidates with B > 1.2 reached the logarithm of a negative value which should have provided an indication that there must have been an earlier error in need of addressing but few re-traced their workings and tended to use incorrect methods to create a positive answer. Part (c) was generally less well attempted than parts (a) and (b) with some candidates failing to understand what the question was asking them to do. The most common error was for candidates to attempt to solve d H t = . A surprising proportion of candidates 0 d gave answers higher than the maximum height. For candidates with successful approaches, marks were frequently lost by forgetting units and therefore not satisfying the demand of the question and finding the height of the hole. Similarly, many decided to subtract an often correct 0.9 from the maximum height, which indicated a misunderstanding of the model.
Common mistakes
integrate −0.12e^(−0.2t) to 0.6e^(−0.2t) + c (divide by −0.2, not multiply)
use t = 0, H = 1.5 to get c = 0.9 (not c = 1.5)
give the complete equation with H =
June 2024 · AS Paper 1 · Q7(b)1 mark
Mark scheme (whole question; this part is marked with the orange bar)
Examiner's comment
This question tested the understanding of logarithmic graphs and exponential growth. This was successful in differentiating between candidates, although surprisingly candidates still struggle with this relationship. In addition, part (b) provided challenging for most who were unable to interpret in context. = x P ab Many candidates lacked confidence in relating the exponential form of the model to the log P against x. Whilst some very poor log work was seen, some straight-line graph of 10 candidates also made fundamental errors whilst forming the equation of a straight line, for - 6 0 = - 5 example, an incorrect method for calculating the gradient, e.g. - 2.1 3.3 log P when writing down the equation of the straight line. Many candidates used y instead of 10 log 3.3 within their Some candidates appeared confused as to whether they should use 3.3 or 10 equation, whilst others also showed a lack of robust understanding in manipulating indices after achieving a correct equation for P. A significant minority of candidates who achieved the correct values for both a and b failed to then write down the complete equation required. In part (b), the vast majority of candidates were unable to correctly explain the meaning of “ab”. ab = = 1005 0.6310 1259 Some thought that they simply had to calculate its value i.e . Many others assumed they needed to give the meanings of each of a and b separately, as on previous papers.
Common mistakes
ab is the concentration (parts per million) 1 km from the chimney
"amount of smoke" or "when x = 1" is not in context
June 2024 · Paper 1 · Q7(b)3 marks
Mark scheme (whole question; this part is marked with the orange bar)
Examiner's comment
marks being lost in (b) and (c) due to having an impossible equation to solve. The vast majority of candidates remembered to include the constant of integration and use the given information to find it, likely supported by the question giving the required form of the answer as a reminder. Occasionally candidates missed out on the second method mark as they used 1.5 as the constant of integration rather than finding the constant of integration by correctly substituting H = 1.5 and t = 0, but the majority managed this with success, obtaining correct values for their constant and gaining the second method mark. A common reason for the loss of the final accuracy mark was failing to write out the final version of the model, generally omitting H = , or simply stating the values of A and B. Some candidates opted to differentiate the given answer and compare coefficients to find the values of A before going on to find B in the usual way. This verification strategy was not in line with the requirement of the question but candidates that used this method were allowed to score all but the final mark. Candidates who had a correct answer in part (a) generally performed well in part (b), with the majority able to rearrange the equation and use logarithms correctly to find the value of t. If these candidates were not awarded full marks, it was often because they were unable to convert their decimal into hours and minutes correctly, and therefore lost the final accuracy mark. Candidates who did not have a correct answer to part (a) Part (c) was generally less well attempted than parts (a) and (b) with some candidates failing to understand what the question was asking them to do. The most common error was for candidates to attempt to solve d H t = . A surprising proportion of candidates 0 d gave answers higher than the maximum height. For candidates with successful approaches, marks were frequently lost by forgetting units and therefore not satisfying the demand of the question and finding the height of the hole. Similarly, many decided to subtract an often correct 0.9 from the maximum height, which indicated a misunderstanding of the model.
Common mistakes
0.6e^(−0.2t) = 0.3 so t = 5 ln 2 = 3.47 h
convert to 3 hours 28 minutes (conversion errors common)
June 2024 · Paper 1 · Q7(c)2 marks
Mark scheme (whole question; this part is marked with the orange bar)
Examiner's comment
marks being lost in (b) and (c) due to having an impossible equation to solve. The vast majority of candidates remembered to include the constant of integration and use the given information to find it, likely supported by the question giving the required form of the answer as a reminder. Occasionally candidates missed out on the second method mark as they used 1.5 as the constant of integration rather than finding the constant of integration by correctly substituting H = 1.5 and t = 0, but the majority managed this with success, obtaining correct values for their constant and gaining the second method mark. A common reason for the loss of the final accuracy mark was failing to write out the final version of the model, generally omitting H = , or simply stating the values of A and B. Some candidates opted to differentiate the given answer and compare coefficients to find the values of A before going on to find B in the usual way. This verification strategy was not in line with the requirement of the question but candidates that used this method were allowed to score all but the final mark. Candidates who had a correct answer in part (a) generally performed well in part (b), Part (c) was generally less well attempted than parts (a) and (b) with some candidates failing to understand what the question was asking them to do. The most common error was for candidates to attempt to solve d H t = . A surprising proportion of candidates 0 d gave answers higher than the maximum height. For candidates with successful approaches, marks were frequently lost by forgetting units and therefore not satisfying the demand of the question and finding the height of the hole. Similarly, many decided to subtract an often correct 0.9 from the maximum height, which indicated a misunderstanding of the model.
Common mistakes
as t → ∞, e^(−0.2t) → 0 so H → B = 0.9 m (units needed)
1.5 − 0.6 is a wrong method
substituting a large t scores M0
June 2024 · AS Paper 1 · Q11(a)2 marks
Mark scheme (whole question; this part is marked with the orange bar)
Examiner's comment
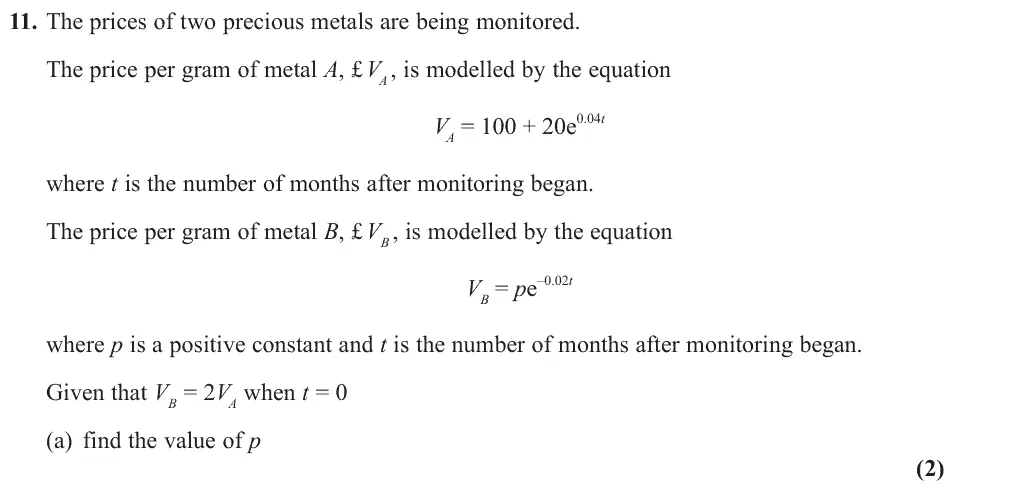
This question was a modelling one relating to the price per gram of two different metals. It enabled candidates to demonstrate understanding of working with exponential functions and differentiating them. In part (a), a significant proportion of candidates scored both marks, achieving the correct answer of 240. A few candidates halved instead of doubled and got 60 and a few left p as 120. A few made errors when evaluating 0 20e or 0 40e thinking this was equal to 1 (or making a careless slip).
Common mistakes
V_A at t = 0 is 100 + 20 = 120, so p = 240
halving (60) or leaving 120
e⁰ = 1
June 2024 · AS Paper 1 · Q11(b)4 marks
Mark scheme (whole question; this part is marked with the orange bar)
Examiner's comment
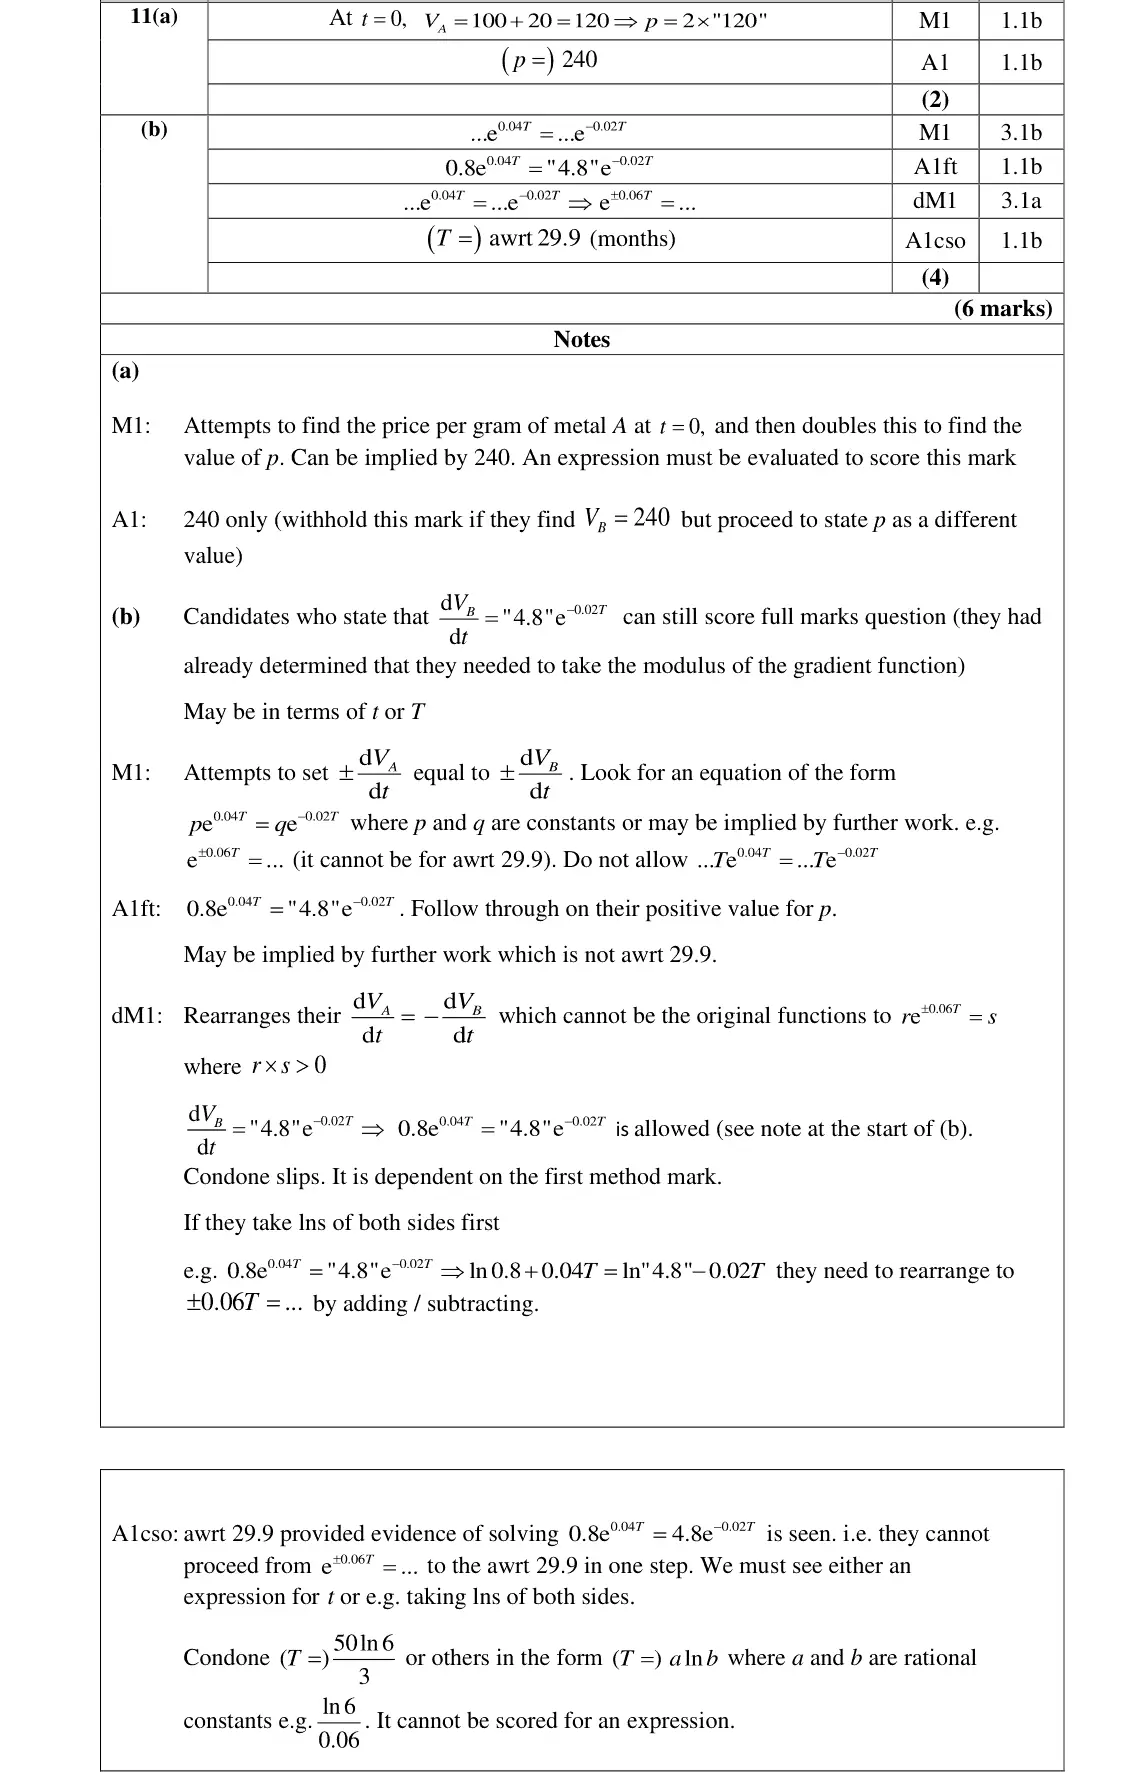
This question was a modelling one relating to the price per gram of two different metals. It enabled candidates to demonstrate understanding of working with exponential functions and differentiating them. Part (b) was generally poorly answered, and a number of candidates made no attempt to answer this part. A common error was to set A B V V = . For those that found d d A V t and d d B V t some did not put them equal to each other, or they set one or both equal to 0 instead, but the most common mistake was to keep the negative and write 0.04 0.02 0.8e 4.8e t t - = - thus forfeiting the last three marks. The minority who did set d d A V t d d B V t = - were usually able to use a correct method to solve the equation. Some candidates did appreciate the issue of trying to take logs of a negative was not possible, but rather than go back to the original equation, they opted to either ignore it or scribble out the negative at some point of the solution which was not acceptable to score these final marks.
Common mistakes
rate of increase of A equals rate of decrease of B: 0.8e^(0.04T) = 4.8e^(−0.02T) (drop the negative sign)
e^(0.06T) = 6 so T = 29.9 months
setting V_A = V_B or derivatives = 0
logs of a negative
June 2024 · Paper 2 · Q13(a)4 marks
Mark scheme (whole question; this part is marked with the orange bar)
Examiner's comment
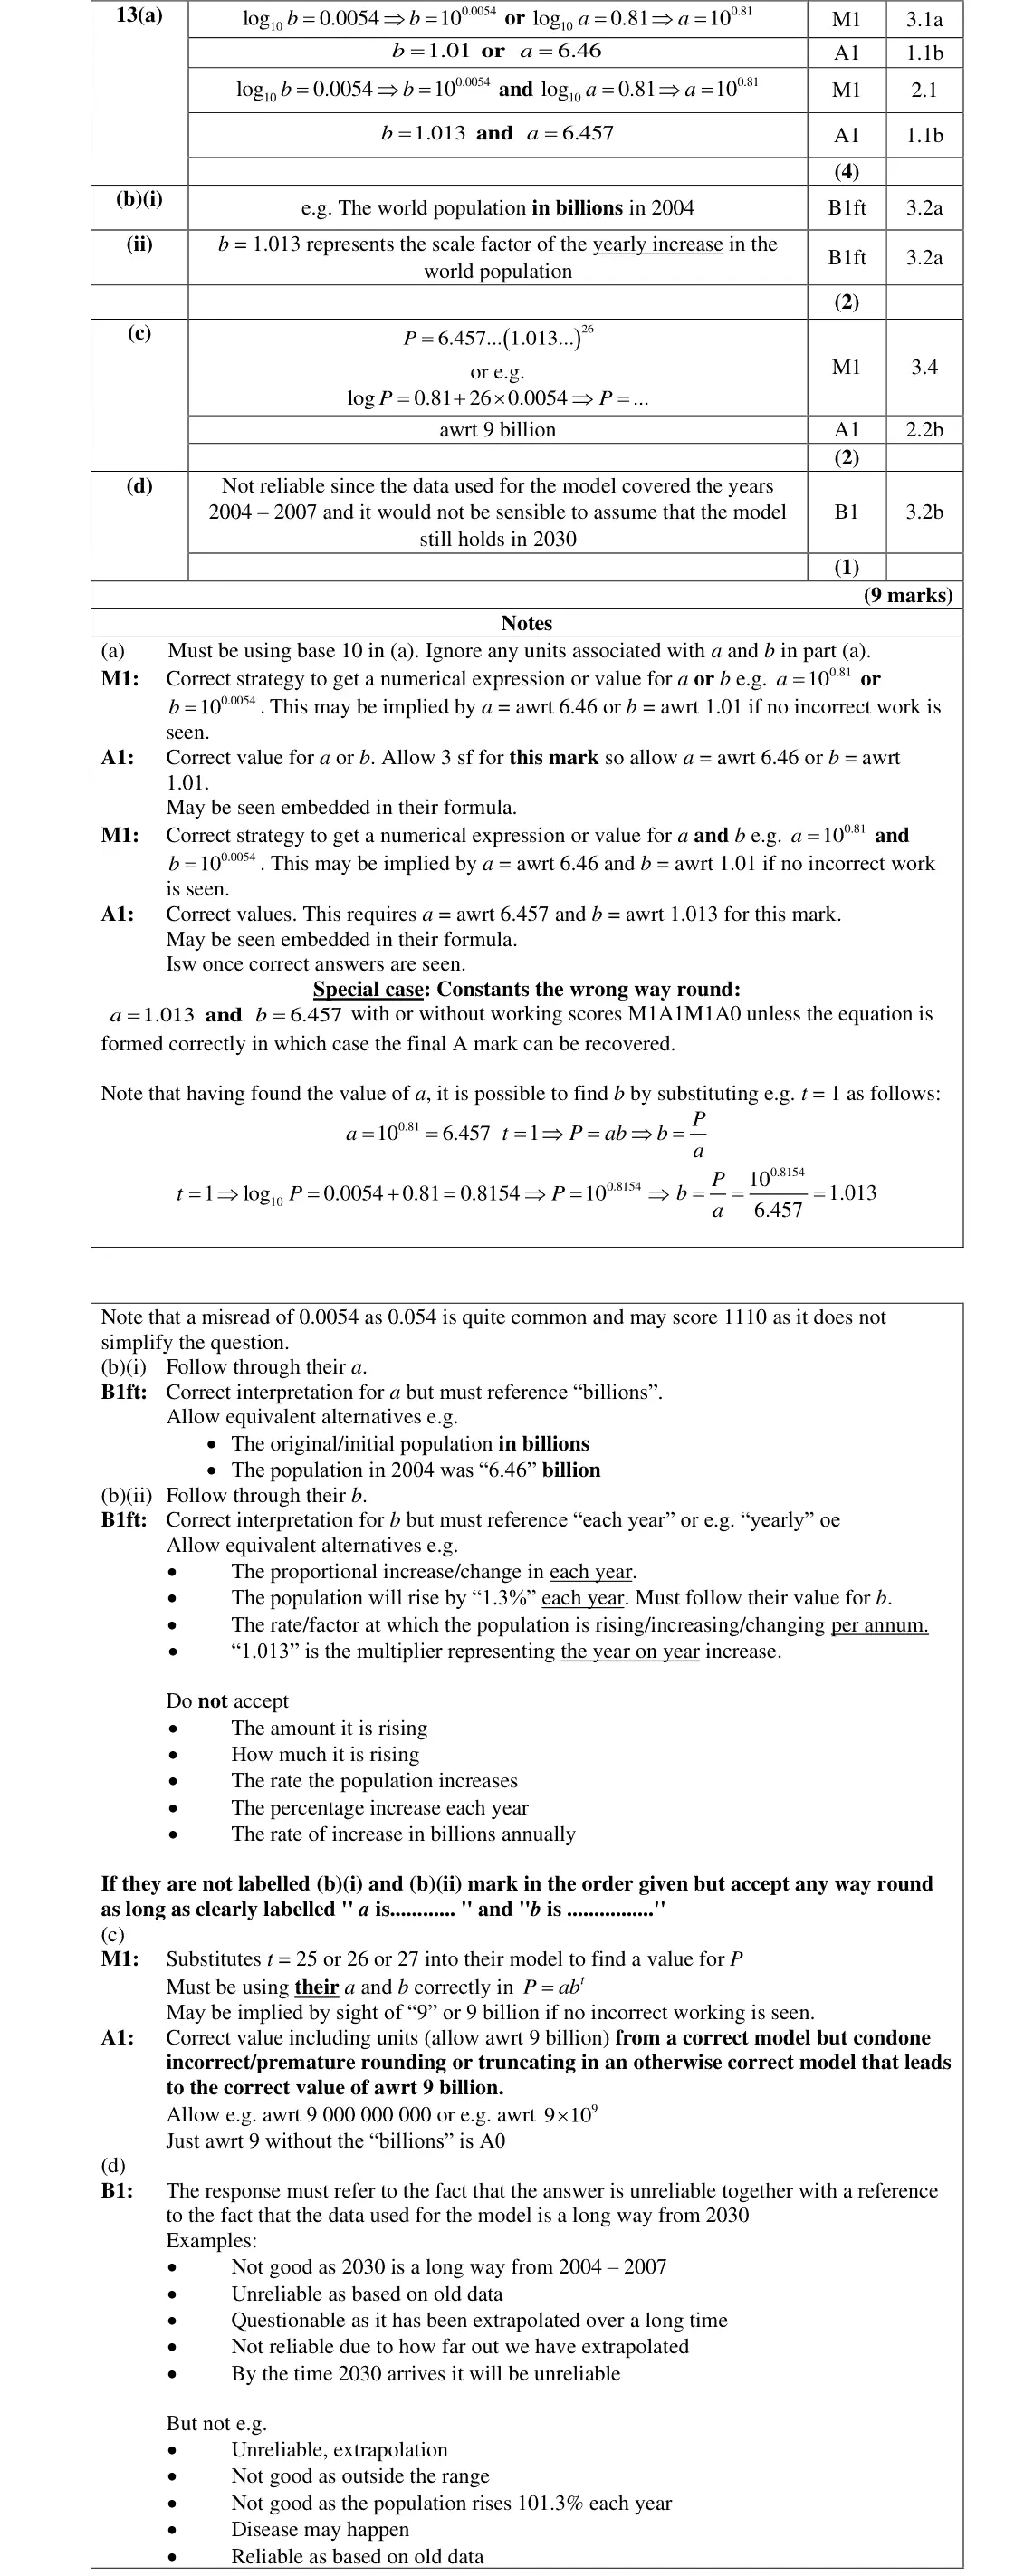
Part (a) was generally well answered with candidates commonly using the main method in the mark scheme, having made the link with y = mx + c and taking logarithms. Most candidates recognised log a = 0.81 and log b = 0.0054 with minimal preamble. When this was recognised it almost always led to correct answers. There were occasional errors with logs such as using base e instead of base 10. The misread of the 0.0054 as 0.054 was seen quite often. A common issue was candidates not reading the 3 decimal place requirement and instead writing things such as b = 1.0125 (awrt was applied so no marks were lost) or giving 3 significant figures. The method where values for t were used to obtain the values for a and b was sometimes used, but often candidates made limited progress towards obtaining an accurate answer.
Common mistakes
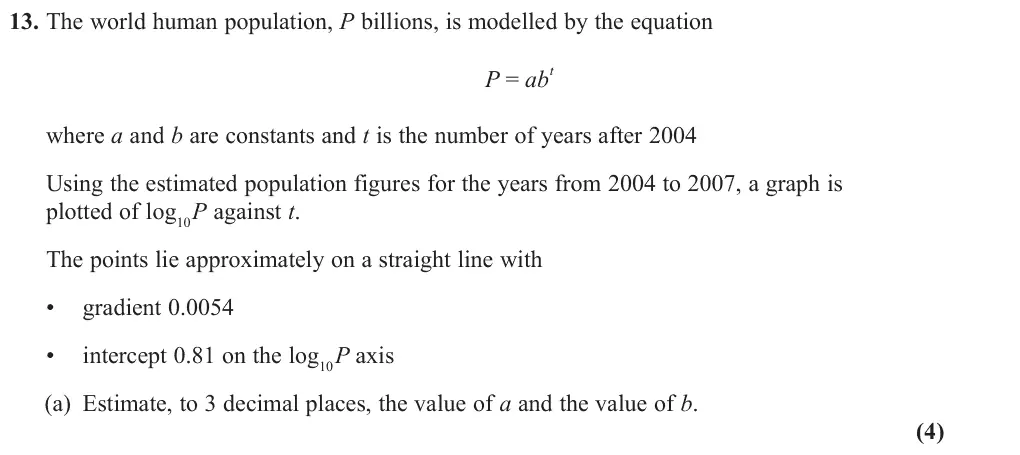
log P = log a + t log b so log₁₀a = 0.81, log₁₀b = 0.0054
a = 6.457, b = 1.013 (3 d.p., base 10 not e)
misreading 0.0054 as 0.054
June 2024 · Paper 2 · Q13(b)2 marks
Mark scheme (whole question; this part is marked with the orange bar)
Examiner's comment
For part (b)(i), most candidates understood that this was the initial population but the word billion was often omitted, showing a lack of full comprehension of the model. Part (b)(ii) was less well answered than (b)(i). The proportionality or rate was often recognised but “per year” was sometimes omitted. The wording of answers also cost candidates the mark as they often talked about the “amount” or “how much” the population went up by, or they wrote correct responses followed by it increases by “1.013 billion”.
Common mistakes
(i) a = world population in billions in 2004 ("billions" needed)
(ii) b = yearly scale factor (1.3% increase per year)
"how much it rises" or "1.013 billion" not accepted
June 2024 · Paper 2 · Q13(c)2 marks
Mark scheme (whole question; this part is marked with the orange bar)
Examiner's comment
Part (c) was generally well answered with the majority of candidates substituting t = 26 into their model and remembering to write billions (despite often having forgotten this in part b(i)). Occasionally candidates used t = 27 and more rarely 25. When candidates attempted to write their answer as the full form of the decimal, they often made errors in the number of digits.
Common mistakes
t = 26 (2030 − 2004), not 25 or 27
about 9 billion (units needed)
June 2024 · Paper 2 · Q13(d)1 mark
Mark scheme (whole question; this part is marked with the orange bar)
Examiner's comment
Part (d) was not well answered on the whole, and credit seemed to be rarely given. Many candidates focussed on an assumption that death/disease was not incorporated into the model. This showed poor understanding of modelling as the growth rate can factor things like this in when it is derived. Candidates who did make a link to extrapolation, were often unable to recognise that this was a prediction far into the future so the model may not be appropriate. Responses to this part often seemed to be rote answers that indicated a lack of understanding of the model.
Common mistakes
unreliable: extrapolating to 2030 from 2004–2007 data, a long way outside the data
"disease/deaths not included" or bare "extrapolation" not enough
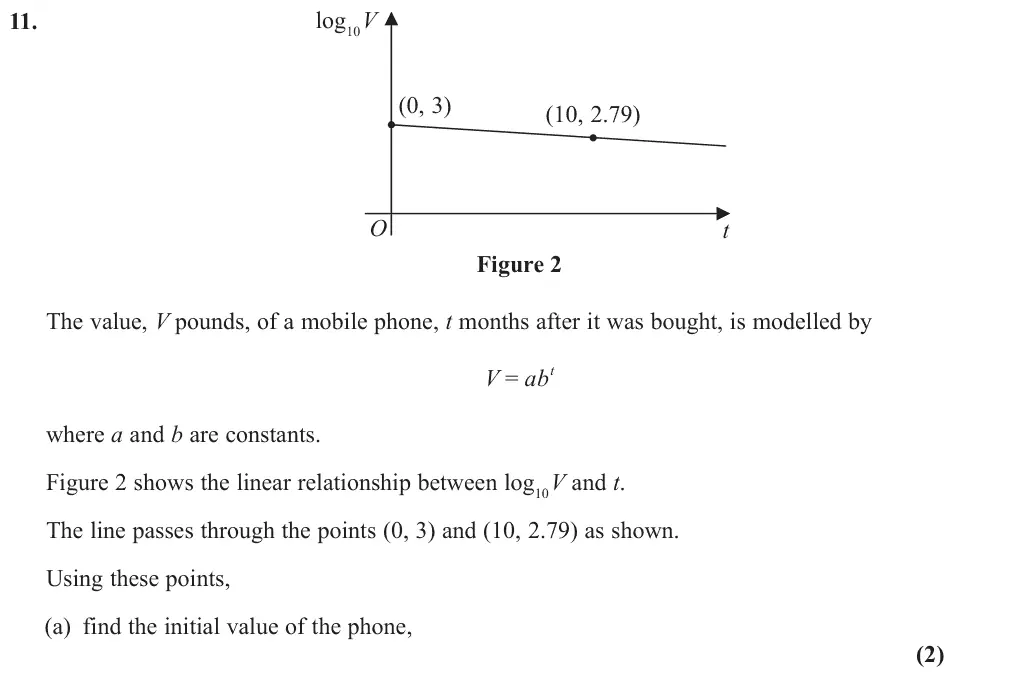
June 2023 · AS Paper 1 · Q11(a)2 marks
Mark scheme (whole question; this part is marked with the orange bar)
Examiner's comment
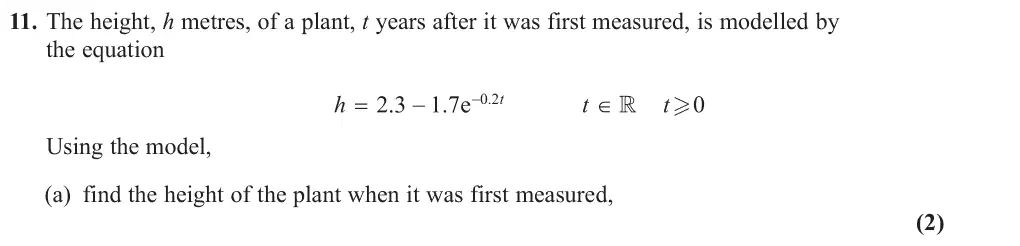
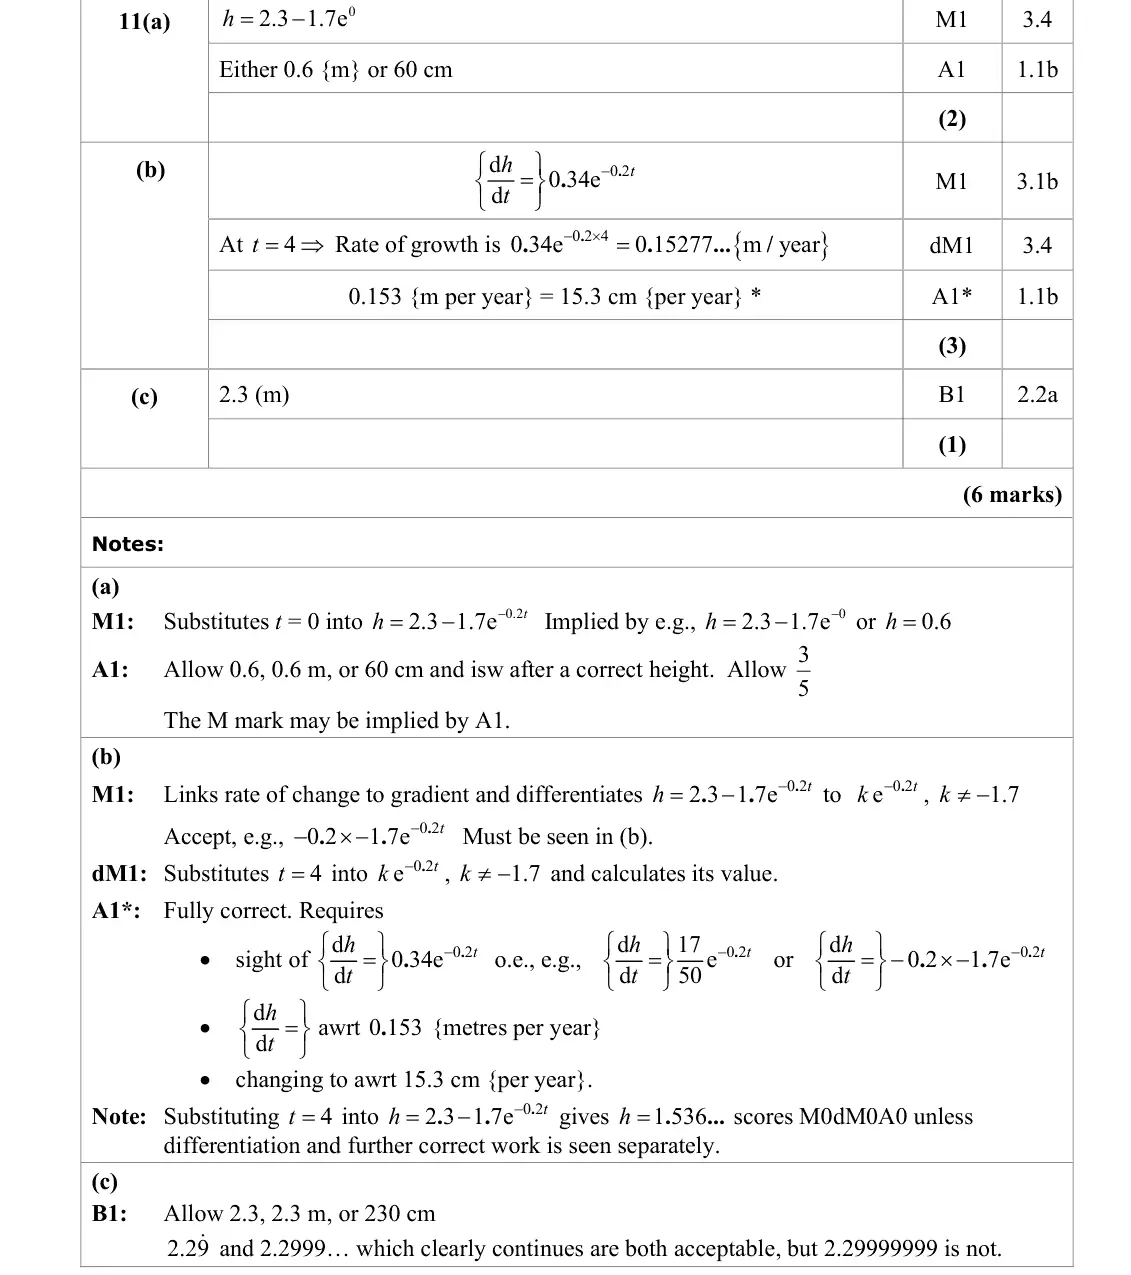
This question on exponential functions caused problems for the majority in part (b), as they failed to recognise that differentiation was required. However, generally parts (a) and (c) were answered well. In part (a), most candidates identified that they needed to substitute t = 0 into the given equation and successfully reached h = 0.6 metres, which was often seen as 60cm or 3 5 , both of which were allowed. A few failed to use e0 = 1 and as a result arrived at an incorrect answer.
Common mistakes
t = 0 and e⁰ = 1 gives h = 0.6 m (60 cm)
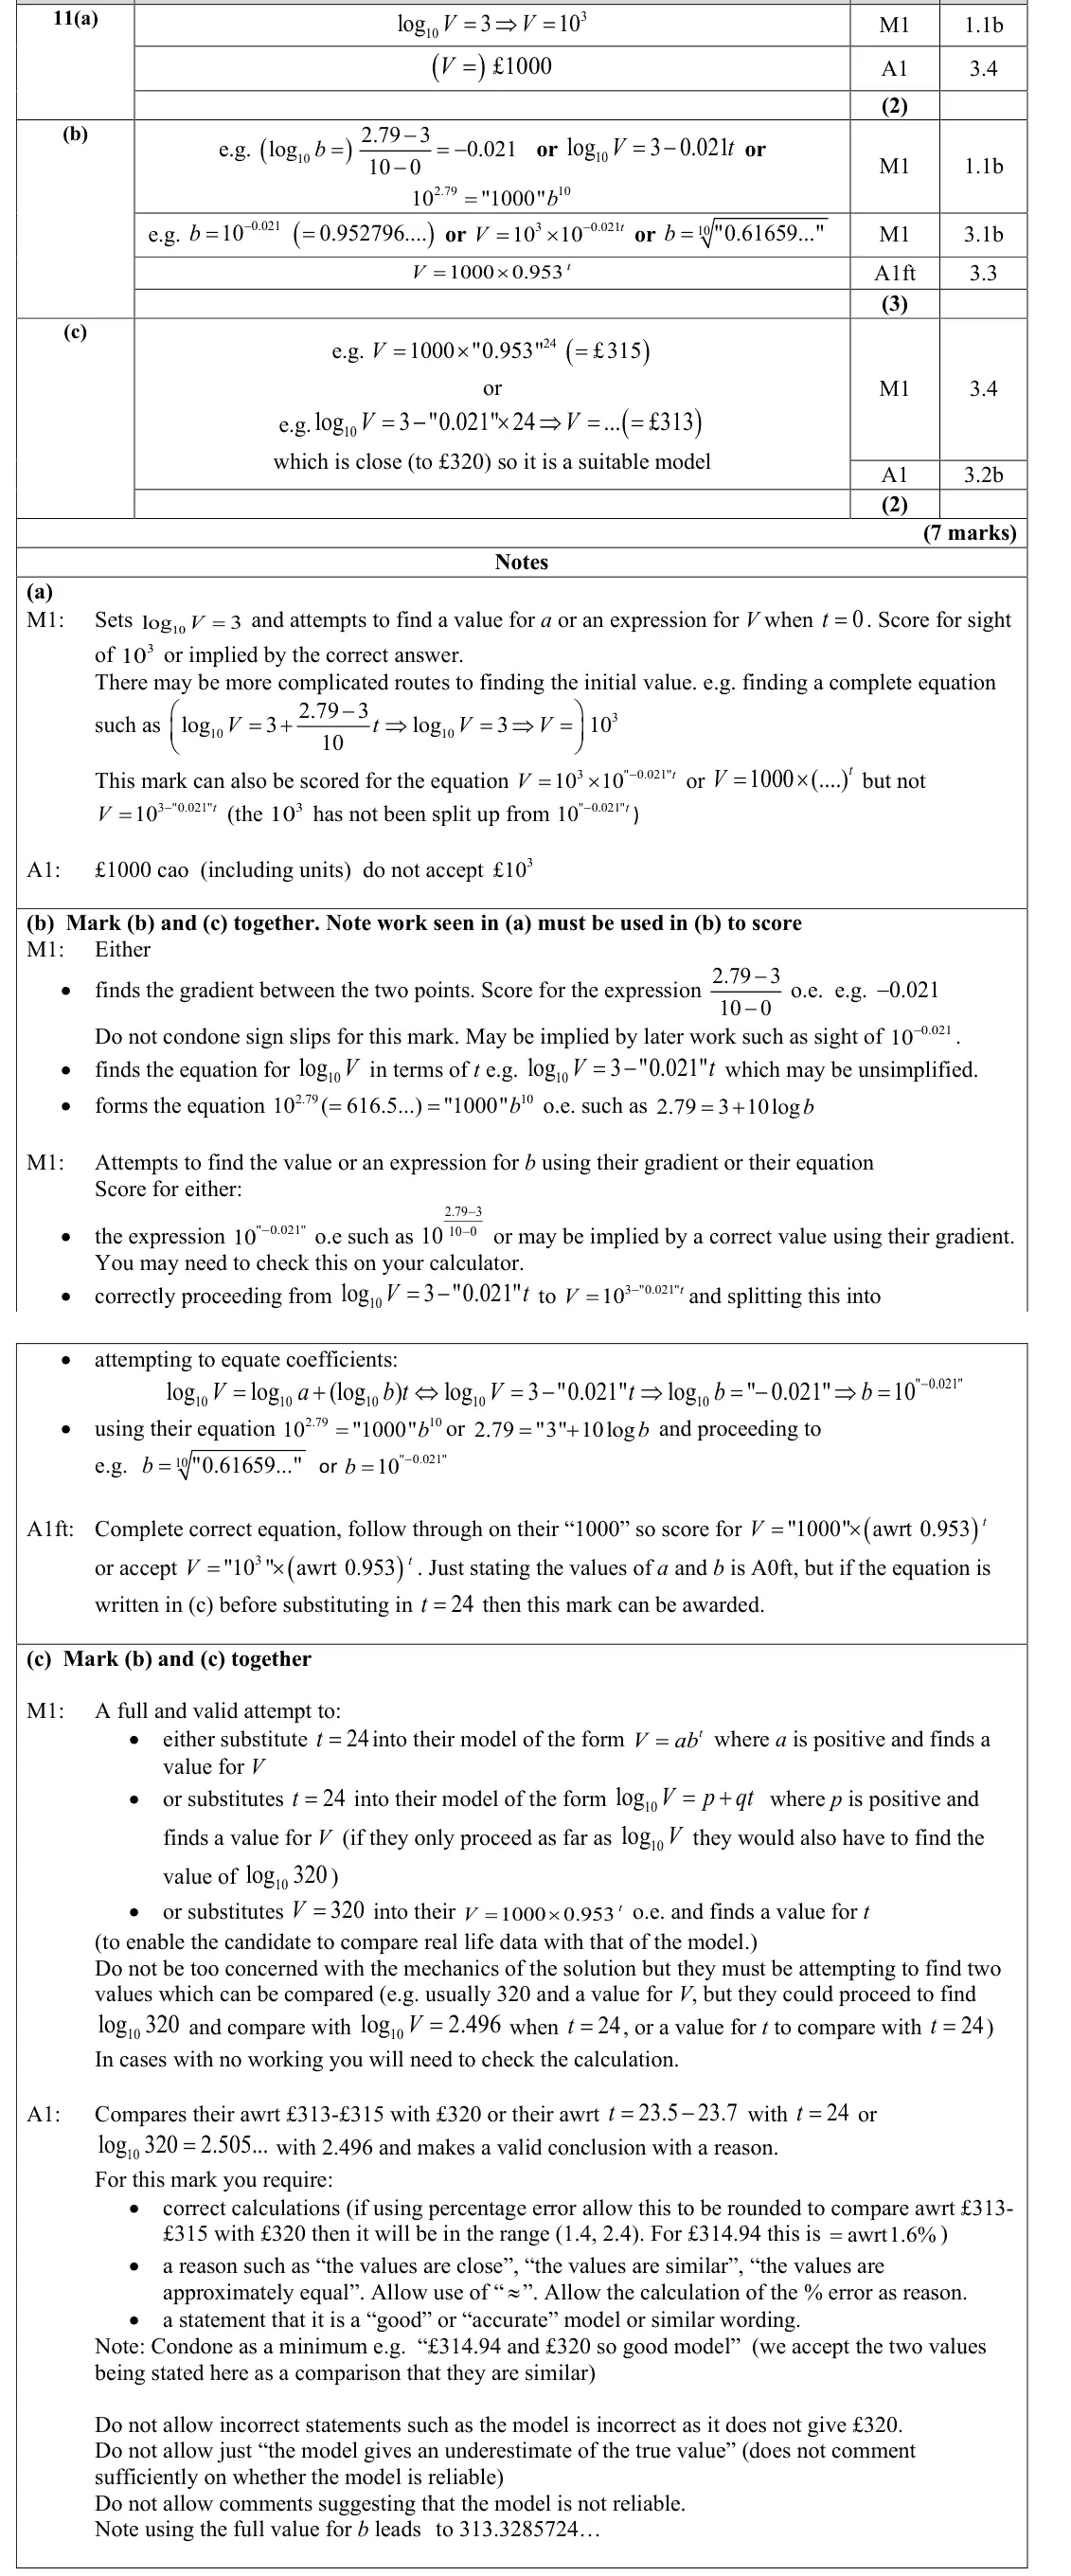
June 2023 · Paper 1 · Q11(a)2 marks
Mark scheme (whole question; this part is marked with the orange bar)
Examiner's comment
This question proved to be quite challenging for a number of candidates, however those who were able to manipulate logarithms using the rules correctly, along with calculating the gradient, were often very successful. It is worth noting that there were a number of candidates who did not pay attention to the labelling on the y-axis and therefore were unable to score any marks on this question. As with many modelling questions, candidates currently lack proficiency at relating the mathematics to the context of the question. In part (a), most candidates were able to find the initial value correctly, although several lost the accuracy mark by forgetting to include units. The location of the unit was condoned e.g. 1000£ was seen on many occasions. A common reason for candidates not achieving any marks was to assume 3 V = or 10 log 3 V = , instead of 10 log 3 V = . A few candidates used natural logs instead of 10 log , resulting in 3e V = instead of 3 10 V = . Some candidates just stated the initial value was 3, not fully appreciating what information the linear graph was representing.
Common mistakes
log₁₀V = 3 when t = 0, so V = 10³ = £1000 (units needed)
June 2023 · AS Paper 1 · Q11(b)3 marks
Mark scheme (whole question; this part is marked with the orange bar)
Examiner's comment
This question on exponential functions caused problems for the majority in part (b), as they failed to recognise that differentiation was required. However, generally parts (a) and (c) were answered well. In part (b), the majority of candidates failed to recognise that the 15.3 cm per year meant that they were required to differentiate to obtain a rate of change, and attempted instead to substitute t = 4 into the expression for h. This answer resembled 15.3 cm, so many incorrectly assumed that they had answered the question, even though the subsequent conversion from metres to cm made no sense. Some attempted to divide this value by 4, showing some appreciation for the units given in the question, but lacking an appreciation that the information given provided an instantaneous rate of change and not an average rate over the four years. Without an attempt at differentiation no marks could be scored in (b) but those candidates who did differentiate generally successfully answered this part of the question.
Common mistakes
rate of growth means dh/dt = 0.34e^(−0.2t), not h at t = 4 (1.536 m) or h/4
0.153 m per year = 15.3 cm per year
June 2023 · Paper 1 · Q11(b)3 marks
Mark scheme (whole question; this part is marked with the orange bar)
Examiner's comment
This question proved to be quite challenging for a number of candidates, however those who were able to manipulate logarithms using the rules correctly, along with calculating the gradient, were often very successful. It is worth noting that there were a number of candidates who did not pay attention to the labelling on the y-axis and therefore were unable to score any marks on this question. As with many modelling questions, candidates currently lack proficiency at relating the mathematics to the context of the question. Part (b) was discriminating, requiring some understanding of the relationship between t V ab = and the linear graph. Those candidates who were most successful with this part of the question, made the link between part (a) and the value of a without having to do additional calculations. Many candidates were able to find the gradient of the graph correctly and pick up the first method mark. However, finding a value for b was difficult for many candidates. Those candidates who did not make the link with part (a) often had to recalculate a or attempted to use simultaneous equations, often with little success. There were a lot of very convoluted incorrect solutions in this question which showed a poor grasp of logarithms and the associated rules; log t ab was commonly seen; others failed to correctly relate log log log V a t b = + to y mx c = + despite previous questions on the topic, confusing which were the variables and which were the constants. There were several cases of candidates mixing up the x, y coordinates in their substitution. It was encouraging to see that most candidates tried to give the full equation if they found values for a and b, but there was still a good number that did not and thus, lost the final mark. A few candidates were unable to score the final mark for leaving their answer as 10 log 3 0.021 V t = - . Candidates were able to gain the final mark of part (b), if the complete equation was seen in part (c), although this was rare to see.
Common mistakes
gradient −0.021 = log₁₀b, so b = 10^−0.021 ≈ 0.953
give the complete equation V = 1000 × 0.953ᵗ
June 2023 · AS Paper 1 · Q11(c)1 mark
Mark scheme (whole question; this part is marked with the orange bar)
Examiner's comment
This question on exponential functions caused problems for the majority in part (b), as they failed to recognise that differentiation was required. However, generally parts (a) and (c) were answered well. In part (c), most candidates identified that the limiting value was 2.3 m, although a number missed this part out, especially after a poor attempt at part (b).
Common mistakes
as t → ∞, e^(−0.2t) → 0 so the limit is 2.3 m
June 2023 · Paper 1 · Q11(c)2 marks
Mark scheme (whole question; this part is marked with the orange bar)
Examiner's comment
This question proved to be quite challenging for a number of candidates, however those who were able to manipulate logarithms using the rules correctly, along with calculating the gradient, were often very successful. It is worth noting that there were a number of candidates who did not pay attention to the labelling on the y-axis and therefore were unable to score any marks on this question. As with many modelling questions, candidates currently lack proficiency at relating the mathematics to the context of the question. In part (c), candidates who used 24 t = generally scored the method mark even if their model was incorrect but of the correct form. The most common form used was a continuation of their answer to part (b), usually t V ab = where a was positive. The majority of candidates were able to make a valid comparison accompanied by a sufficient explanation to earn the final accuracy mark. Some calculated the percentage error to justify their thinking which was acceptable. A minority thought the small difference was too great for the model to be reliable. A few candidates used the method of substituting 24 t = into an equation of the form 10 log V p qt = + to find a value for 10 log V . The discerning candidates either compared their 10 log V with 10 log 320 , or they proceeded to find V and compared this with 320. This method was slightly more complicated, and the success rate of this method was mixed. The units in this question caught a considerable number of candidates out, when checking the suitability of the model and substituting in 2 (years) rather than 24 (months), highlighting the importance of reading the question carefully. This led to a conclusion that the model was unreliable due to the vastly different amount that was yielded. Candidates did not consider the fact that this could mean that there was an error in their own calculation.
Common mistakes
t = 24 months (not 2)
compare about £315 with £320 and conclude the model is reliable
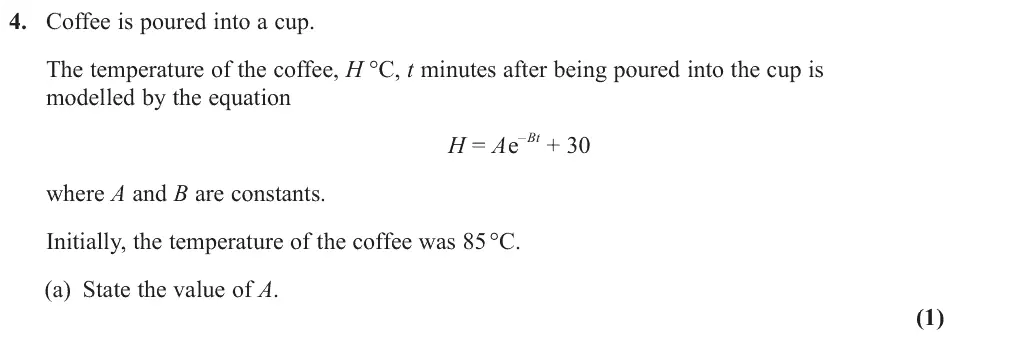
June 2023 · Paper 2 · Q4(a)1 mark
Mark scheme (whole question; this part is marked with the orange bar)
Examiner's comment
Those scoring full marks in this question were in a significant minority of candidates. In part (a) the majority of candidates used the given information to find the value of A. Those that did not achieve this mark typically gave 85 as an answer. A few students failed to recognise the standard technique of substituting t = 0 into the expression for H to find the value of A, often using t = 1. Sometimes e0 was evaluated as e or 0 rather than 1.
Common mistakes
t = 0: 85 = A + 30 so A = 55 (not 85)
e⁰ = 1
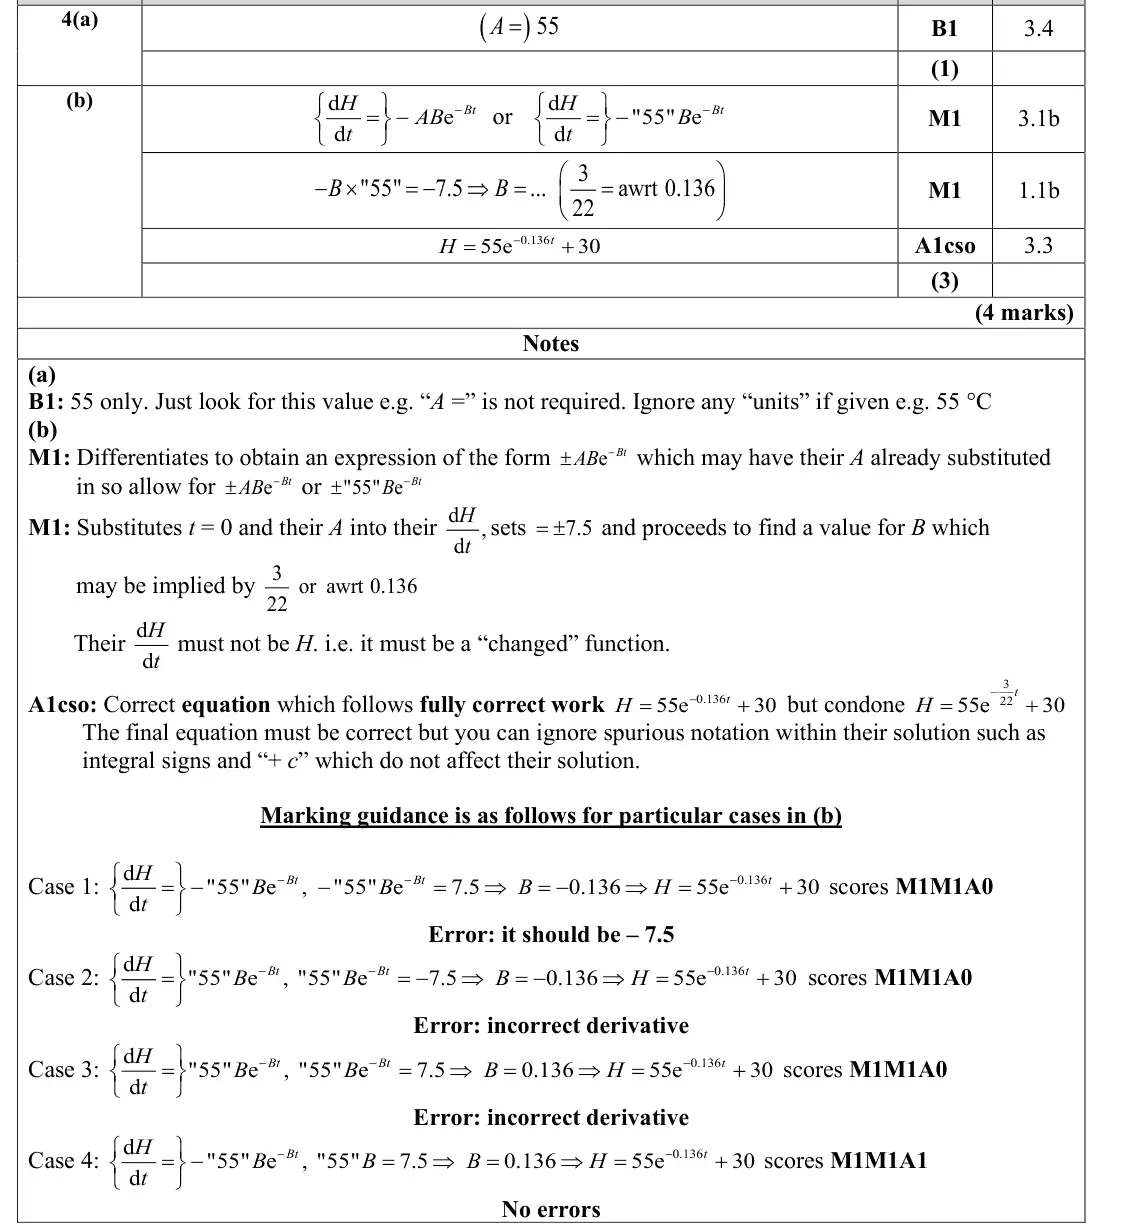
June 2023 · Paper 2 · Q4(b)3 marks
Mark scheme (whole question; this part is marked with the orange bar)
Examiner's comment
Those scoring full marks in this question were in a significant minority of candidates. Part (b) had mixed outcomes for candidates. Interpretation of the given initial rate of cooling was problematic for many candidates. There was a general lack of appreciation that the rate of cooling was a continuous variable which represented d . d H t - Those candidates not recognising this and using a difference method (similar to those introduced at GCSE) between t = 0 and t = 1 were restricted to the initial B mark in part (a). The most common attempt at a response for these candidates was setting H(1) = 85 - 7.5 and working from there. Of those who recognised the need to first find d d H t and then substitute t = 0, many incorrectly used d d H t = 7.5 rather than the correct d d H t = -7.5 to express a negative increase in temperature. This led to the loss of the last mark. Another error was to forget to differentiate the + 30 to zero leaving a constant in their d d H t , only scoring at most the second method mark for substituting t = 0 and their A into their d d H t . Some differentiated incorrectly to obtain -55Bte-Bt. Several students missed out on the final mark despite correct work by not writing out the final equation. It is important that centres make candidates aware that when a question asks for the complete equation for a model that it is given as such and not just the values of any required constants.
Common mistakes
rate of cooling is dH/dt = −55Be^(−Bt) = −7.5 at t = 0 (sign matters), B = 3/22 ≈ 0.136
give the complete equation H = 55e^(−0.136t) + 30
using H(1) = 85 − 7.5 (difference method) is wrong
derivative of +30 is 0
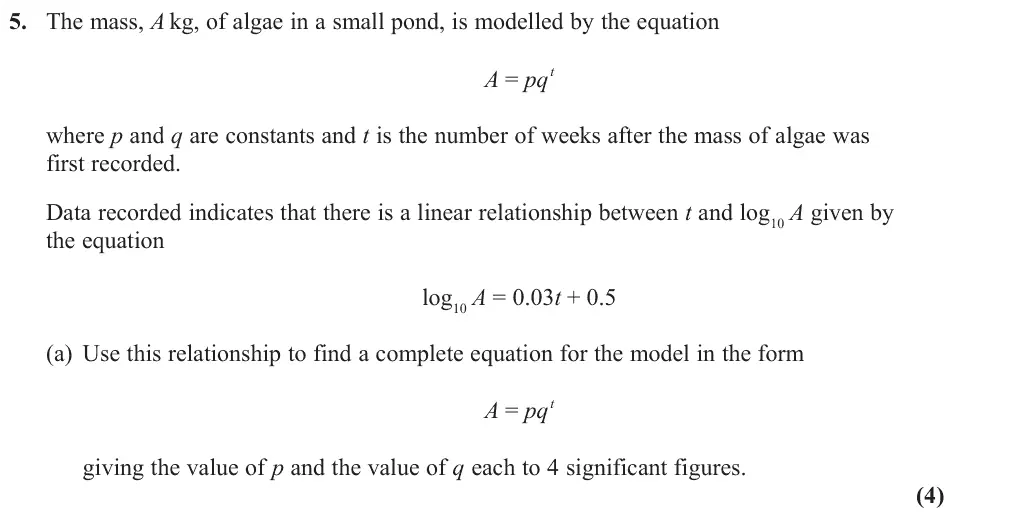
June 2022 · AS Paper 1 · Q5(a)4 marks
Mark scheme (whole question; this part is marked with the orange bar)
Examiner's comment
Generally, candidates found this question accessible with many scoring consistently throughout. In part (a), most candidates were able to make progress often correctly establishing the values of p and q following a valid method. A significant proportion of candidates, who correctly calculated the values of both p and q, failed to write down “a complete equation for the model” in the required form, and a small minority candidates failed to evaluate p and q to four decimal places. The need to carefully read the question’s requirements should be emphasised to candidates and whilst in a number of questions we will allow anything which rounds to that level of accuracy, the modelling questions in particular can sometimes require a specific level of rounding to score full marks.
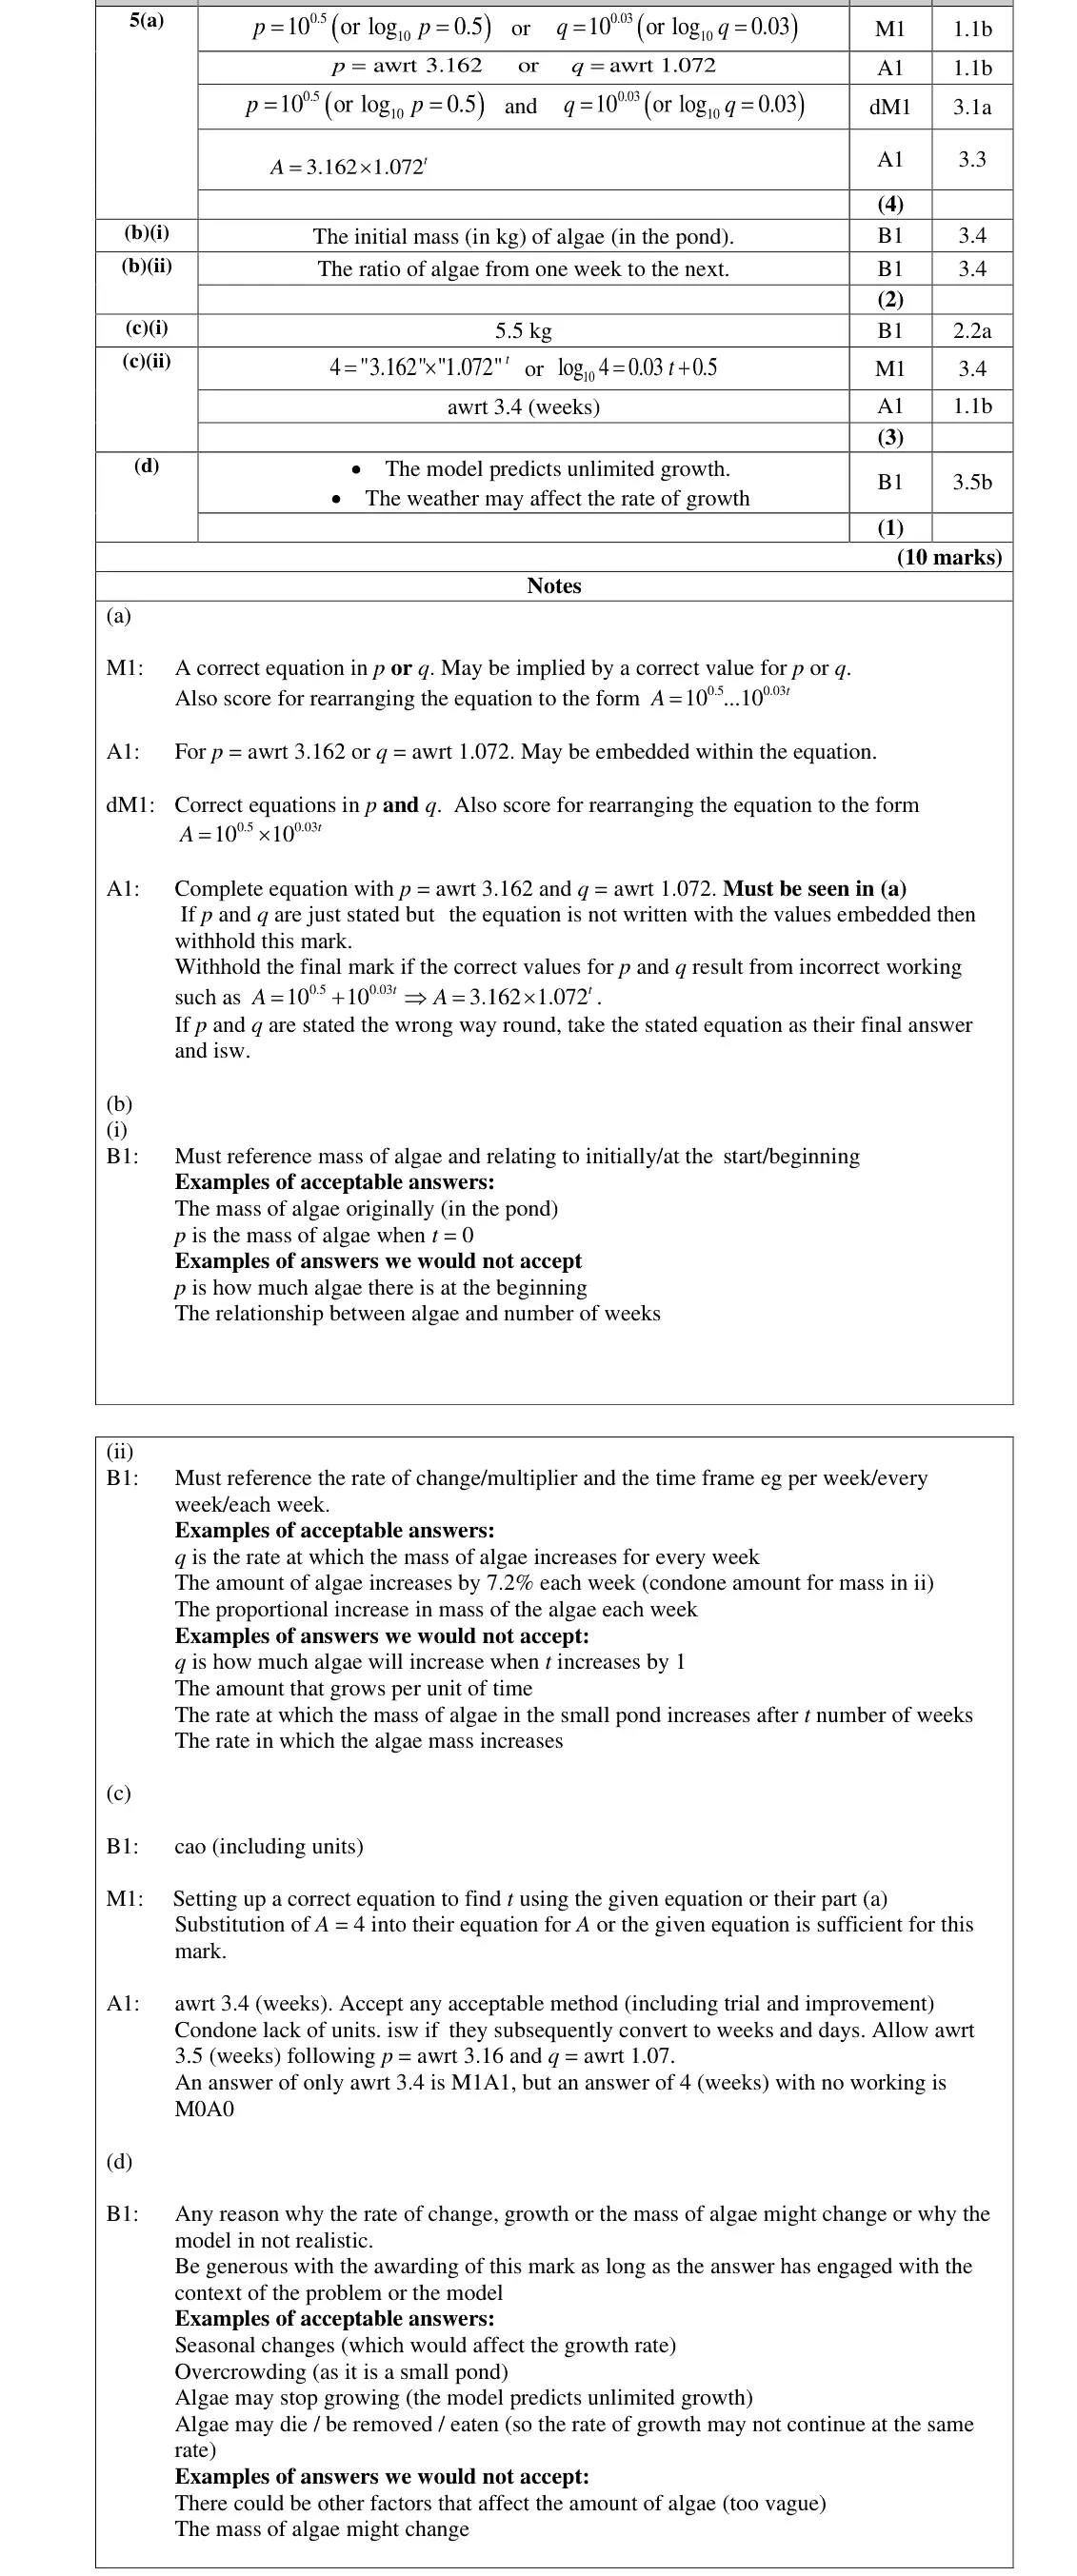
Common mistakes
log₁₀p = 0.5 and log₁₀q = 0.03 so p = 3.162, q = 1.072 (4 s.f.)
must write the complete equation A = 3.162 × 1.072^t
A = 10^0.5 + 10^0.03t is wrong
June 2022 · AS Paper 1 · Q5(b)2 marks
Mark scheme (whole question; this part is marked with the orange bar)
Examiner's comment
Generally, candidates found this question accessible with many scoring consistently throughout. In part (b), generally candidates understood that the demand of the question was to interpret the values of p and q in context although some answers such as “it is the gradient of the line” were seen. Most candidates were able to interpret the model well enough to understand that the value of p was the initial mass in kg of the algae in the pond. Those that failed to score this mark usually referred to the “amount” of algae rather than the mass of algae. Candidates needed to understand that the constant q was the rate at which the mass of algae increased each week. It was a common misconception that the q was the amount the mass of algae increases by each week. Incomplete explanations without reference to the time frame were also common for example, “the constant q is the rate at which the algae increases.” 6
Common mistakes
(i) p is the initial mass of algae (in kg), "amount" is not enough
(ii) q is the multiplier: the mass is multiplied by 1.072 (increases by 7.2%) each week, not the amount added per week, not "the gradient"
a time frame is needed
June 2022 · AS Paper 1 · Q5(c)3 marks
Mark scheme (whole question; this part is marked with the orange bar)
Examiner's comment
Generally, candidates found this question accessible with many scoring consistently throughout. In part (c), candidates who had a correct equation were generally able to complete the substitution successfully. Some candidates gained full marks after having incorrectly answered part (a), by using the equation linking 10 log A and t given in the question. As it was a modelling question, units were required to score this mark; most candidates used the correct units. This part of the question was also well attempted by many candidates. Those who found difficulties often tried to use 8 t = which was information given for use in part i.
Common mistakes
(i) 5.5 kg to the nearest 0.5 kg with units
(ii) solve 4 = 3.162 × 1.072^t or log₁₀4 = 0.03t + 0.5: t ≈ 3.4 weeks
using t = 8 again in (ii)
June 2022 · AS Paper 1 · Q5(d)1 mark
Mark scheme (whole question; this part is marked with the orange bar)
Examiner's comment
Generally, candidates found this question accessible with many scoring consistently throughout. In part (d), there were two limitations of the model: the first being the fact that it predicted unlimited growth and the second being that it predicted that the rate of growth remained constant. Most candidates successfully identified one of these limitations and were able to give a sufficient reason to explain in context why this was unrealistic. Common explanations included a change in conditions – sunlight/temperature changes, algae dying or being removed, and the pond eventually being fully covered and the algae running out of resources to consume, leading to a slowing of the growth rate.
Common mistakes
the model predicts unlimited growth
seasons or weather change the growth rate
algae die, are removed or run out of space in a small pond
vague "other factors" scores B0
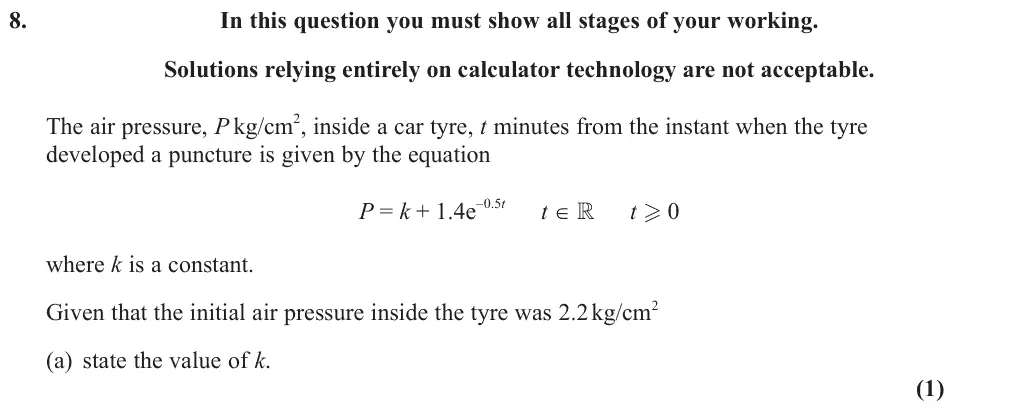
June 2022 · AS Paper 1 · Q8(a)1 mark
Mark scheme (whole question; this part is marked with the orange bar)
Examiner's comment
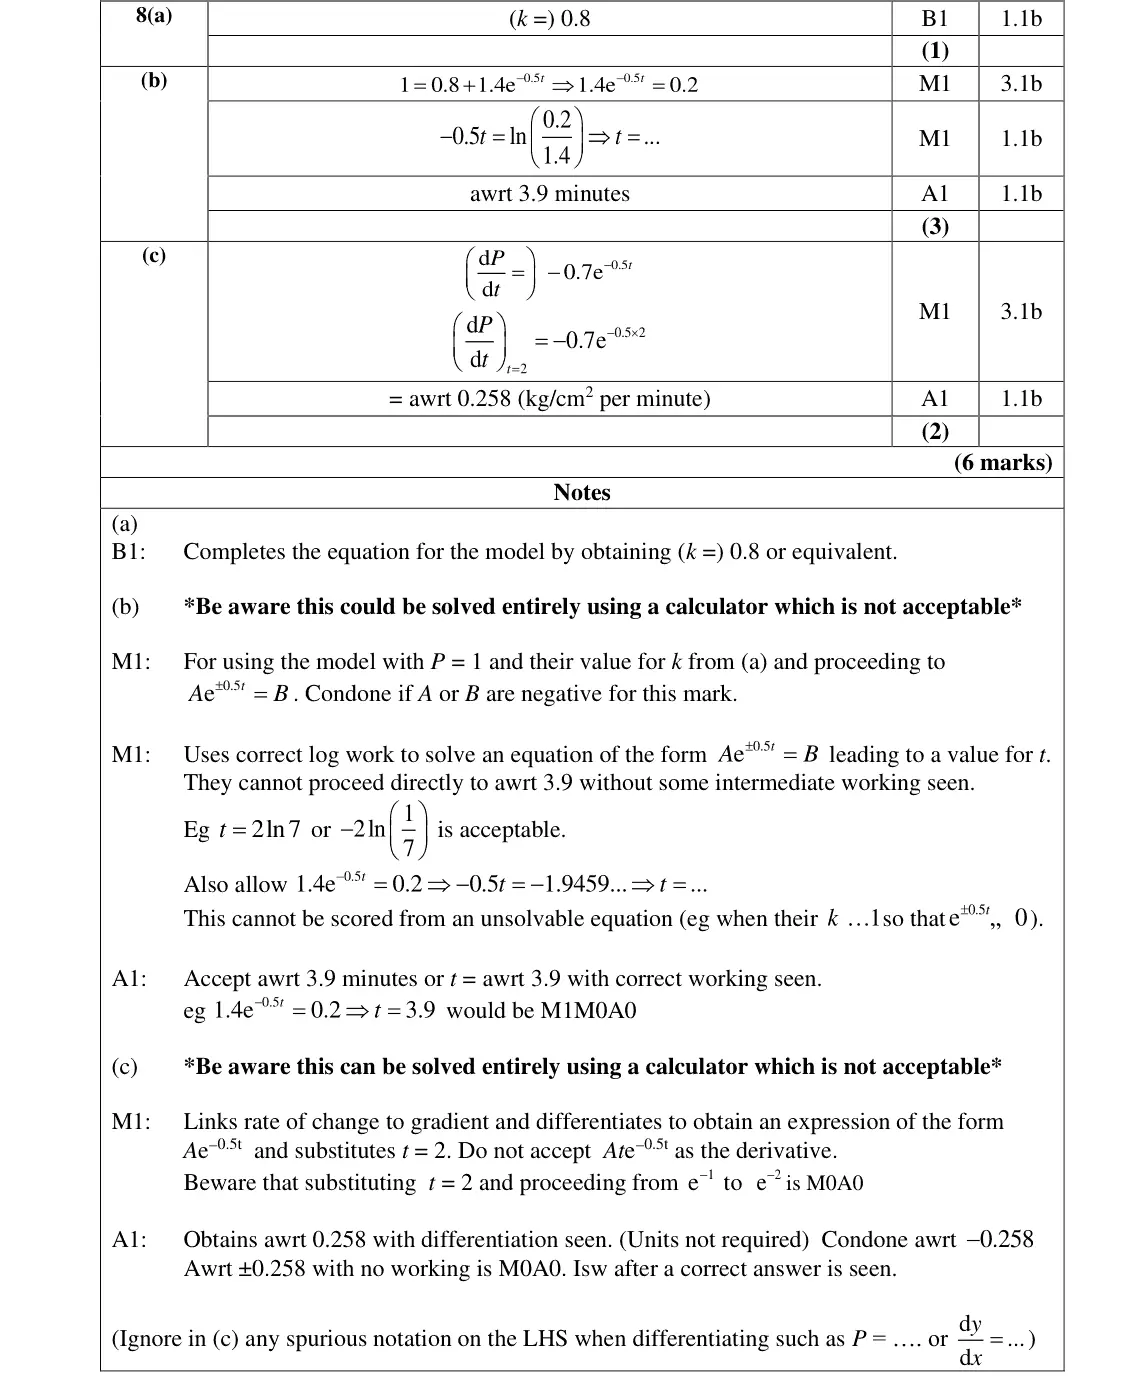
This question was reasonably well attempted. Logs continue to be an area of challenge for many candidates but despite this, a significant proportion were able to earn a good number of marks here. In part (a), many candidates were able to earn the mark for recognising that it was necessary to set 0 t = and correctly obtained 0.8 k = . The most common error here occurred when candidates assumed, in error, that 0e 0 = and so obtained 2.2 k =
Common mistakes
t = 0 gives k + 1.4 = 2.2, k = 0.8
e⁰ = 1, not 0 (giving k = 2.2)
June 2022 · AS Paper 1 · Q8(b)3 marks
Mark scheme (whole question; this part is marked with the orange bar)
Examiner's comment
This question was reasonably well attempted. Logs continue to be an area of challenge for many candidates but despite this, a significant proportion were able to earn a good number of marks here. In part (b), the majority of candidates were able to recognise that they needed to set their equation for P equal to 1. Those who had achieved 0.8 k = in (a) usually made good progress and scored full marks in this part. Those candidates who obtained k = 2.2 were able to make a first step in solving the equation. They were, however, limited in their progress as the equation was ultimately unsolvable, but many attempted to persevere through taking logs of a negative value which was not creditworthy. Some candidates misunderstood the context here and thought that they needed P = 1.2, perhaps misreading the question which asked for a drop to an air pressure of 1 kg/cm3 rather than a drop in air pressure of 1 kg/cm3. Nonetheless these candidates were usually able to make good progress as the resulting equation was solvable in this case and some good log work was seen. There were a small proportion of candidates who were clearly less secure in their log work however and some attempted to take logs of each term separately before rearranging or neglected to divide by 1.4 before taking logs. A small number of candidates attempted to use 10 log rather than natural logs. Almost all candidates realised they need to show all stages of their working and it was rare to see answers appear from nowhere due to overreliance on a calculator.
Common mistakes
set P = 1 (fall to 1, not by 1)
divide by 1.4 before taking ln: e^(−0.5t) = 1/7, t = 2 ln 7 ≈ 3.9 minutes
taking logs of each term is wrong
working must be shown
June 2022 · AS Paper 1 · Q8(c)2 marks
Mark scheme (whole question; this part is marked with the orange bar)
Examiner's comment
This question was reasonably well attempted. Logs continue to be an area of challenge for many candidates but despite this, a significant proportion were able to earn a good number of marks here. Part (c) of this question was a good differentiator and was a challenge to many candidates. For a significant proportion of candidates, “rate” did not signal the need for rate of change 8 and hence differentiation. It was common to see candidates simply substituting in t = 2 into their equation for P to obtain P = 1.32. Of those candidates who did attempt to find d d P t many seemed to struggle with the chain rule. Some candidates obtained results of the form Ate-0.5t, whilst others retained the constant term 0.8 when differentiating. Others began by substituting in t = 2 and then proceeded from e-2 to e-1 or ‘differentiated’ e-1 to get e-2. It was common for candidates who were able to progress to a correct value to give the final answer of -0.258 rather than 0.258 but this was condoned.
Common mistakes
rate means dP/dt = −0.7e^(−0.5t) (the constant k disappears
not Ate^(−0.5t))
substituting t = 2 into P is wrong
0.258 kg/cm² per minute
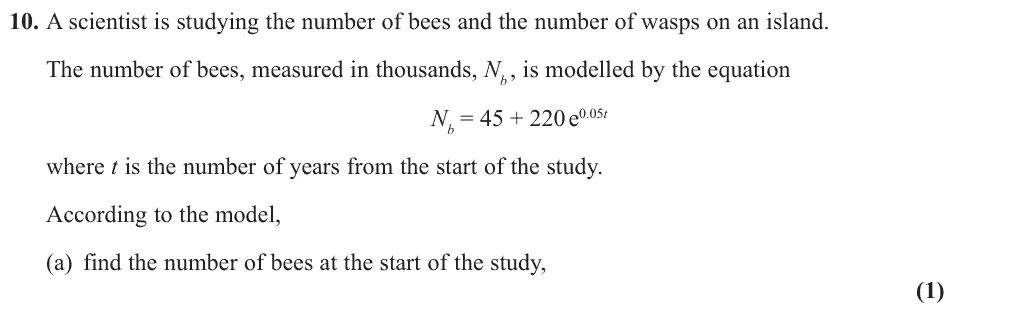
June 2022 · Paper 1 · Q10(a)1 markMedium
Mark scheme (whole question; this part is marked with the orange bar)
Examiner's comment
This was the third modelling question on the paper, this time based around an exponential model. This should have been expected given the Advance Information and candidates performed well on parts (a) and (b). Part (c) was more of a challenge with only higher achieving students scoring all 4 marks. Part (a) was either answered correctly, or the mark was not awarded because the answer stated was 265 bees not 265,000 bees.
Common mistakes
t = 0: 45 + 220 = 265 thousand bees (265 alone loses the mark)
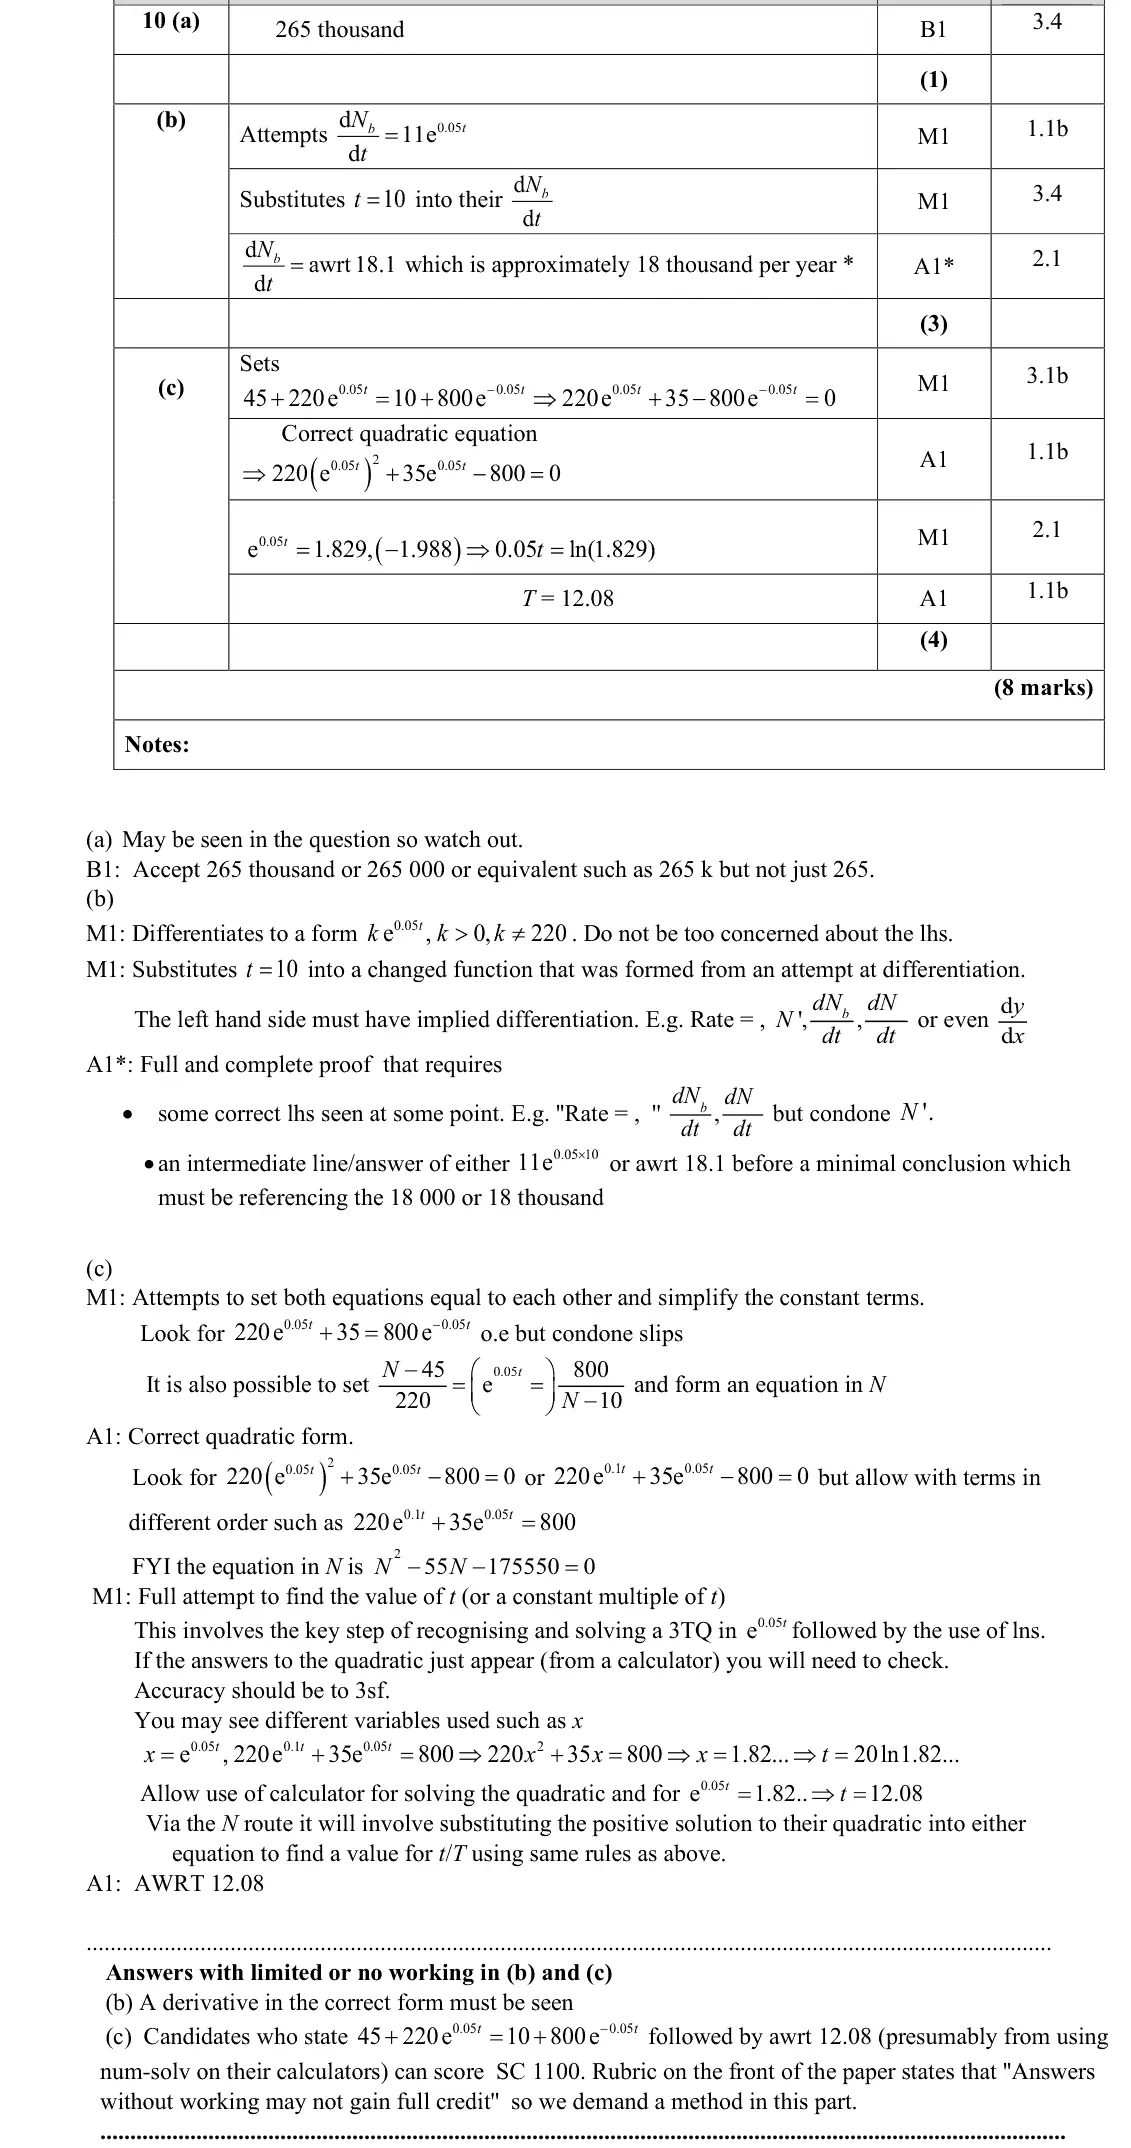
June 2022 · Paper 1 · Q10(b)3 marksMedium
Mark scheme (whole question; this part is marked with the orange bar)
Examiner's comment
This was the third modelling question on the paper, this time based around an exponential model. This should have been expected given the Advance Information and candidates performed well on parts (a) and (b). Part (c) was more of a challenge with only higher achieving students scoring all 4 marks. Most candidates recognised the need to differentiate in part (b), and used appropriate notation. Most did this accurately before substituting in t =10 to obtain 18.1. A number of candidates failed to secure the final mark however, for not providing a minimal conclusion relating their answer to 18,000. Common reasons for not achieving full marks were • failing to use appropriate notation often using d d y x instead of d d N t • failing to recognise the need to use differentiation often subtracting the values of b N at t =9 and 10 or else t =10 and 11
Common mistakes
dN/dt = 11e^(0.05t), at t = 10 gives 18.1
conclude about 18 thousand per year
subtracting N at t = 9 and 10 is not a rate
use dN/dt notation, not dy/dx
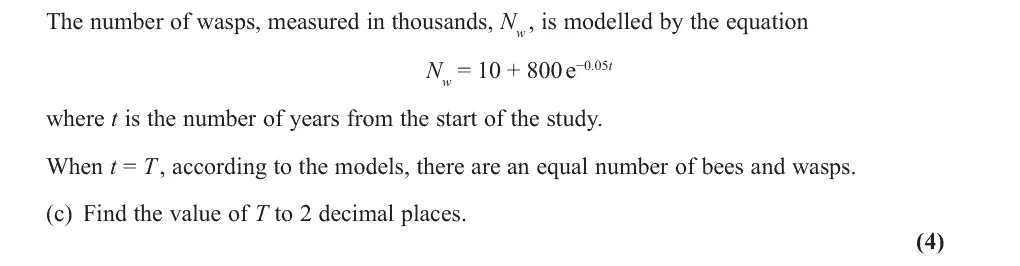
June 2022 · Paper 1 · Q10(c)4 marksMedium
Mark scheme (whole question; this part is marked with the orange bar)
Examiner's comment
This was the third modelling question on the paper, this time based around an exponential model. This should have been expected given the Advance Information and candidates performed well on parts (a) and (b). Part (c) was more of a challenge with only higher achieving students scoring all 4 marks. Part (c) was the most demanding part of the question with many candidates just picking up the first mark for equating the two expressions. Having equated the two expressions, the significance of the negative exponential term seemed to be poorly understood. Very common errors included • changing the 0.05 e t - term to 0.05 e t and then solving • applying 'ln' to each term in the equation to form a linear equation in t • slips in coefficients with 220 becoming 200 A number of candidates reverted to numerical methods or the use of their calculator to solve the equation rather than solve by algebraic methods. The strongest candidates recognised the quadratic equation in 0.05 e t and were able then to solve it correctly, many after making a substitution 0.05 =e t x .
Common mistakes
multiply by e^(0.05t): 220(e^(0.05t))² + 35e^(0.05t) − 800 = 0
e^(0.05t) = 1.829 (reject negative)
T = 20 ln 1.829 = 12.08
taking ln of each term or changing e^(−0.05t) to e^(0.05t)
calculator-only answer is SC
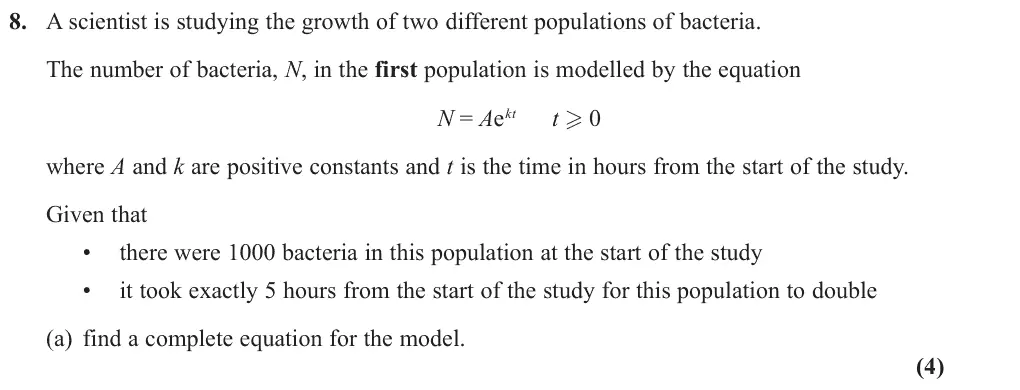
Oct 2021 · Paper 1 · Q8(a)4 marks
Mark scheme (whole question; this part is marked with the orange bar)
Examiner's comment
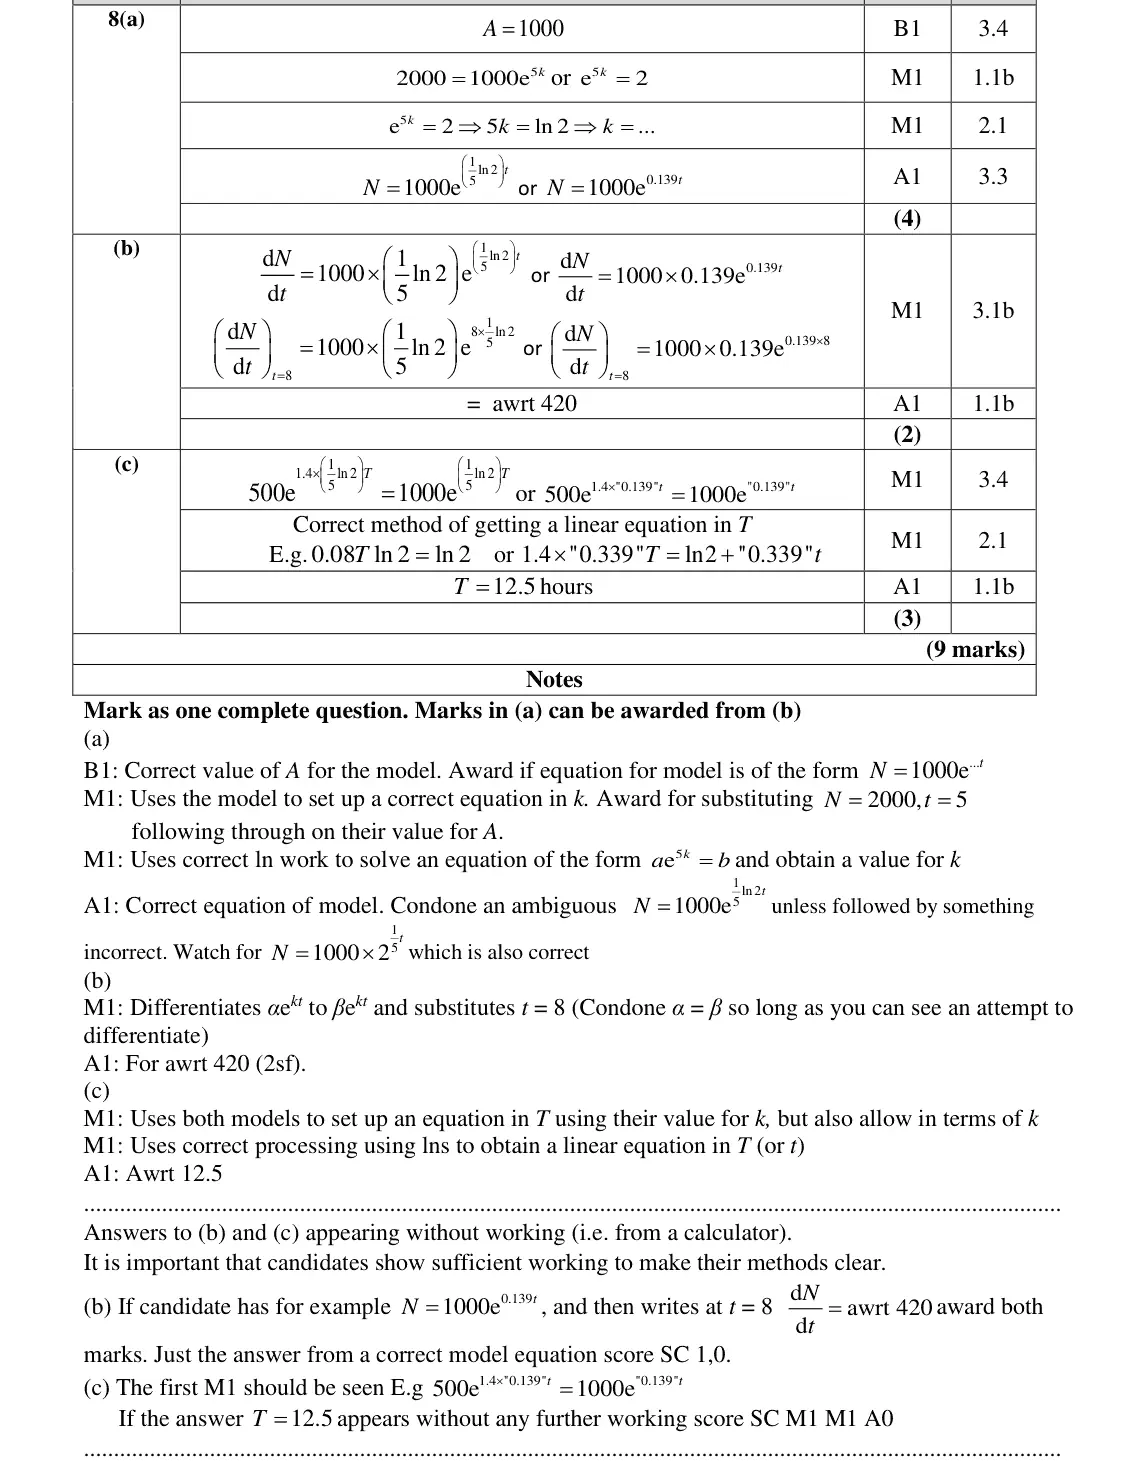
This was the first significant modelling question on this paper. As with other series, candidates find aspects of modelling difficult. The barriers to success here were parts (b) and (c). In part (a) many candidates made progress and achieved a complete equation for the model with k given exactly as ln(2)/5 or rounded to 0.139. A few students rounded more accurately giving k as 0.1386. Some rounded k to 0.14 and lost the accuracy mark. A fair number of students who failed to find the correct value of ‘A’ evaluated e0 as e.
Common mistakes
A = 1000 (e⁰ = 1, not e)
e⁵ᵏ = 2 so k = (ln 2)/5 or 0.139 (0.14 loses accuracy)
give the complete equation N = 1000e^(0.139t)
Oct 2021 · Paper 1 · Q8(b)2 marks
Mark scheme (whole question; this part is marked with the orange bar)
Examiner's comment
This was the first significant modelling question on this paper. As with other series, candidates find aspects of modelling difficult. The barriers to success here were parts (b) and (c). In part (b) many students used an incorrect method to find the rate of increase in the number of bacteria. Some substituted t =8 into their expression for N, which just found the number of bacteria after 8 hours; others then went on to divide this number by 8 or even 1000 to try and find the rate of increase. Those who realised that the expression for N needed to be differentiated to find the rate of increase often scored at least the method mark.
Common mistakes
rate of increase means dN/dt = 1000k e^(kt) at t = 8: 420 (2 s.f.)
substituting t = 8 into N, or dividing N by 8, is wrong
Oct 2021 · Paper 1 · Q8(c)3 marks
Mark scheme (whole question; this part is marked with the orange bar)
Examiner's comment
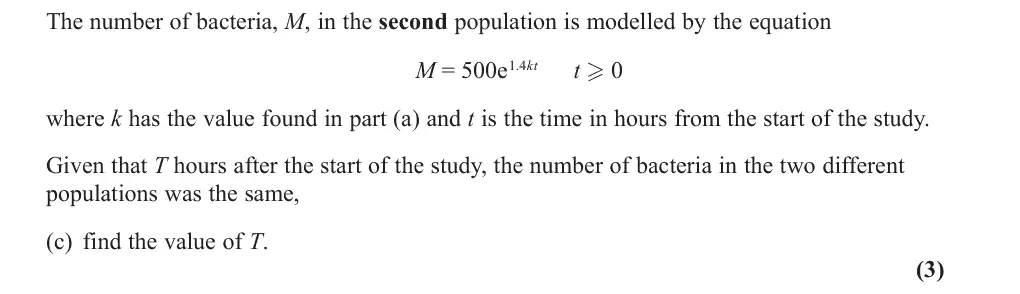
This was the first significant modelling question on this paper. As with other series, candidates find aspects of modelling difficult. The barriers to success here were parts (b) and (c). For part (c) the majority of candidates who obtained the correct equation of the model in (a) were able to use both models given to set up an appropriate equation in t or T to gain the first method mark. Processing the resulting equation using logs to obtain a linear equation in t or T posed more of a challenge and many made no further progress. A large proportion who did attempt to make progress often used incorrect log work: some multiplied the logs rather than add them; others did not find the log of all the components, usually the ‘2’. Some students combined the exponential functions incorrectly by dividing the powers rather than subtracting them. Those scoring all three marks here were usually the most able candidates.
Common mistakes
set 500e^(1.4kT) = 1000e^(kT)
take logs to get a linear equation 0.4kT = ln 2
T = 12.5 hours
log errors (multiplying logs, dropping ln 2)
Oct 2021 · AS Paper 1 · Q11(a)1 mark
Mark scheme (whole question; this part is marked with the orange bar)
Examiner's comment
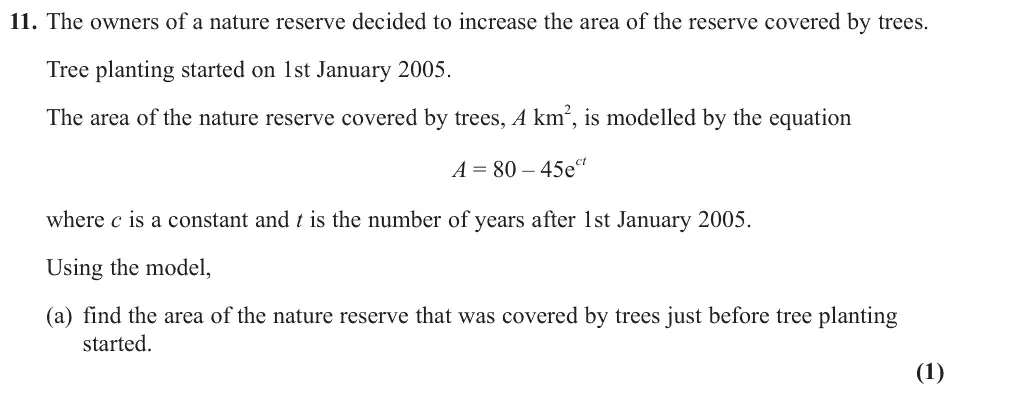
This question was generally answered well by most candidates. It was typically silly mistakes or not reading the question which resulted in full marks not being scored. In part (a), most candidates were successful in finding the area to be 35 km2. Some just opted for 80 and the units were also incorrect, at times, such as being given as trees.
Common mistakes
t = 0 gives A = 80 − 45 = 35 km² (not 80)
correct units needed
Oct 2021 · AS Paper 1 · Q11(b)4 marks
Mark scheme (whole question; this part is marked with the orange bar)
Examiner's comment
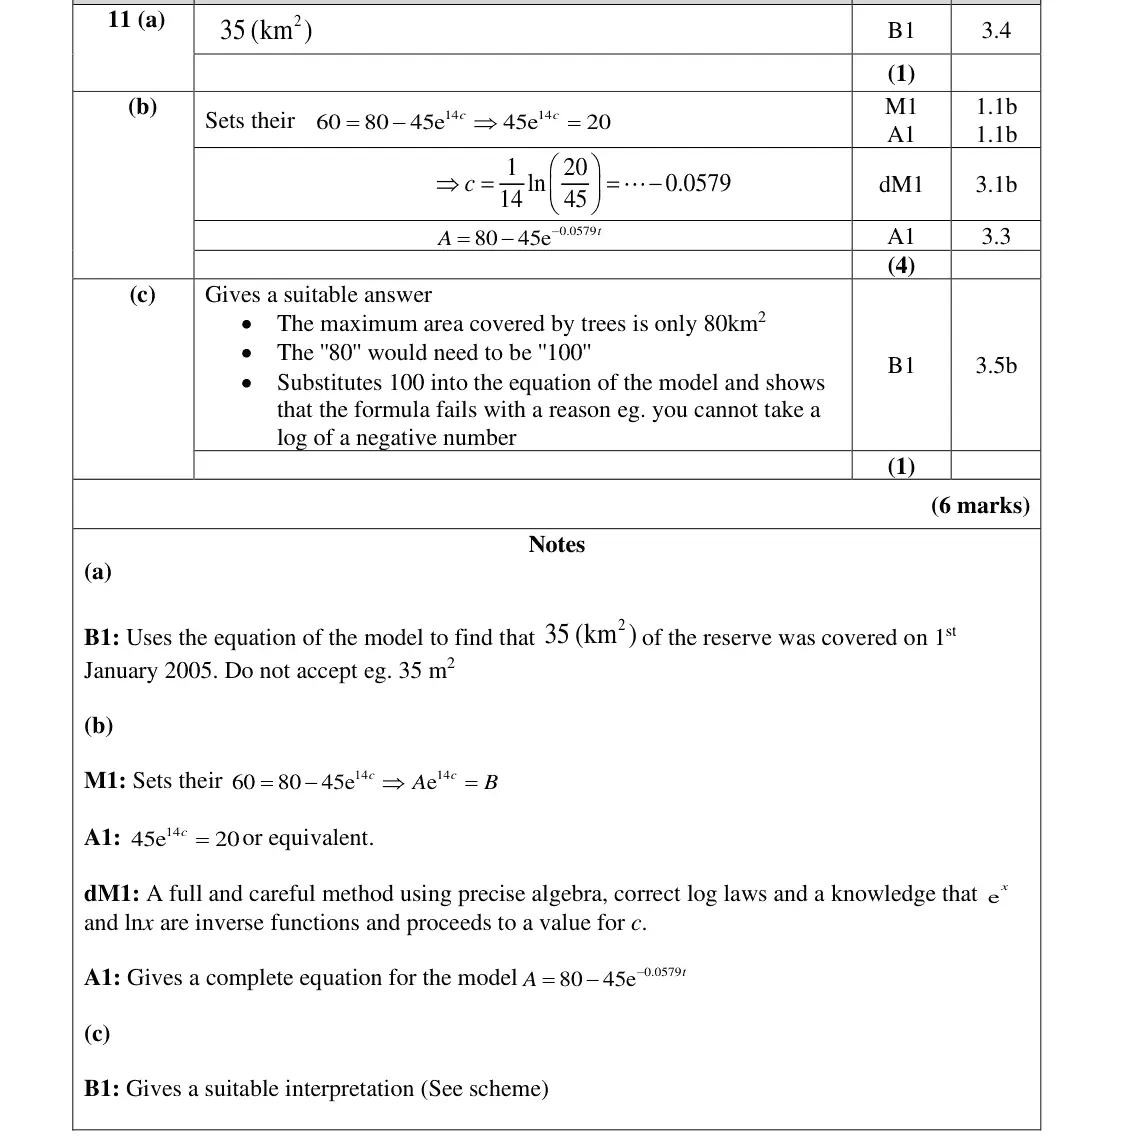
This question was generally answered well by most candidates. It was typically silly mistakes or not reading the question which resulted in full marks not being scored. In part (b), candidates typically were able to equate the expression to 60 and rearrange correctly. A pleasing number were able to proceed to the correct value for c, although a significant number did not then state the equation which the question asked the candidates to find a complete equation. Some over rounded the value of c, whilst others tried to take logs of each term.
Common mistakes
t = 14 (2005 to 2019): 45e^(14c) = 20 so c = (1/14)ln(20/45) = −0.0579
give the complete equation A = 80 − 45e^(−0.0579t)
taking logs of each term separately
over-rounding c
Oct 2021 · AS Paper 1 · Q11(c)1 mark
Mark scheme (whole question; this part is marked with the orange bar)
Examiner's comment
This question was generally answered well by most candidates. It was typically silly mistakes or not reading the question which resulted in full marks not being scored. Part (c) was answered well by many candidates. It was really pleasing to see so many comments where the candidate had clearly engaged with the model and recognised that the maximum area was 80 km2. This type of response was much more frequent than last time when most opted to just substitute in the value given in the question and show that you cannot take logs of a negative number. Whilst this was accepted as a valid response, the engaging of candidates with the context of models should continue to be encouraged.
Common mistakes
the model has a maximum (limiting) area of 80 km², so 100 km² can never be reached
or substituting 100 needs the log of a negative number
Oct 2021 · AS Paper 1 · Q13(b)3 marks
Mark scheme (whole question; this part is marked with the orange bar)
Examiner's comment
As part (a) was not completed successfully in many cases, part (b) automatically was limited in its accessibility. Some candidates just made a comment, rather than use the model as they did not have values for p and q, or even those who did seemed unsure what they were finding.
Common mistakes
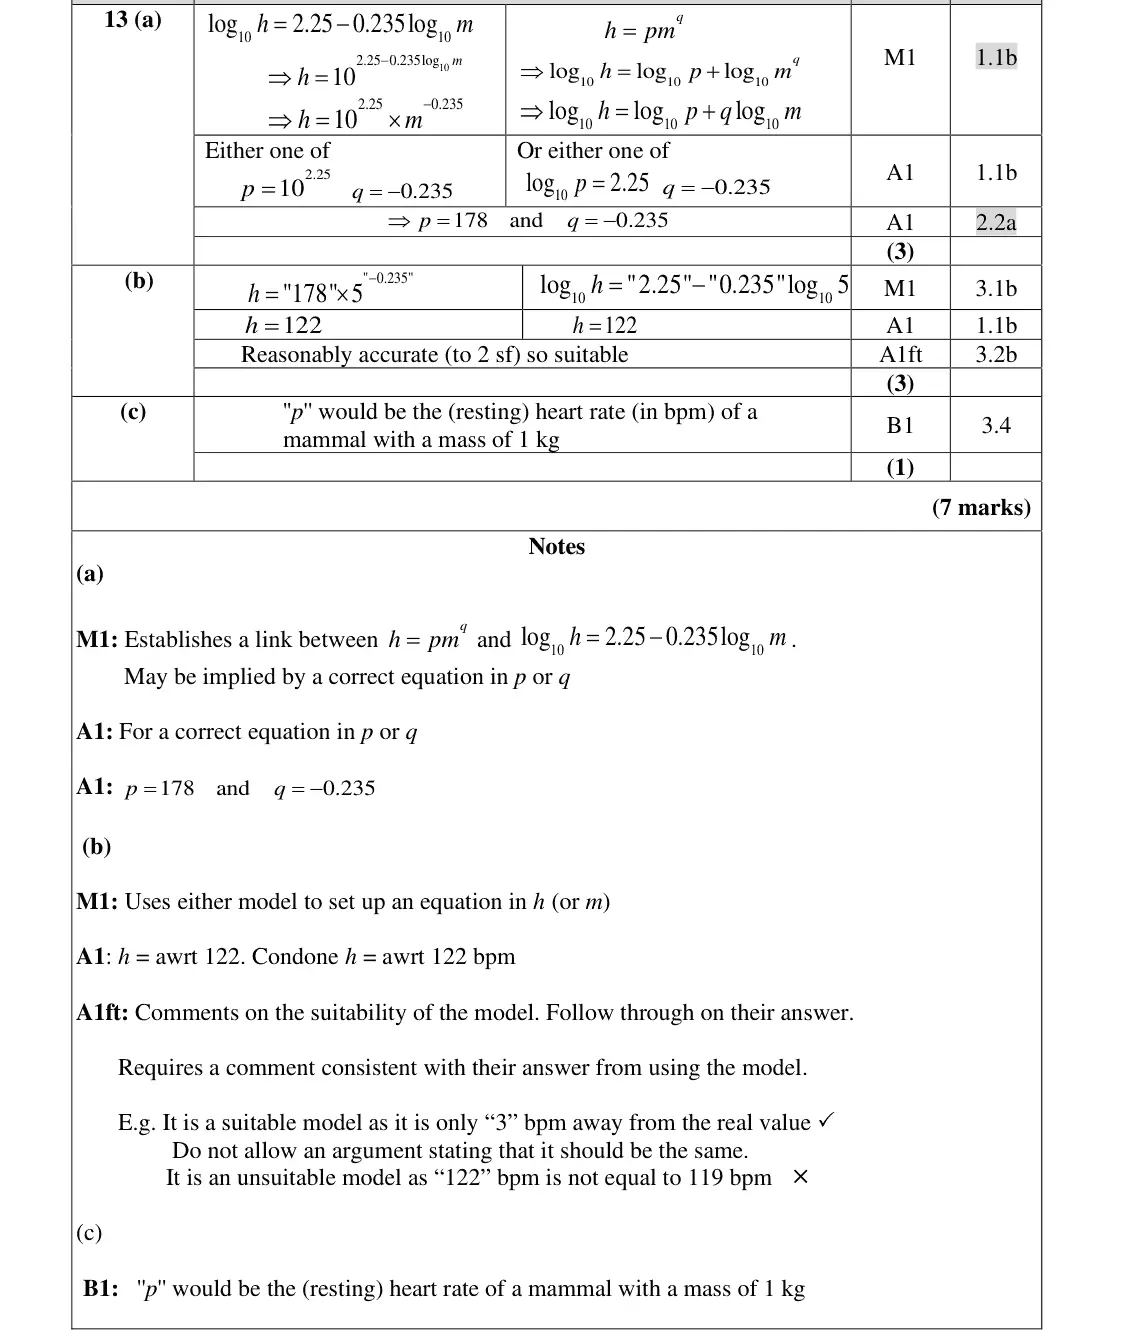
use the model with m = 5: h = 178 × 5^(−0.235) ≈ 122 bpm
compare with 119: close, so suitable
"not equal so unsuitable" does not score
must use the model, not just comment
Oct 2021 · AS Paper 1 · Q13(c)1 mark
Mark scheme (whole question; this part is marked with the orange bar)
Examiner's comment
Part (c) had a range of responses, but it was extremely rare for a mark to be scored and most failed to appreciate that the resting heart rate related to a mammal with a mass of 1 kg.
Common mistakes
p is the resting heart rate (bpm) of a mammal of mass 1 kg (m = 1 so h = p)
answered correctly very rarely
Oct 2021 · Paper 2 · Q14(c)2 marks
Mark scheme (whole question; this part is marked with the orange bar)
Examiner's comment
This question proved challenging for the majority of candidates, with many not answering it at all. Part (c) was attempted by many candidates, even if they hadn’t attempted (a) and (b).
Common mistakes
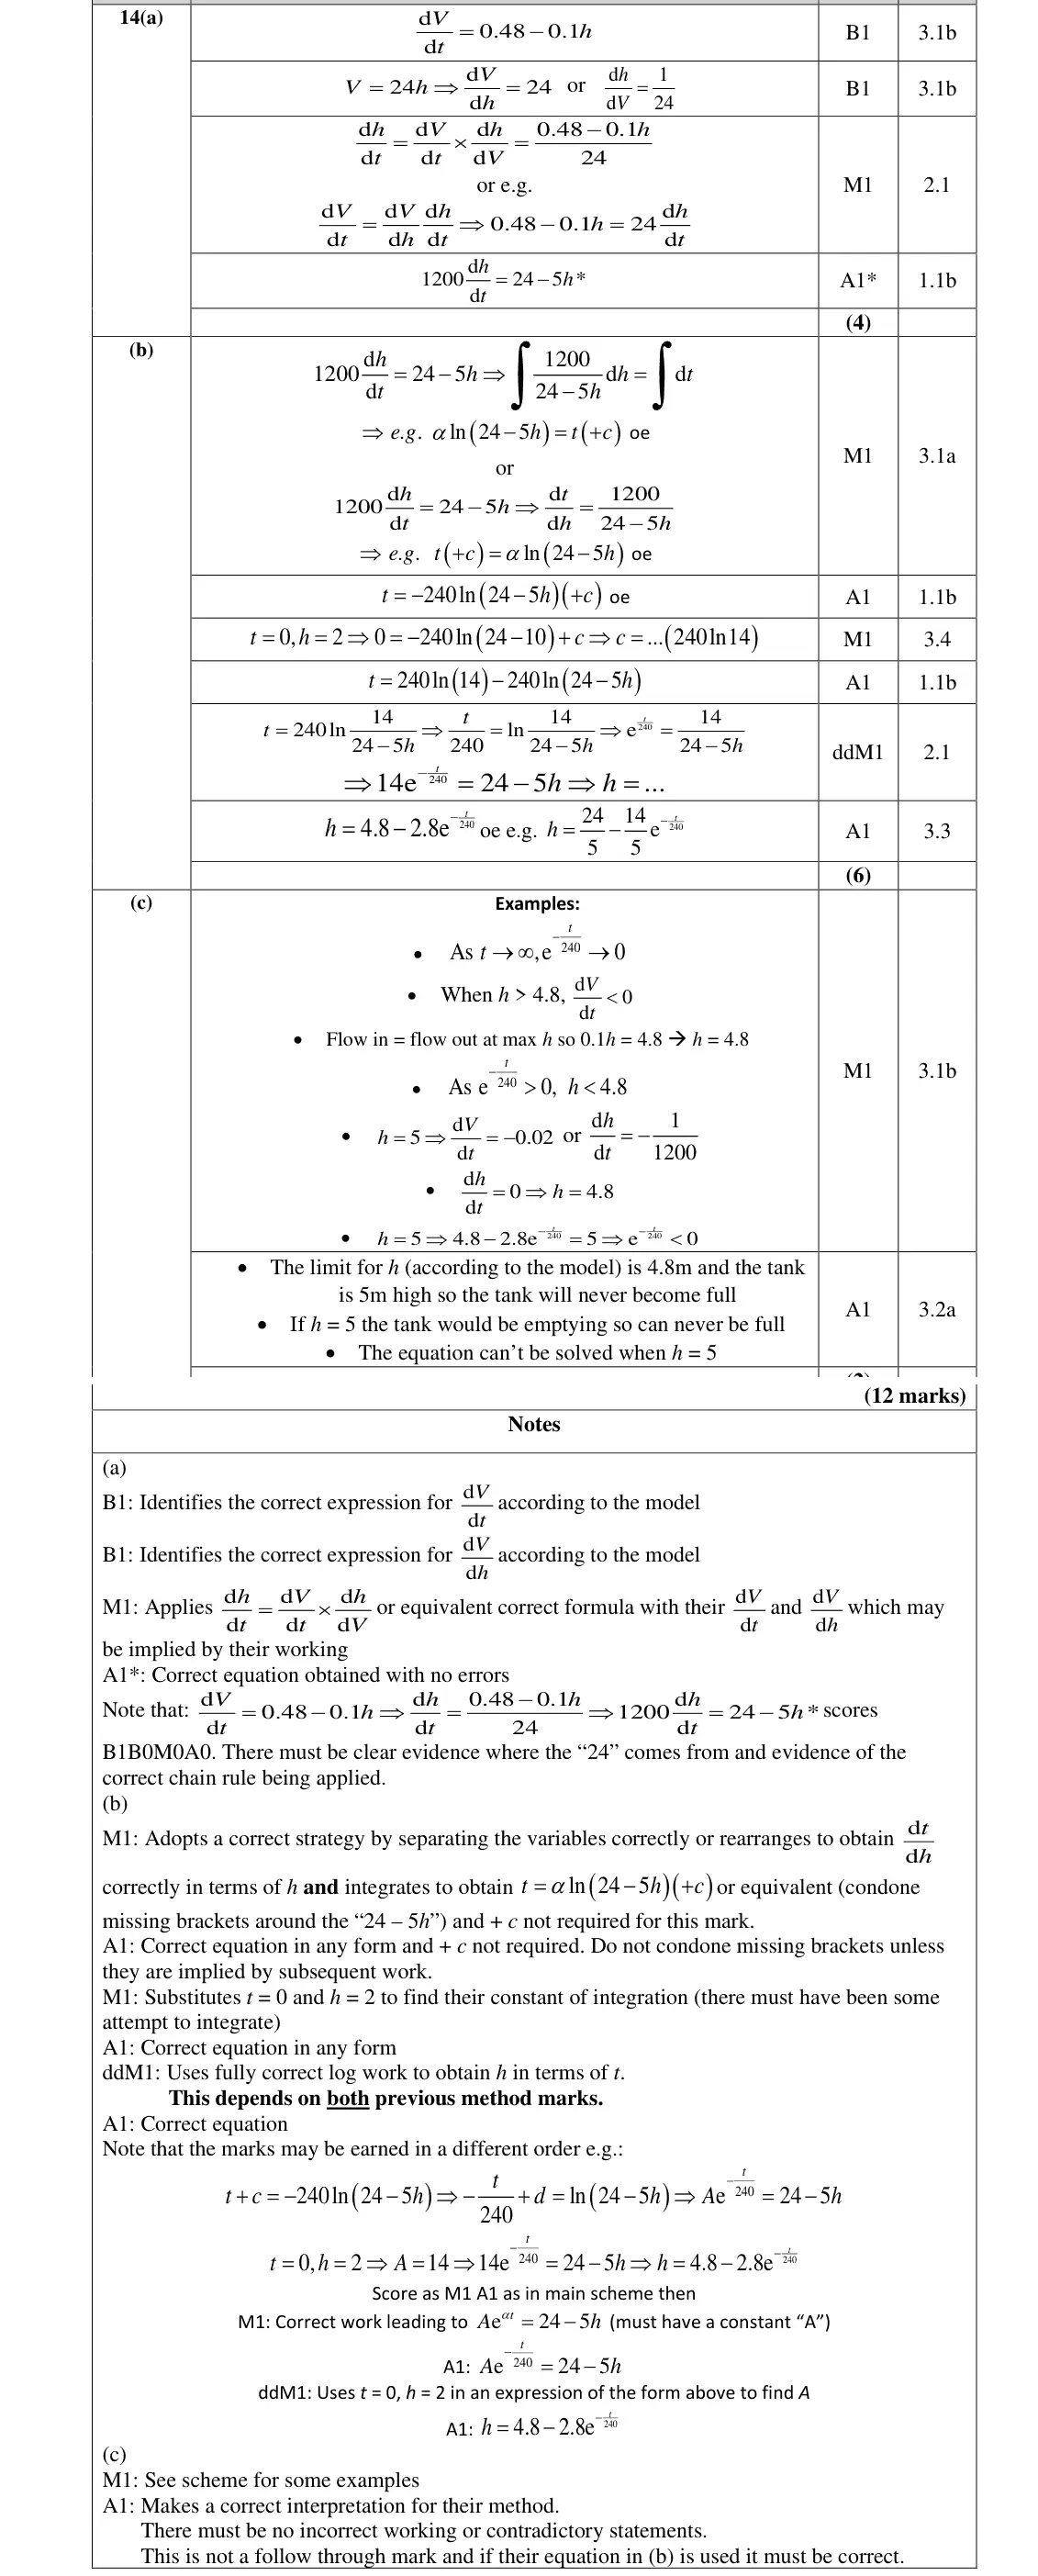
as t → ∞, h → 4.8 m < 5 m so the tank never fills (or flow in = flow out at h = 4.8)
no contradictory statements
Oct 2020 · Paper 1 · Q82 marks
Mark scheme (whole question; this part is marked with the orange bar)
Examiner's comment
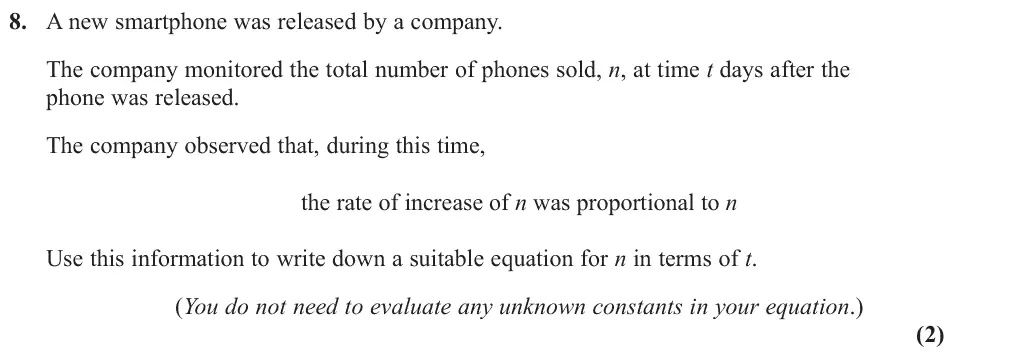
Candidates were expected to realise that ''when the rate of change is proportional to the y value, an exponential model should be used.'' The question seemed to take a great many candidates by surprise and many assumed that 'n was proportional to n' or that 'n was proportional to t', not that the rate of growth of 'n was proportional to n'. Those that did interpret the situation correctly could write down an equation very quickly whereas others attempted to solve a differential equation. Equations scoring one of two marks were common and included e , e t kt n A n = = and e kt n A b = +
Common mistakes
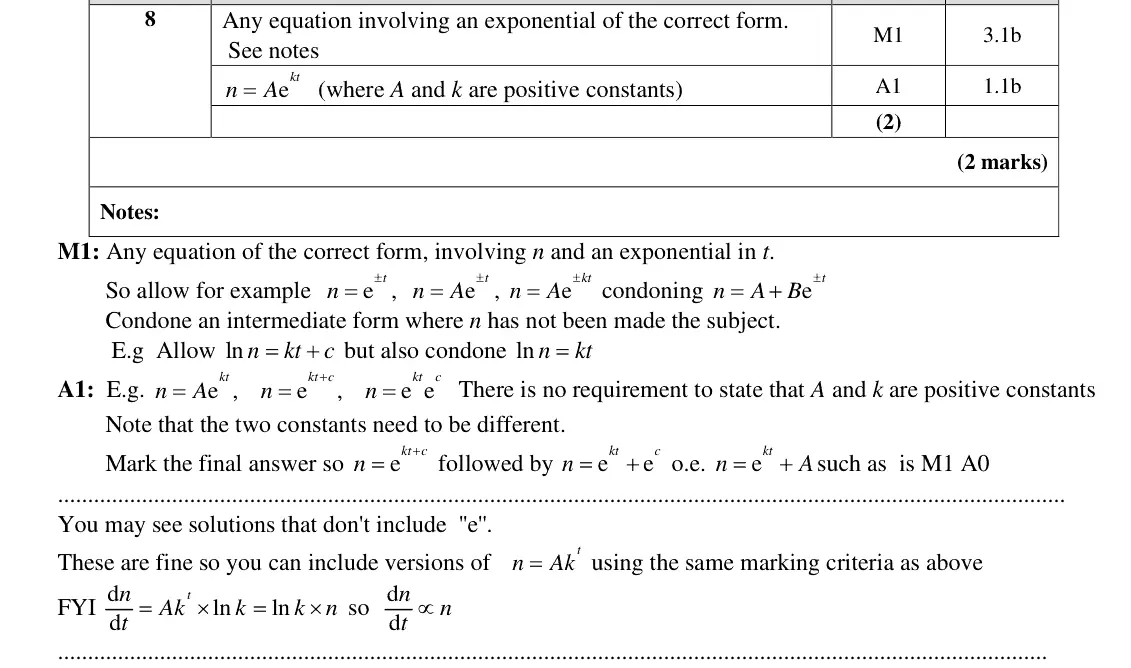
rate of change proportional to n means an exponential model n = Ae^(kt)
not n ∝ t
the two constants must be different (n = e^(kt + c) fine, n = e^(kt) + A is not)
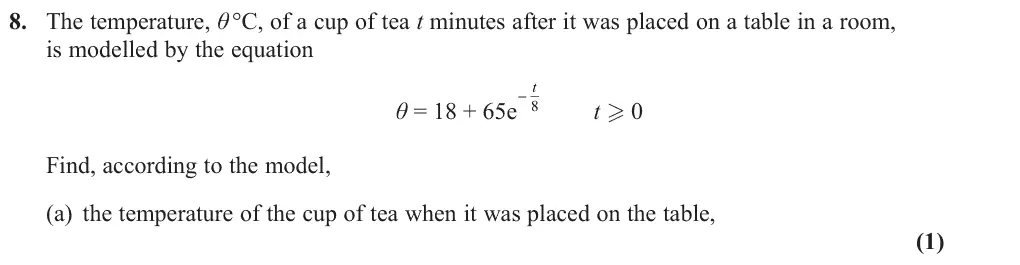
Oct 2020 · AS Paper 1 · Q8(a)1 mark
Mark scheme (whole question; this part is marked with the orange bar)
Examiner's comment
This question was another which focussed on problem solving, with the majority of candidates only able to score around half of the marks available. Part (d), in particular proved to be too difficult for most candidates so it was rare to see full marks. In part (a), many candidates could score at least one mark here by calculating the value of 83, however, it was not uncommon for units to be omitted which meant that the mark was not awarded.
Common mistakes
t = 0 gives 83 °C
units needed
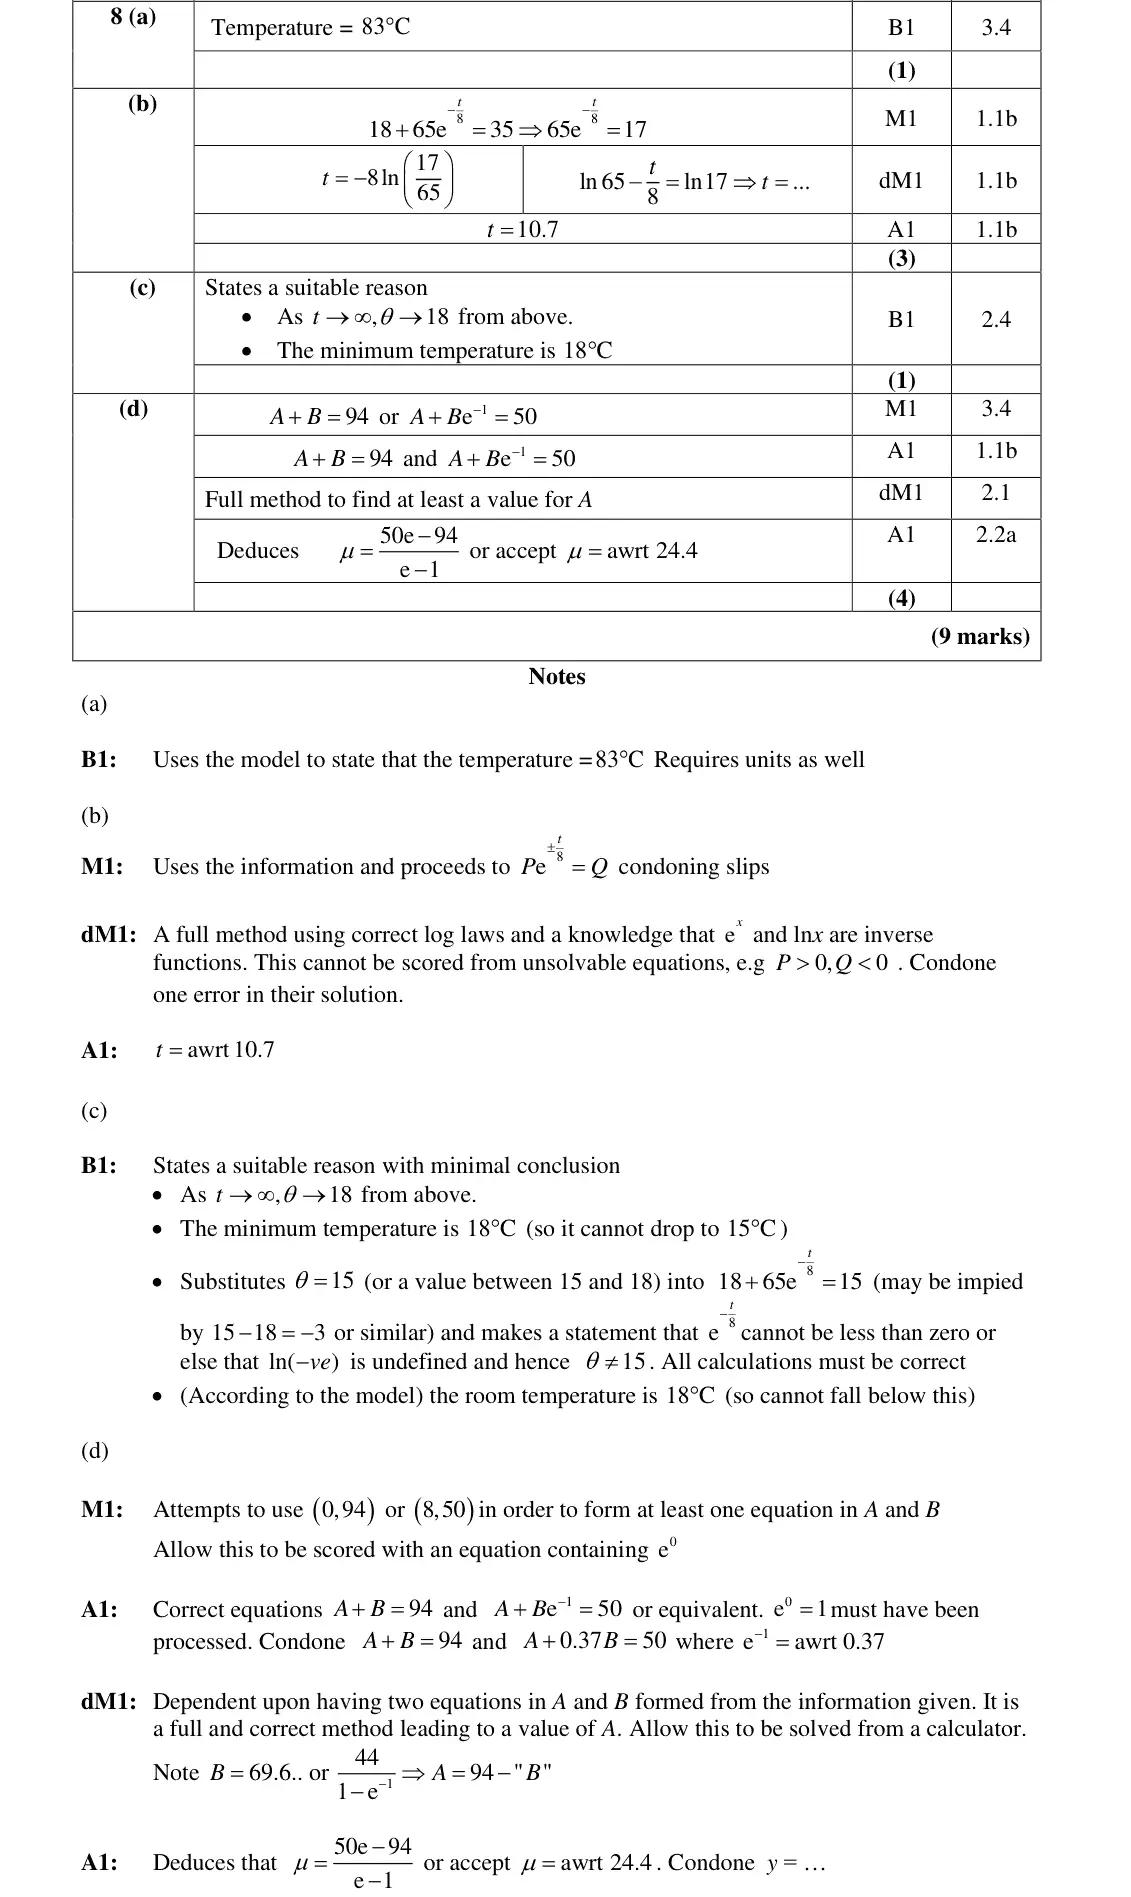
Oct 2020 · AS Paper 1 · Q8(b)3 marks
Mark scheme (whole question; this part is marked with the orange bar)
Examiner's comment
This question was another which focussed on problem solving, with the majority of candidates only able to score around half of the marks available. Part (d), in particular proved to be too difficult for most candidates so it was rare to see full marks. In part (b), the majority of candidates scored full marks here and seemed very comfortable with the fact that ln is the inverse. There were some slips with rearrangements of the equation, which was often dividing by 8 rather than multiplying by 8. It was evident that some candidates used their calculators to solve the equation without demonstrating any method. Candidates should be encouraged to show all of their working, to ensure that full marks can be scored.
Common mistakes
65e^(−t/8) = 17 so t = −8 ln(17/65) = 10.7
multiply by 8, not divide
show the ln step
Oct 2020 · AS Paper 1 · Q8(c)1 mark
Mark scheme (whole question; this part is marked with the orange bar)
Examiner's comment
This question was another which focussed on problem solving, with the majority of candidates only able to score around half of the marks available. Part (d), in particular proved to be too difficult for most candidates so it was rare to see full marks. Most candidates were successful in part (c), which may have been due to the graph having been provided. Many stated 18 C as being the minimum temperature of the model which was condoned for the mark, although a significant number stated that “15 C is the room temperature” which did not show an understanding of the model. The other most popular way to answer the question was to substitute 15 into the equation and concluded that you cannot log a negative. Just stating that “you can’t log a negative” without providing the working to 8 back this up was not sufficient as it was not enough evidence that the candidate had engaged with the model.
Common mistakes
as t → ∞ θ → 18 from above (minimum 18 °C)
"cannot log a negative" needs the working 15 − 18 = −3
"15 °C is room temperature" scores nothing
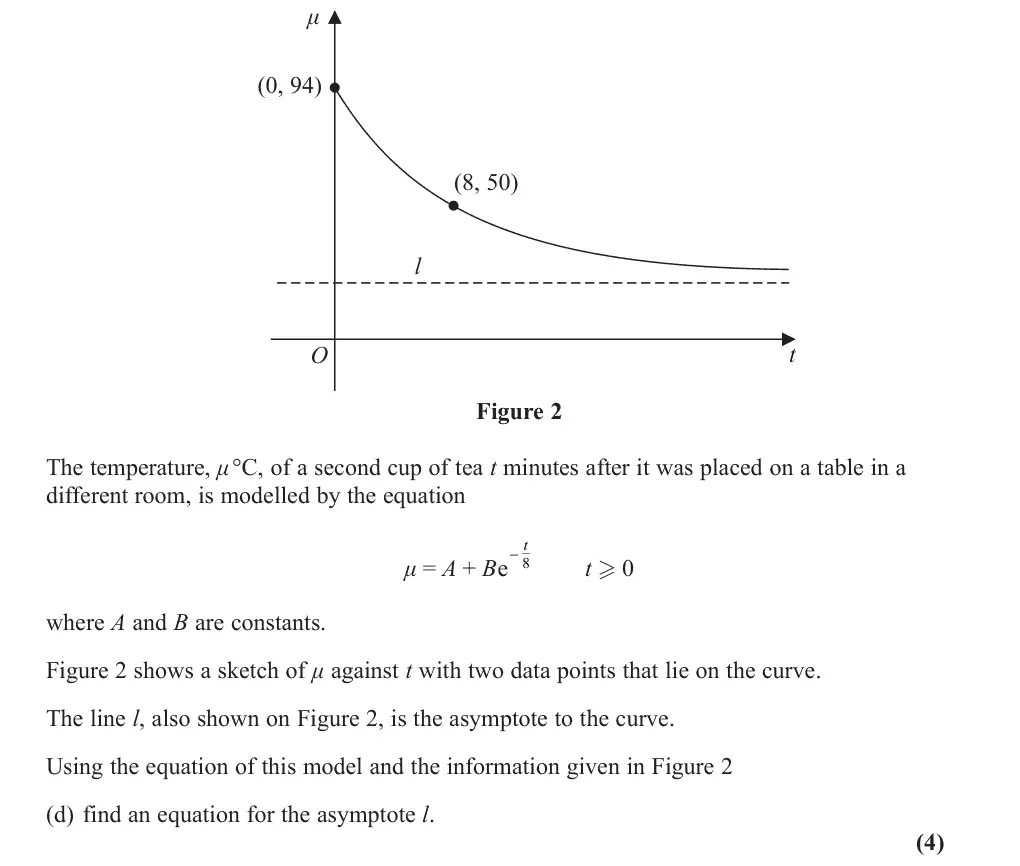
Oct 2020 · AS Paper 1 · Q8(d)4 marks
Mark scheme (whole question; this part is marked with the orange bar)
Examiner's comment
This question was another which focussed on problem solving, with the majority of candidates only able to score around half of the marks available. Part (d), in particular proved to be too difficult for most candidates so it was rare to see full marks. Part (d) caused more issues than the rest of the question for candidates. Several of them assumed A was equal to 94 and therefore did not score highly in this part. Some candidates attempted to find the gradient between the given coordinates and therefore did not score any marks. However, once candidates formed the two simultaneous equations, they seemed to find it quite easy to use the elimination method to eliminate A, and then go on to correctly solve for A and B and therefore work out the equation of the asymptote.
Common mistakes
form A + B = 94 and A + Be^(−1) = 50 and solve
asymptote μ = A ≈ 24.4 (not A = 94)
gradient between the points is wrong
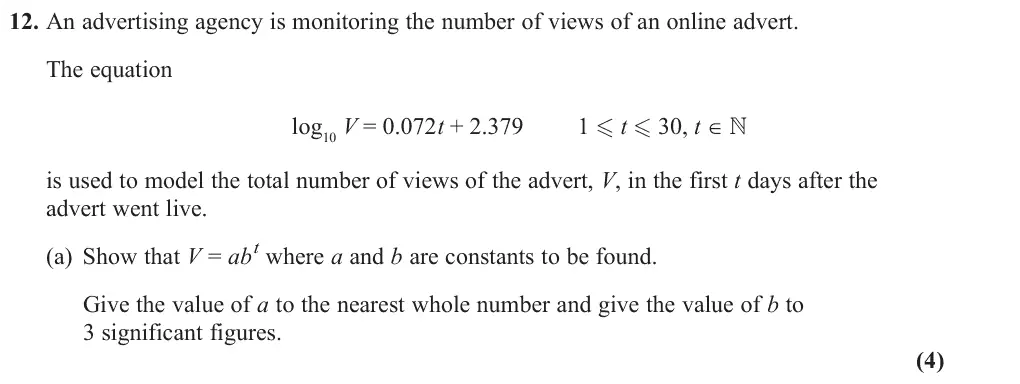
Oct 2020 · AS Paper 1 · Q12(a)4 marks
Mark scheme (whole question; this part is marked with the orange bar)
Examiner's comment
This question proved to be more challenging for candidates than was anticipated. There were a large number of candidates who did not attempt the question at all, or of those who did, most seemed to struggle with showing the relationship between the log form of the equation and t V ab = . It was very rare for full marks to be achieved, with most securing around half of the available marks in total for the question. In part (a) many candidates were able to correctly calculate the value for ‘a’ and ‘b’, however, they lost marks due to the fact that they did not appreciate the “show that” nature of the question. Missing out writing both log log log t V a b = + and log log log V a t b = + was common and this resulted in the first mark. As it was an incomplete solution, candidates also lost the final mark, too. A number of candidates rounded both of their values to the nearest whole number, which was only required for a. This was only penalised if they never had 1.18 b = at some point. Usually, candidates had lost the first mark anyway from insufficient working, so it rarely was the reason for not achieving full marks.
Common mistakes
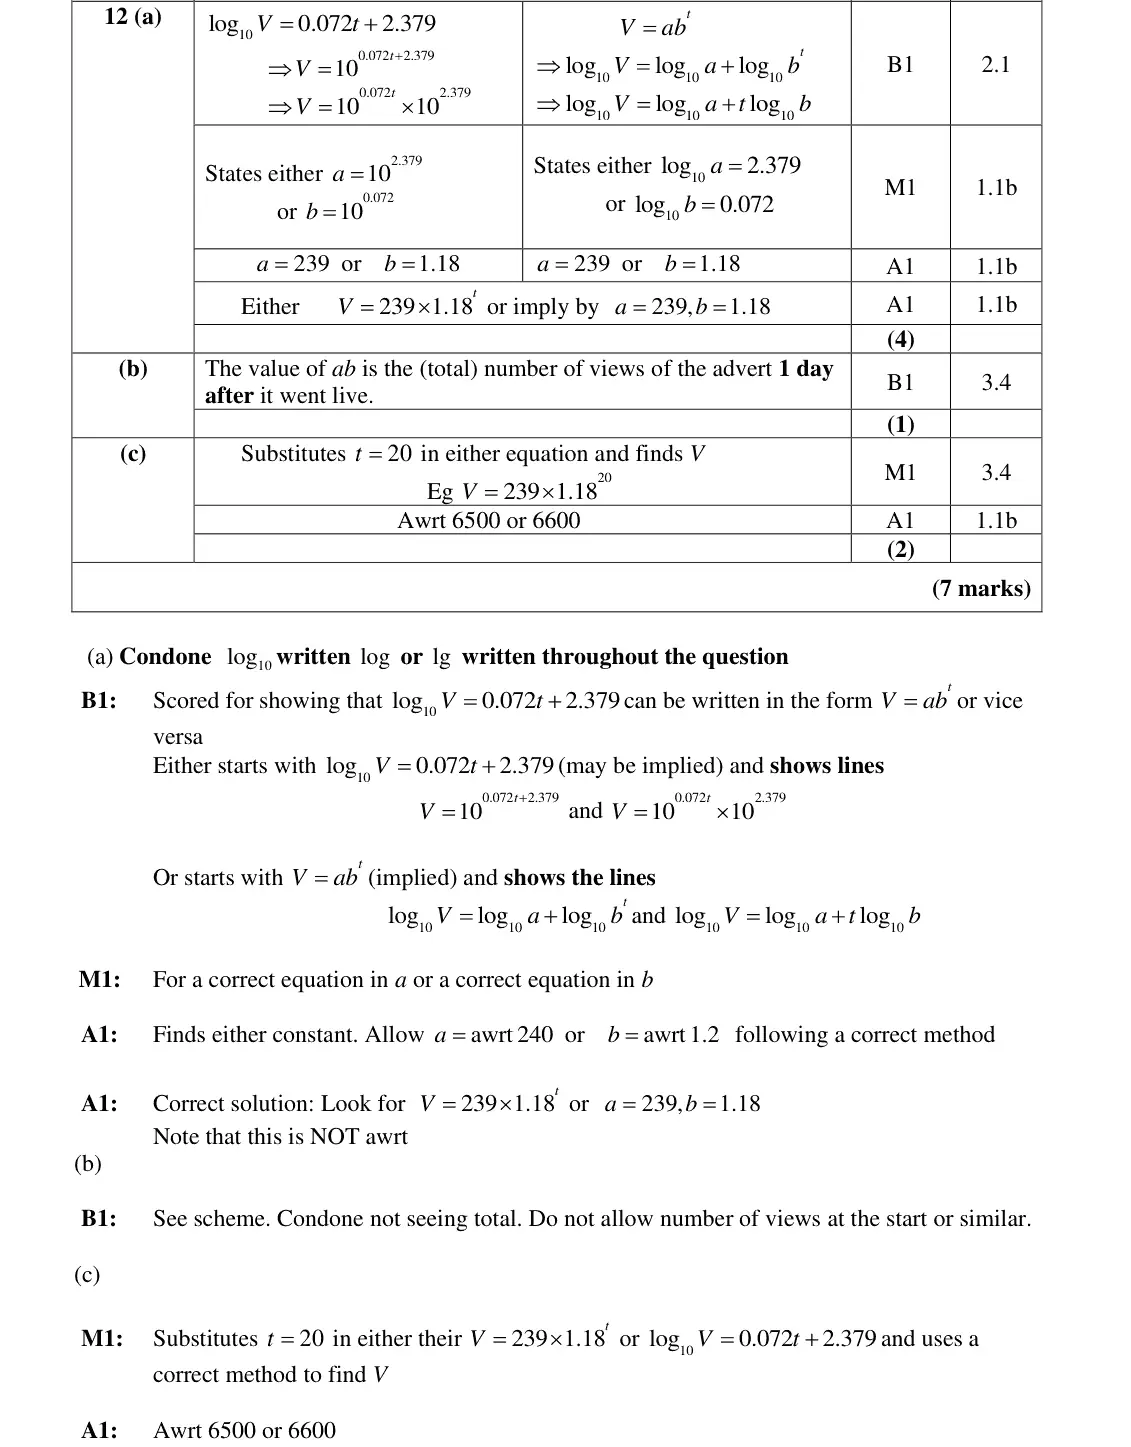
must show V = 10^(0.072t) × 10^2.379 (or log V = log a + t log b)
a = 239, b = 1.18
only a is to the nearest whole number
Oct 2020 · AS Paper 1 · Q12(b)1 mark
Mark scheme (whole question; this part is marked with the orange bar)
Examiner's comment
This question proved to be more challenging for candidates than was anticipated. There were a large number of candidates who did not attempt the question at all, or of those who did, most seemed to struggle with showing the relationship between the log form of the equation and t V ab = . It was very rare for full marks to be achieved, with most securing around half of the available marks in total for the question. Very few candidates were successful in part (b). Most went with a standard response of stating it was the “the initial number of views” which was incorrect as t could not be 0. Had they just copied the relevant part at the start of the question replacing t with one, they would have scored the mark. 11
Common mistakes
ab is the total views 1 day after the advert went live (t = 1), not the initial number of views (t ≥ 1)
Oct 2020 · AS Paper 1 · Q12(c)2 marks
Mark scheme (whole question; this part is marked with the orange bar)
Examiner's comment
This question proved to be more challenging for candidates than was anticipated. There were a large number of candidates who did not attempt the question at all, or of those who did, most seemed to struggle with showing the relationship between the log form of the equation and t V ab = . It was very rare for full marks to be achieved, with most securing around half of the available marks in total for the question. In part (c) candidates could either use their formula from part (a) or use the formula given in the question, so it did not rely on the candidates getting correct answers to part (a) or (b). The majority of candidates who attempted this question were successful, or at least gained the method mark, if their values for a and b were incorrect. When using the given formula, several candidates were able to calculate the value of 10 log V , however, they did not know how to then proceed to calculate the value of V.
Common mistakes
V = 239 × 1.18²⁰ or 10^(0.072 × 20 + 2.379)
about 6500 to 2 s.f.
finding log V and not converting
Oct 2020 · Paper 2 · Q9(a)4 marks
Mark scheme (whole question; this part is marked with the orange bar)
Examiner's comment
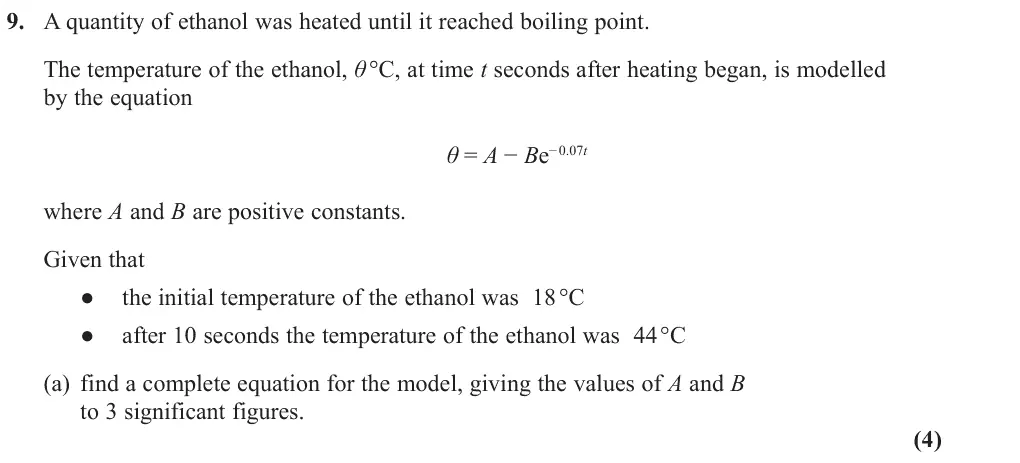
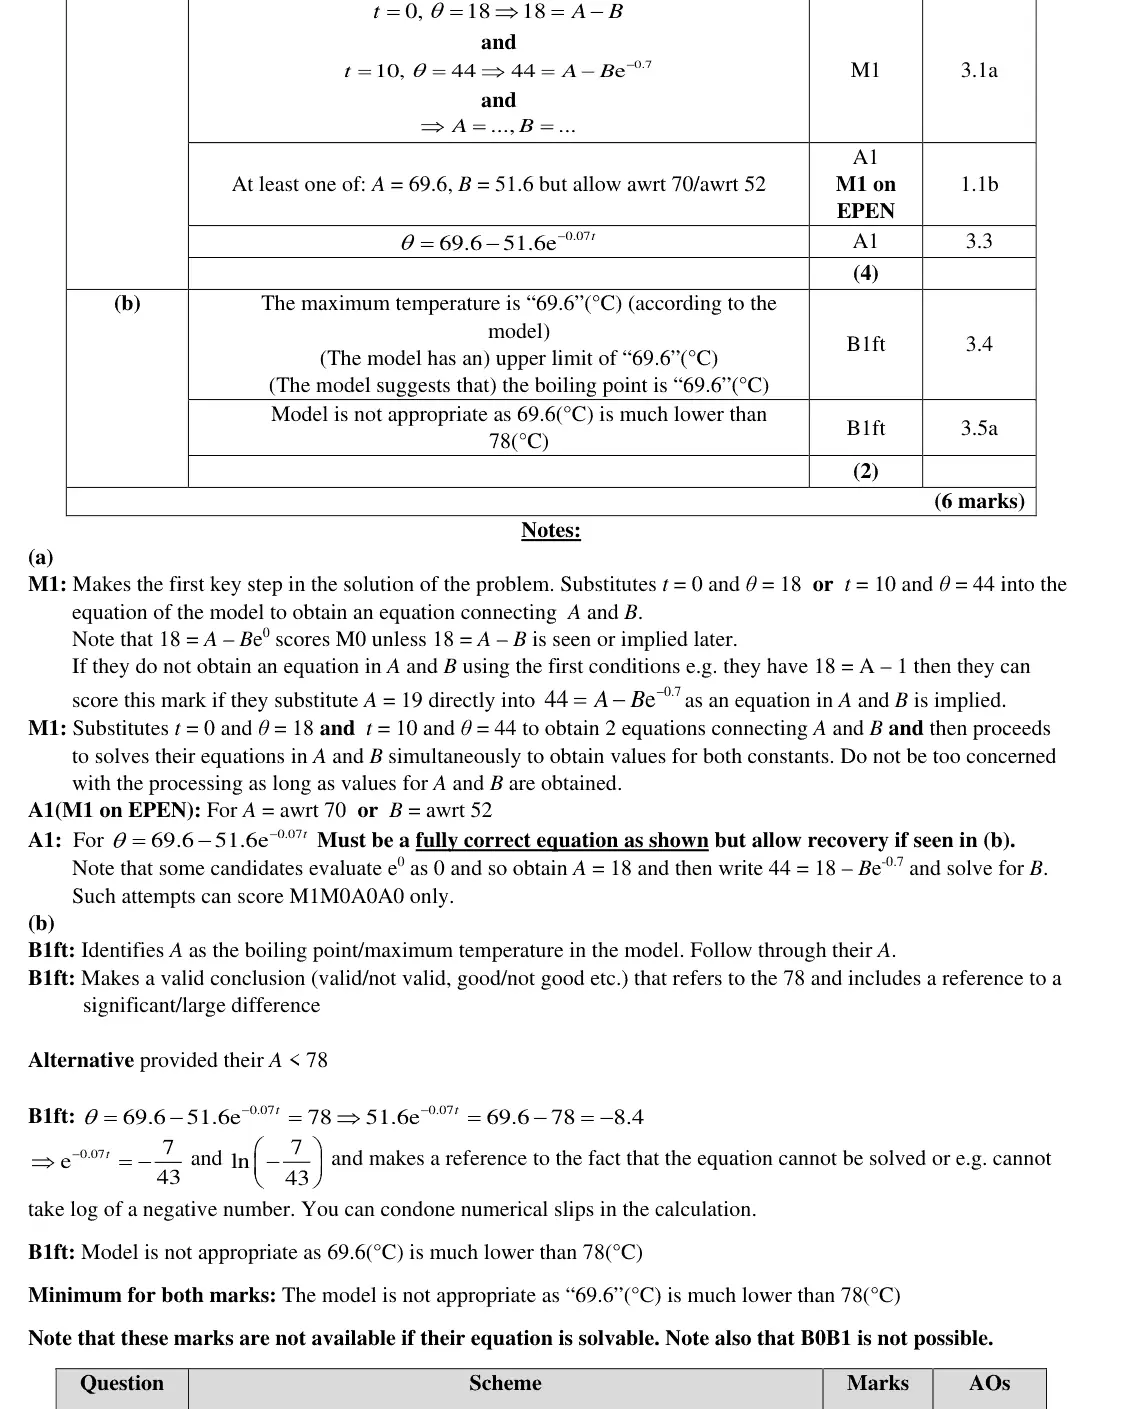
This question proved to be quite challenging for many candidates and awarding full marks was rare. Nonetheless, most candidates recognised the need to set up simultaneous equations in A and B and linking A and B. Usually problems arose initially with the 18 = 𝐴𝐴 - 𝐵𝐵𝑒𝑒0 which was frequently were often able to use the information provided in the question to establish at least one equation incorrectly simplified to 18 = 𝐴𝐴 or sometimes 18 = 𝐴𝐴 - 1. Indeed, some candidates assumed immediately that A = initial temperature = 18 as is sometimes the case in modelling questions. Such errors proved costly as candidates were then limited to one mark from four in part (a). It was unphased by the presence of e-0.7as a coefficient of B. Often this was rewritten as a decimal pleasing to see that most candidates who managed to set up the two equations correctly were often approximation before solving for B. This was acceptable although some candidates did not provide sufficiently accurate approximations and so lost a mark for values of A and B that were not accurate to 3sf (51.7 and 69.7 were sometimes seen). Candidates also lost a mark here for being too accurate and giving their final values of A and B to 3dp for example. Candidates should be advised to check the question carefully for the required degree of accuracy. Unfortunately, it was quite common for candidates to find correct values for A and B but then fail to state the equation of the model in full which led to the loss of one mark. Part (b) was quite discriminating. Occasionally, candidates noted that the maximum temperature 𝜃𝜃(𝑡𝑡) = 78 and attempt to solve for 𝑡𝑡. Some candidates were unable to solve the equation but according to the model is 69.6°C but the most common approach taken by candidates was to set allowed their work to peter out without comment. However, a good number of candidates correctly noted that a solution was not possible - recognising that the model would not reach the boiling point conveniently disappear in order to obtain a solution for 𝑡𝑡 at all costs. Such candidates usually of ethanol which was sufficient for one mark. It was also common however to see minus signs obtained 𝑡𝑡 = 25.9 and concluded that the model would be appropriate up to this time; or obtained 𝑡𝑡= -25.9 noting that ‘time cannot be negative’. A significant number of responses gave general comments relating to the model being inappropriate once ethanol’s boiling point was reached - such sometimes resulted in a version of 𝜃𝜃(𝑡𝑡) = 78 which could legitimately be solved which precluded responses were not creditworthy. Unfortunately, errors in the calculation of A and B from part (a) the marks in (b). It was extremely rare to award the second mark in part (b) as candidates almost always failed to acknowledge that the model was inappropriate because the maximum value of 69.6°C is significantly lower than the boiling point of 78°C.
Common mistakes
t = 0 gives 18 = A − B (e⁰ = 1, not 0
A is not the initial temperature)
solve simultaneously with 44 = A − Be^−0.7
A = 69.6, B = 51.6 to 3 s.f.
state the complete equation
Oct 2020 · Paper 2 · Q9(b)2 marks
Mark scheme (whole question; this part is marked with the orange bar)
Examiner's comment
This question proved to be quite challenging for many candidates and awarding full marks was rare. Part (b) was quite discriminating. Occasionally, candidates noted that the maximum temperature 𝜃𝜃(𝑡𝑡) = 78 and attempt to solve for 𝑡𝑡. Some candidates were unable to solve the equation but according to the model is 69.6°C but the most common approach taken by candidates was to set allowed their work to peter out without comment. However, a good number of candidates correctly noted that a solution was not possible - recognising that the model would not reach the boiling point conveniently disappear in order to obtain a solution for 𝑡𝑡 at all costs. Such candidates usually of ethanol which was sufficient for one mark. It was also common however to see minus signs obtained 𝑡𝑡 = 25.9 and concluded that the model would be appropriate up to this time; or obtained 𝑡𝑡= -25.9 noting that ‘time cannot be negative’. A significant number of responses gave general comments relating to the model being inappropriate once ethanol’s boiling point was reached - such sometimes resulted in a version of 𝜃𝜃(𝑡𝑡) = 78 which could legitimately be solved which precluded responses were not creditworthy. Unfortunately, errors in the calculation of A and B from part (a) the marks in (b). It was extremely rare to award the second mark in part (b) as candidates almost always failed to acknowledge that the model was inappropriate because the maximum value of 69.6°C is significantly lower than the boiling point of 78°C.
Common mistakes
A = 69.6 is the maximum temperature in the model
the model is not appropriate because 69.6 °C is much lower than 78 °C
general comments about boiling not credited
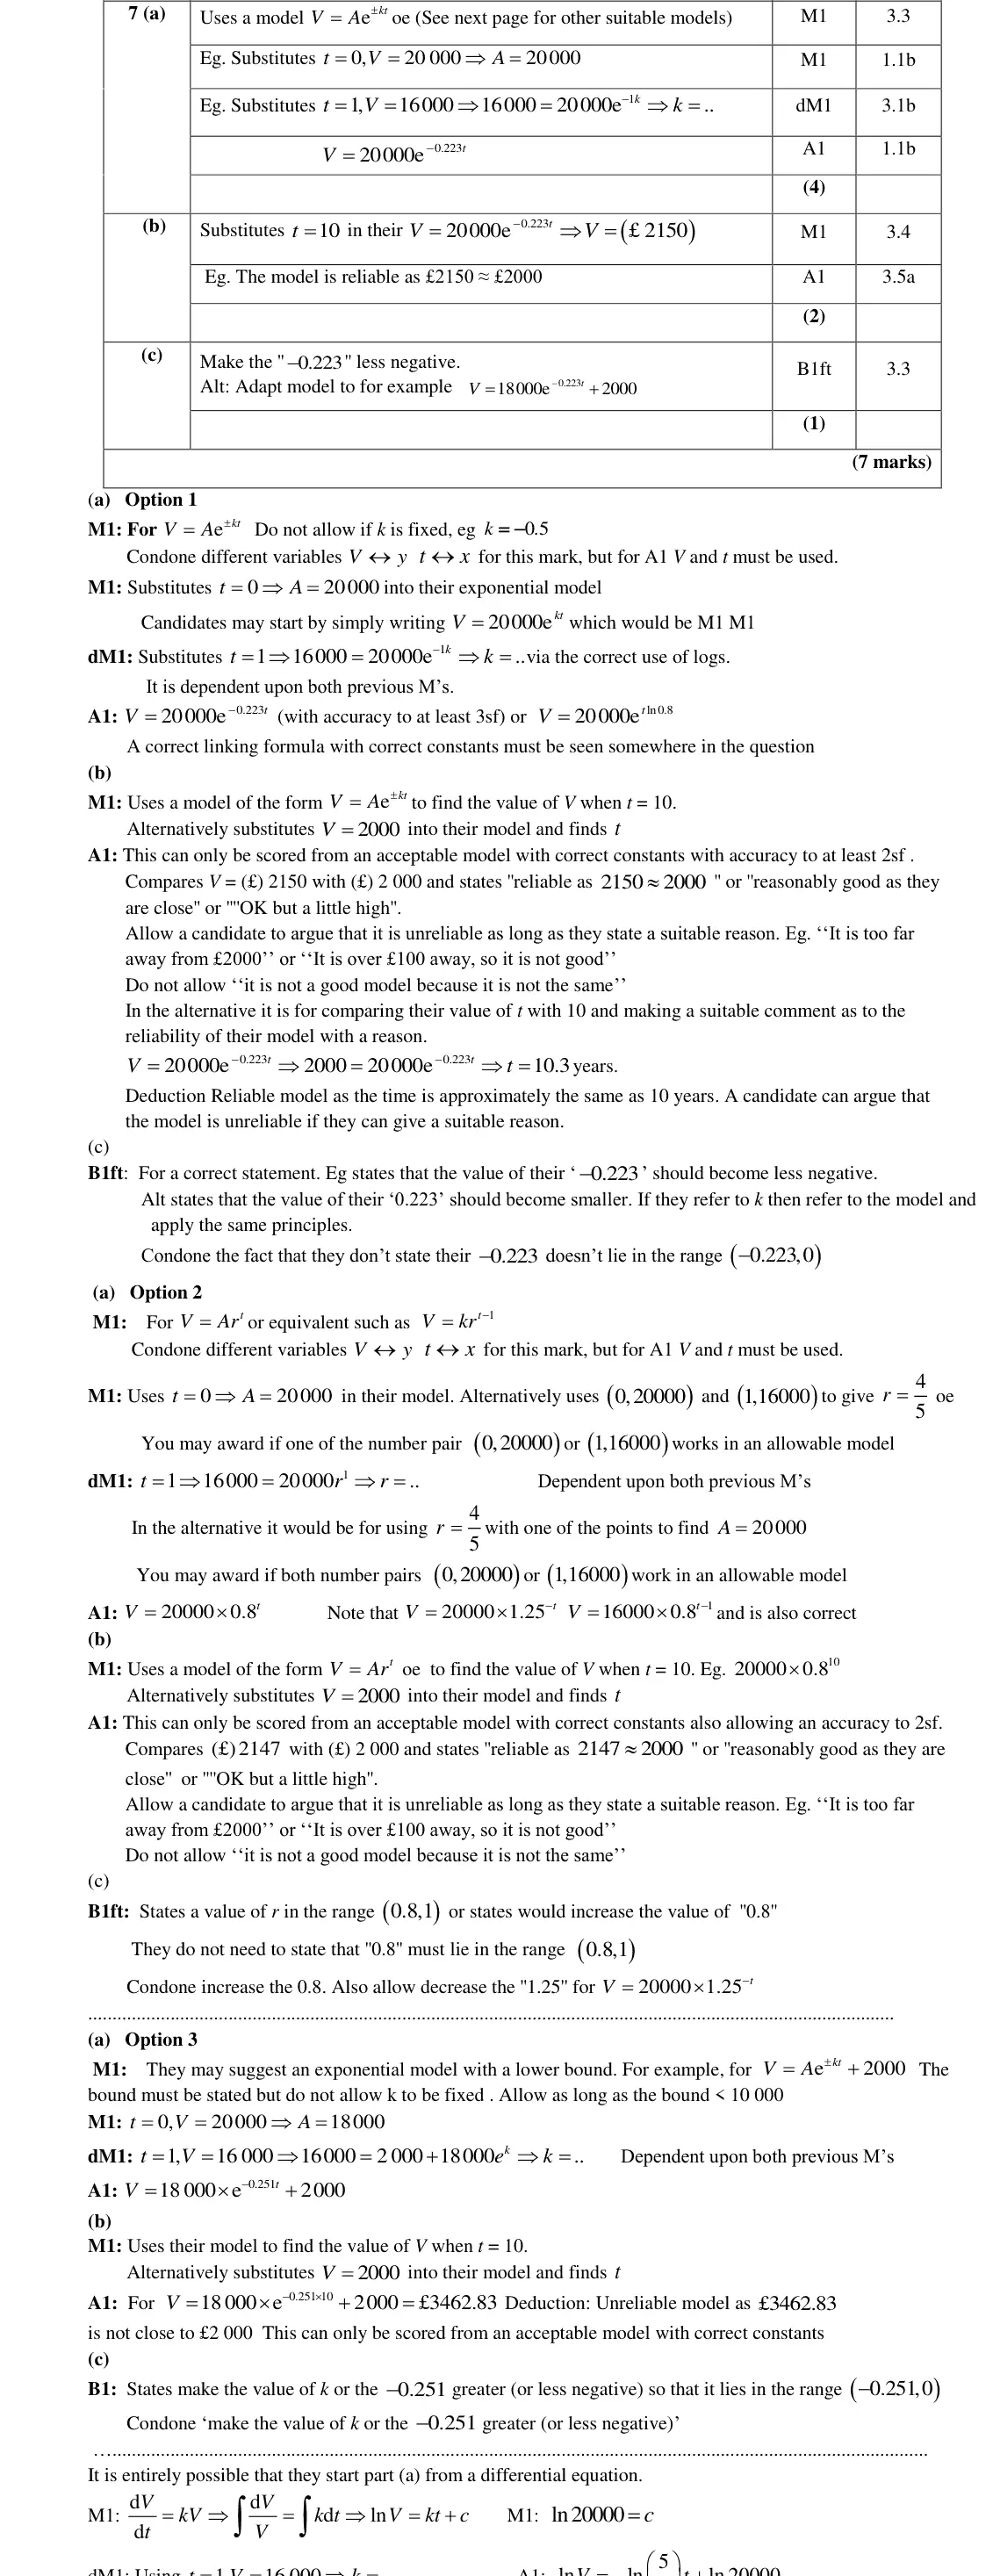
June 2019 · Paper 1 · Q7(a)4 marksEasy
Mark scheme (whole question; this part is marked with the orange bar)
Examiner's comment
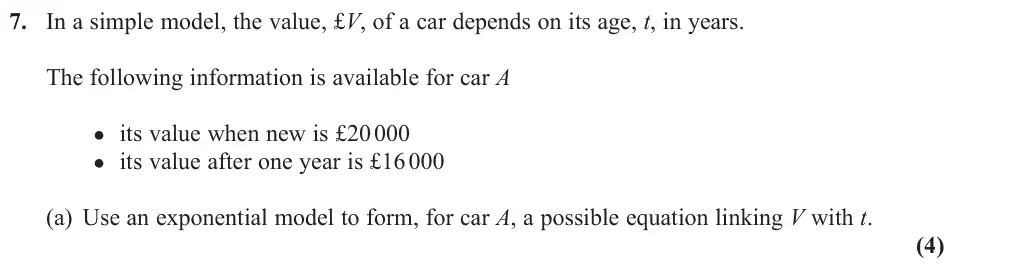
It was pleasing to see that most candidates attempted to form an exponential model using a suitable equation. This is one of the new topics in the specification and candidates who didn't gain any marks on this question, generally did so because they did not attempt it, or that they tried to use a non-exponential model. In part (a) t V Ar or kt V Ae were the most popular types of correct models that candidates opted for. However, some methods were often muddled or poorly shown, but many candidates who used a correct model were able to proceed to obtain correct values for their constants. Those candidates who used the model kt V Ae frequently gave the constant k as a log and errors sometimes occurred with the sign of this constant. Errors in calculating constants with the model t V Ar often occurred when candidates used 1 t V Ar instead.
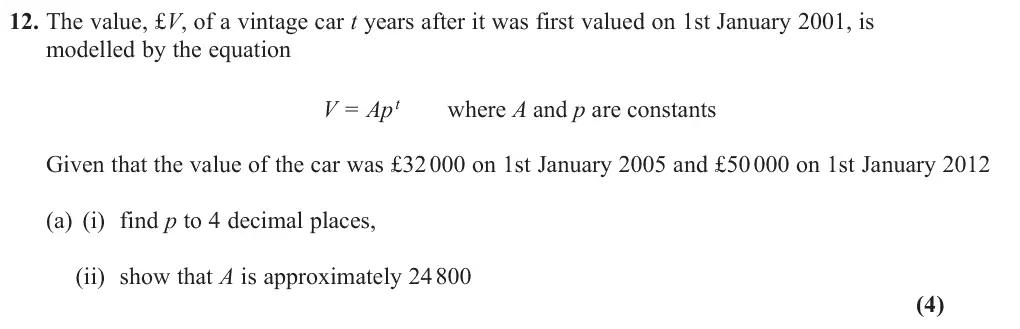
Common mistakes
V = Ae^(kt) or Arᵗ
A = 20000 from t = 0
k = ln 0.8 = −0.223 (sign errors)
using Ar^(t − 1) is wrong
June 2019 · Paper 1 · Q7(b)2 marksEasy
Mark scheme (whole question; this part is marked with the orange bar)
Examiner's comment
It was pleasing to see that most candidates attempted to form an exponential model using a suitable equation. This is one of the new topics in the specification and candidates who didn't gain any marks on this question, generally did so because they did not attempt it, or that they tried to use a non-exponential model. In part (b) candidates who correctly answered part (a) usually understood that for this section they needed to substitute 10 t into their model, and most were able to do this. Many candidates then proceeded to make a sensible comparison of the value gained by their model with the actual value in order to comment on the model’s reliability (sometimes calculating and commenting on % error). The final mark, however, was frequently lost because answers were too vague, without a clear comparison or assessment of reliability being made. Some candidates appeared to think that a model was only acceptable if it gave the exact real value.
Common mistakes
t = 10 gives about £2150
make a clear comparison with £2000 and a conclusion on reliability
a model need not give the exact value
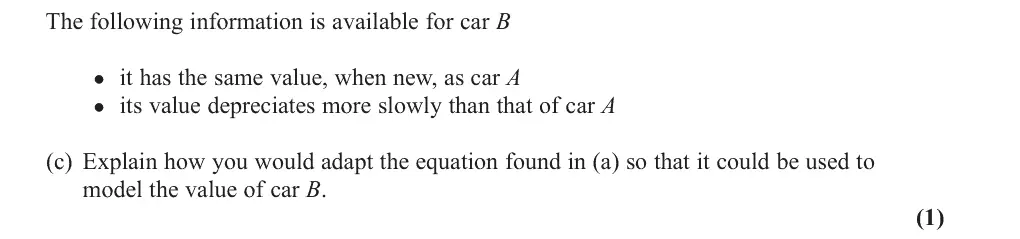
June 2019 · Paper 1 · Q7(c)1 markEasy
Mark scheme (whole question; this part is marked with the orange bar)
Examiner's comment
It was pleasing to see that most candidates attempted to form an exponential model using a suitable equation. This is one of the new topics in the specification and candidates who didn't gain any marks on this question, generally did so because they did not attempt it, or that they tried to use a non-exponential model. Most candidates who attempted part (c) understood which of their two constants would need to be altered, although marks were lost either because the answer given just said the constant needed to be changed or because they wrongly identified whether the constant needed to be decreased/increased. This was more of a difficulty for those candidates who had used the model kt V Ae , because candidates were often dealing with negative constants and/or constants given as logs so the phrases used were not always mathematically correct. An example was often useful to convey what the candidate meant where there was ambiguity. Candidates who had gone with model t V Ar were less likely to make an error in judging whether their constant should increase or decrease.
Common mistakes
make k less negative (or r closer to 1)
just "change the constant" or the wrong direction scores 0
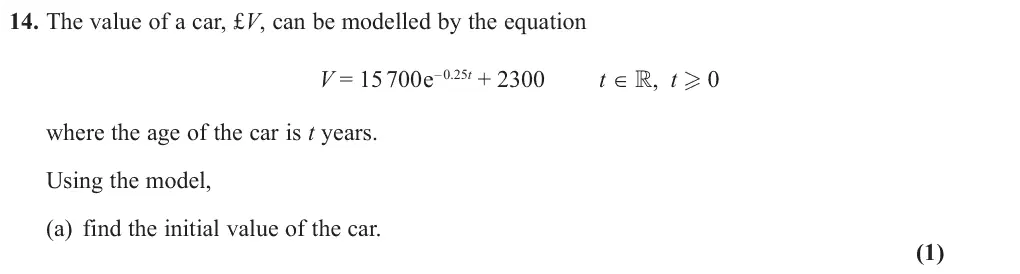
June 2019 · AS Paper 1 · Q14(a)1 markMedium
Mark scheme (whole question; this part is marked with the orange bar)
Examiner's comment
In general parts (a), (c) and (d) were well attempted, with many scoring the three available marks here and nothing else. Part (a) was well answered by most. It was rare to see any working out – just the correct answer stated. Very occasionally £2300 was seen here.
Common mistakes
t = 0 gives £18 000 (not £2300)
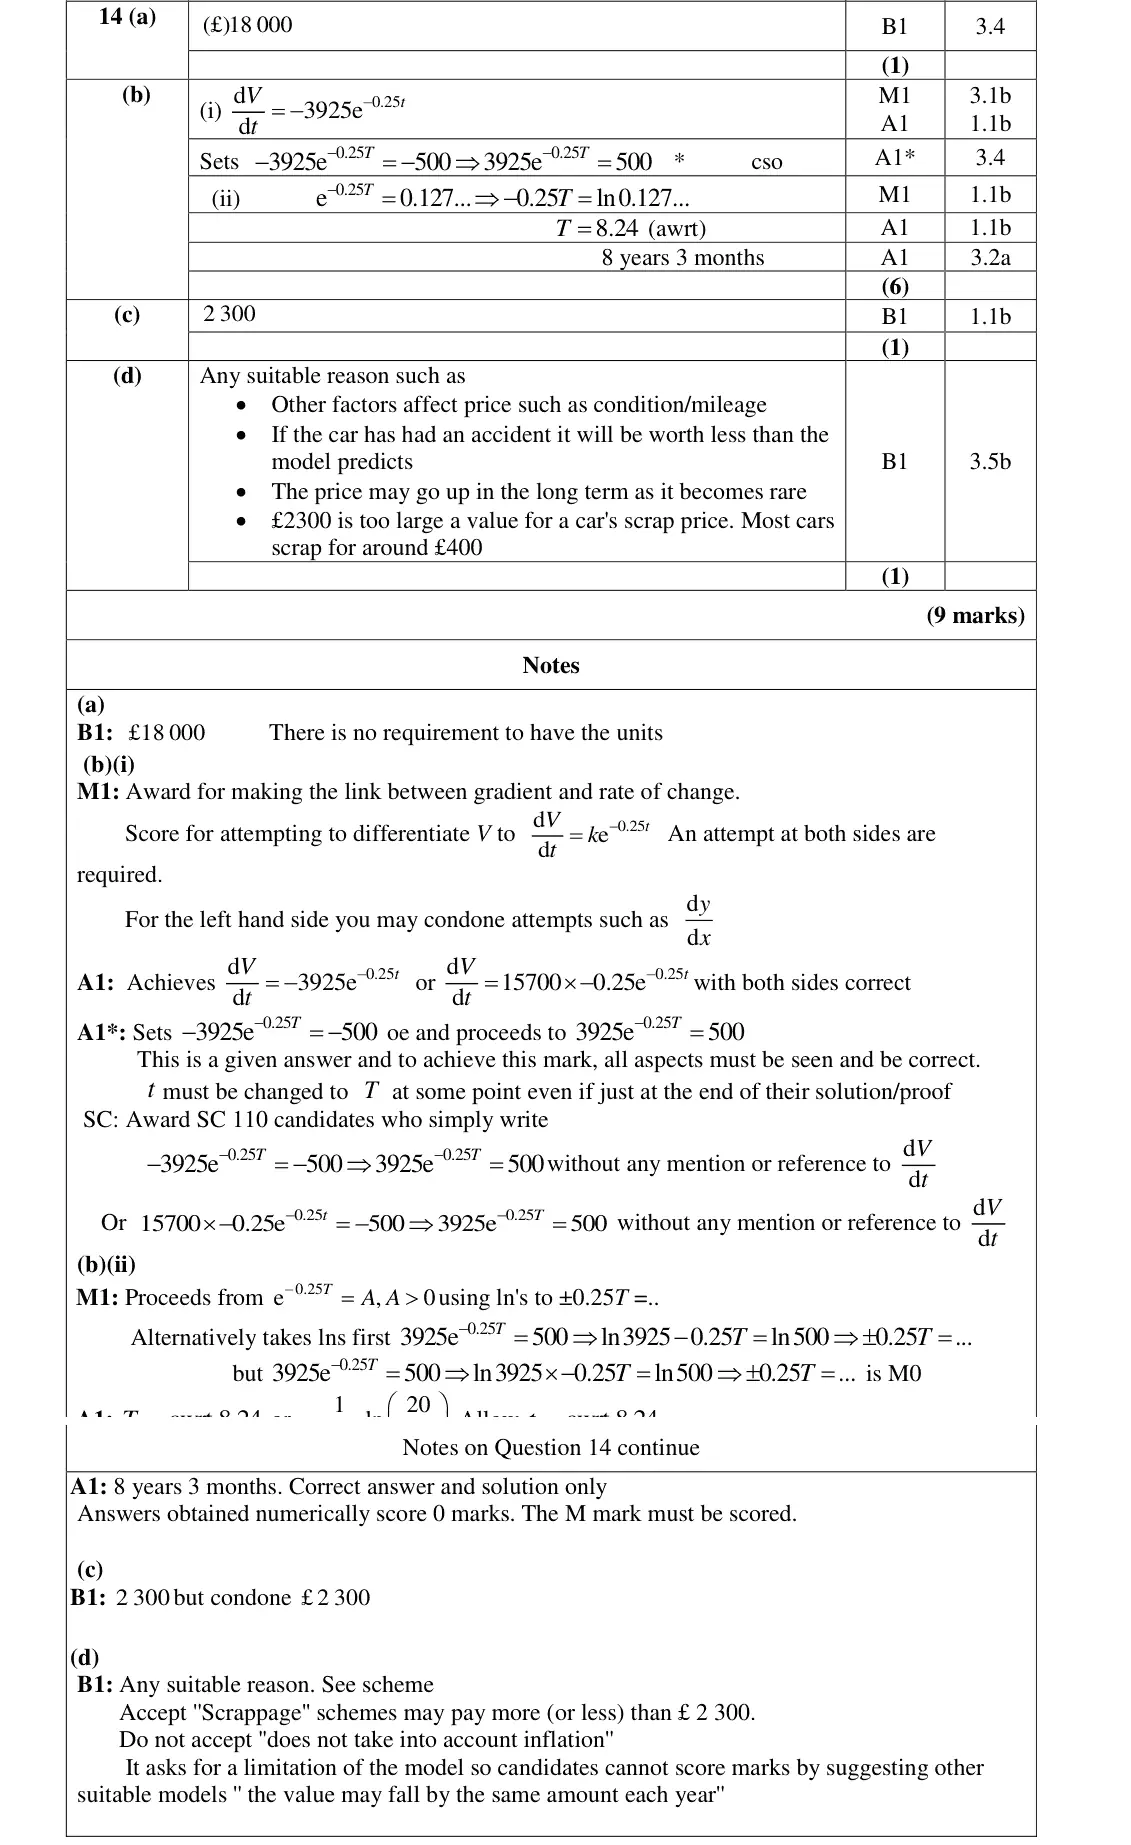
June 2019 · AS Paper 1 · Q14(b)6 marksMedium
Mark scheme (whole question; this part is marked with the orange bar)
Examiner's comment
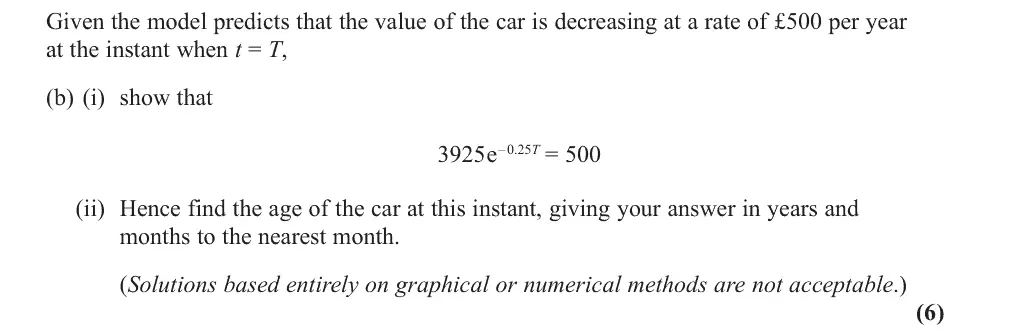
Part (b) was the part candidates found most challenging, and many left it completely blank. Of those that attempted part (i), most knew to multiply by 0.25, but many struggled to construct a sufficiently thorough explanation to support their work to arrive at the given equation. The most common mistake was getting confused by the negative sign. Some candidates didn’t seem to have recognised that a decreasing rate of change would be negative, and quite often the negative sign was just ignored. Often the given equation was relied upon too heavily, with some appearing to work backwards – the mark scheme required some evidence that they had differentiated, and as a result, many scored no marks due to no reference to dV/dt (or at least dy/dx for the first M1). Occasionally candidates who had otherwise been successful here were not awarded the final accuracy mark due to a failure to replace t with T. It was encouraging to see that even when candidates were unable to make progress with (b)(i), they frequently had a go at part (ii), often with some success. Candidates’ use of logarithms was broadly good, with only a few forgetting to divide by 3925 before introducing logs. If attempted, most were able to get to T=8.24. There were several instances of this then being written as 8 years 2 months, instead of the correct 8 years 3 months, but the majority of those got to the decimal answer were able to convert it successfully.
Common mistakes
dV/dt = −3925e^(−0.25t) must be seen and set equal to −500 (decreasing: negative rate)
replace t by T
divide by 3925 before taking ln
T = 8.24 is 8 years 3 months, not 2 months
June 2019 · AS Paper 1 · Q14(c)1 markMedium
Mark scheme (whole question; this part is marked with the orange bar)
Examiner's comment
In general parts (a), (c) and (d) were well attempted, with many scoring the three available marks here and nothing else. A good understanding of the exponential graph was clear in part (c) as the vast majority scored the mark here for (£)2300. Occasionally 500 was seen here, perhaps misinterpreting the question. Responses to (d) were many and varied. Frequent correct answers included mentioning damage to the vehicle, variability in mileage, and the potential for the car to become an antique. For those who weren’t awarded the mark the most popular responses were that it only made predictions based on year, not months or days, claiming the car’s value may not follow a linear pattern of decrease and predicting that the car’s value will eventually become zero.
Common mistakes
as t → ∞ the exponential term → 0, so A = 2300 (not 500)
June 2019 · AS Paper 1 · Q14(d)1 markMedium
Mark scheme (whole question; this part is marked with the orange bar)
Examiner's comment
In general parts (a), (c) and (d) were well attempted, with many scoring the three available marks here and nothing else.
Common mistakes
e.g. condition, mileage, accident damage, a classic car may rise in value
not "ignores inflation" or "should be linear"
June 2018 · Paper 1 · Q12(a)4 marks
Mark scheme (whole question; this part is marked with the orange bar)
Examiner's comment
t This question, based upon the formula modelled the value of a car in £'s against the , V ap time in years after 1st January 2001. Part (a) was very well answered by the majority of students. Most chose the correct values of t and V and successfully solved a pair of simultaneous equations. Common errors involved using incorrect values for t or failing to show that A was approximately 24 800. It is important in answering questions such as (b) that students are precise about the language and words that they choose. For example, for (b)(i) the statement was required to
Common mistakes
t = 4 and t = 11 (years after 2001), not 5 and 12
divide to get p⁷ = 50000/32000, p = 1.0658
show A between 24 795 and 24 805 before ≈ 24 800
June 2018 · Paper 1 · Q12(b)2 marks
Mark scheme (whole question; this part is marked with the orange bar)
Examiner's comment
t This question, based upon the formula modelled the value of a car in £'s against the , V ap language and words that they choose. For example, for (b)(i) the statement was required to reference ''the car'', ''its value'' and the ''initial time''. In part (b)(ii), ''the amount the value of the car was increasing by'' was common and scored 0 marks. For this part, a clear answer would be ''it is the rate at which the cars value is increasing each year'' or ''the cars value is increasing by 6.6% a year''.
Common mistakes
A: value of the car on 1st January 2001 (must mention car, value and initial time)
p: factor by which the value rises each year (6.6% a year)
"how much the value rises by" scores 0
June 2018 · Paper 1 · Q12(c)4 marks
Mark scheme (whole question; this part is marked with the orange bar)
Examiner's comment
t This question, based upon the formula modelled the value of a car in £'s against the , V ap In part (c), students generally scored the first 3 marks by correctly using logarithms and proceeding to t =21.8 or 21.9. Most students then thought that the year must be 2023 instead of 2022 as they had rounded 21.8 to 22 and added it to 2001.
Common mistakes
1.0658^t = 100000/24800 so t = 21.8 or 21.9
the year is 2022, not 2023 (rounding t to 22 and adding to 2001)
June 2018 · AS Paper 1 · Q13(a)4 marks
Mark scheme (whole question; this part is marked with the orange bar)
Examiner's comment
Although this was another new question, it was less well attempted than others with more students leaving this question blank, or starting the question but not gaining any marks. (a) where students correctly identified the link with p, q and the formula, they were able to correctly work out the values of p and q. The most common method was to convert to powers of 10. A common error was incorrectly rounding p = 63095. to 6310, instead of 63100. Although this was not penalised in part (a), it did often lead to a wrong answer in part (c). A small number of students converted the question into logs and a few also substituted values in for t and used logs to solve. Part (b) was attempted by the majority of students, even for those who failed to attempt part (a). Part (i) was well answered with the majority of students identifying p as the initial value of the painting. A few students did not put their statement in the context of the model. In part (ii) common mistakes were to state it was the increase in value, rather than to link it to the rate or proportional increase, or to state it was the gradient of the line. Very few students explained that the value of the painting would rise by 12.2% a year or that 1.122 was the decimal multiplier representing the year on year increase in value. part (a) often led to the loss of the accuracy mark here.
Common mistakes
log V = log p + t log q, so p = 10^4.8 = 63 100 and q = 10^0.05 = 1.122 (4 s.f.)
rounding p to 6310 is a common slip that spoils (c)
June 2018 · AS Paper 1 · Q13(b)2 marks
Mark scheme (whole question; this part is marked with the orange bar)
Examiner's comment
Although this was another new question, it was less well attempted than others with more students leaving this question blank, or starting the question but not gaining any marks. Part (b) was attempted by the majority of students, even for those who failed to attempt part (a). Part (i) was well answered with the majority of students identifying p as the initial value of the painting. A few students did not put their statement in the context of the model. In part (ii) common mistakes were to state it was the increase in value, rather than to link it to the rate or proportional increase, or to state it was the gradient of the line. Very few students explained that the value of the painting would rise by 12.2% a year or that 1.122 was the decimal multiplier representing the year on year increase in value.
Common mistakes
p is the value on 1 January 1980 (initial value)
q is the proportional increase per year (rises 12.2% a year), not "the amount" it rises by or the gradient of the line
June 2018 · AS Paper 1 · Q13(c)2 marks
Mark scheme (whole question; this part is marked with the orange bar)
Examiner's comment
Although this was another new question, it was less well attempted than others with more students leaving this question blank, or starting the question but not gaining any marks. penalised in part (a), it did often lead to a wrong answer in part (c). A small number of students converted the question into logs and a few also substituted values in for t and used logs to solve. Part (c) could be answered without values for p and q and some students scored just marks in this part of the question. When attempted it was generally done well. The follow through error mentioned in
Common mistakes
t = 30 (not 2010)
V ≈ £2 000 000 to the nearest hundred thousand
can use log V = 0.05 × 30 + 4.8 without p and q
June 2018 · Paper 2 · Q14(a)1 mark
Mark scheme (whole question; this part is marked with the orange bar)
Examiner's comment
This was the most demanding question on the paper. Parts (a) and (d) were accessible to many students. Most students made some creditable progress in part (b), but many students found it difficult to access the demanding material in part (c). In part (a), most students evaluated or deduced that there were 90 mice at the start of the study.
Common mistakes
t = 0 gives 900/10 = 90 mice
June 2018 · Paper 2 · Q14(b)4 marks
Mark scheme (whole question; this part is marked with the orange bar)
Examiner's comment
This was the most demanding question on the paper. Parts (a) and (d) were accessible to many students. Most students made some creditable progress in part (b), but many students found it difficult to access the demanding material in part (c). In part (b), most students used either the chain rule or the quotient rule in their attempt to find an expression for d . d N t There were many incorrect attempts at the chain rule such as 0.25 0.25 2 d 6300e (3 7e ) d t t N t or 0.25 2 d 1575(3 7e ) d t N t while the most common incorrect attempt at the quotient rule was 0.25 0.25 0.25 2 d (3 7e )(1) 1575e . d (3 7e ) t t t N t Although some impressive algebra was seen in manipulating a correct 0.25 0.25 2 d 1575e d (3 7e ) t t N t to achieve d (300 ) d 1200 N N N t , many students were unsuccessful in their attempts at eliminating t or the 0.25 e t term. Some students substituted 0.25 900 3 7e t N into d (300 ) d 1200 N N N t and used algebra to give 0.25 0.25 2 d 1575e d (3 7e ) t t N t , and provided some indication that their proof was complete. Some students differentiated N by using implicit differentiation while other students attempted to rearrange the given equation for N to make t the subject before finding an expression for d . d t N A few students were successful in applying an alternative method of solving the differential equation d (300 ) d 1200 N N N t to give 0.25 900 . 3 7e t N
Common mistakes
chain rule on 900(3 + 7e^(−0.25t))⁻¹ (common errors in the chain or quotient rule)
eliminate e^(−0.25t) using N
alternatively substitute N into RHS and show LHS = RHS with a conclusion
June 2018 · Paper 2 · Q14(c)4 marks
Mark scheme (whole question; this part is marked with the orange bar)
Examiner's comment
This was the most demanding question on the paper. Parts (a) and (d) were accessible to many students. Most students made some creditable progress in part (b), but many students found it difficult to access the demanding material in part (c). In part (c), most students misinterpreted the question and instead applied a method to find the time T for the maximum value of N, rather than the time T at which the rate of growth d d N t was a maximum. Many students, therefore, used 300 N and manipulated 0.25 900 300 3 7e T to give 0.25 e 0. T A few students differentiated d , d N t with most writing 2 2 d , d N t which was condoned, and solved the equation 1 (300 2 ) 1200 N to give 150. N It was rare to see students using the symmetry of the quadratic function (300 ) 1200 N N to deduce that 150. N Although some students gave their answer to part (c) as 150, T most students who progressed this far solved the equation 0.25 900 150 3 7e T to give the correct value for T.
Common mistakes
maximise dN/dt, not N (common error using N = 300)
N(300 − N)/1200 is maximum at N = 150 by symmetry or d²N/dt² = 0
e^(−0.25T) = 3/7 so T = 4 ln(7/3) ≈ 3.4 months
June 2018 · Paper 2 · Q14(d)1 mark
Mark scheme (whole question; this part is marked with the orange bar)
Examiner's comment
This was the most demanding question on the paper. Parts (a) and (d) were accessible to many students. Most students made some creditable progress in part (b), but many students found it difficult to access the demanding material in part (c). In part (d), many students deduced 300 P with only a few students deducing 299, P which was also accepted.
Common mistakes
as t → ∞, e^(−0.25t) → 0 so N → 300 (299 also accepted)
Find an Edexcel maths tutor
Stuck on this? Book a trial session with an Edexcel specialist.