Oct 2020: AS AS Paper 2 Section A: Statistics

30 marks · 13 question parts · Question paper, mark scheme and examiner's report on Pearson's site

Question by question

QTopicMarksDifficulty
1 Data presentation: histograms, box plots, measures and outliers 4 —
2(a) Data presentation: histograms, box plots, measures and outliers, The large data set 1 —
2(b) Data presentation: histograms, box plots, measures and outliers, Correlation and regression 2 —
2(c) Correlation and regression 1 —
2(d) Correlation and regression, The large data set 1 —
3 Discrete distributions and the binomial distribution, Probability, including conditional probability 6 —
4(a) Sampling 1 —
4(b) Sampling 2 —
4(c) Data presentation: histograms, box plots, measures and outliers 2 —
4(d) Data presentation: histograms, box plots, measures and outliers 2 —
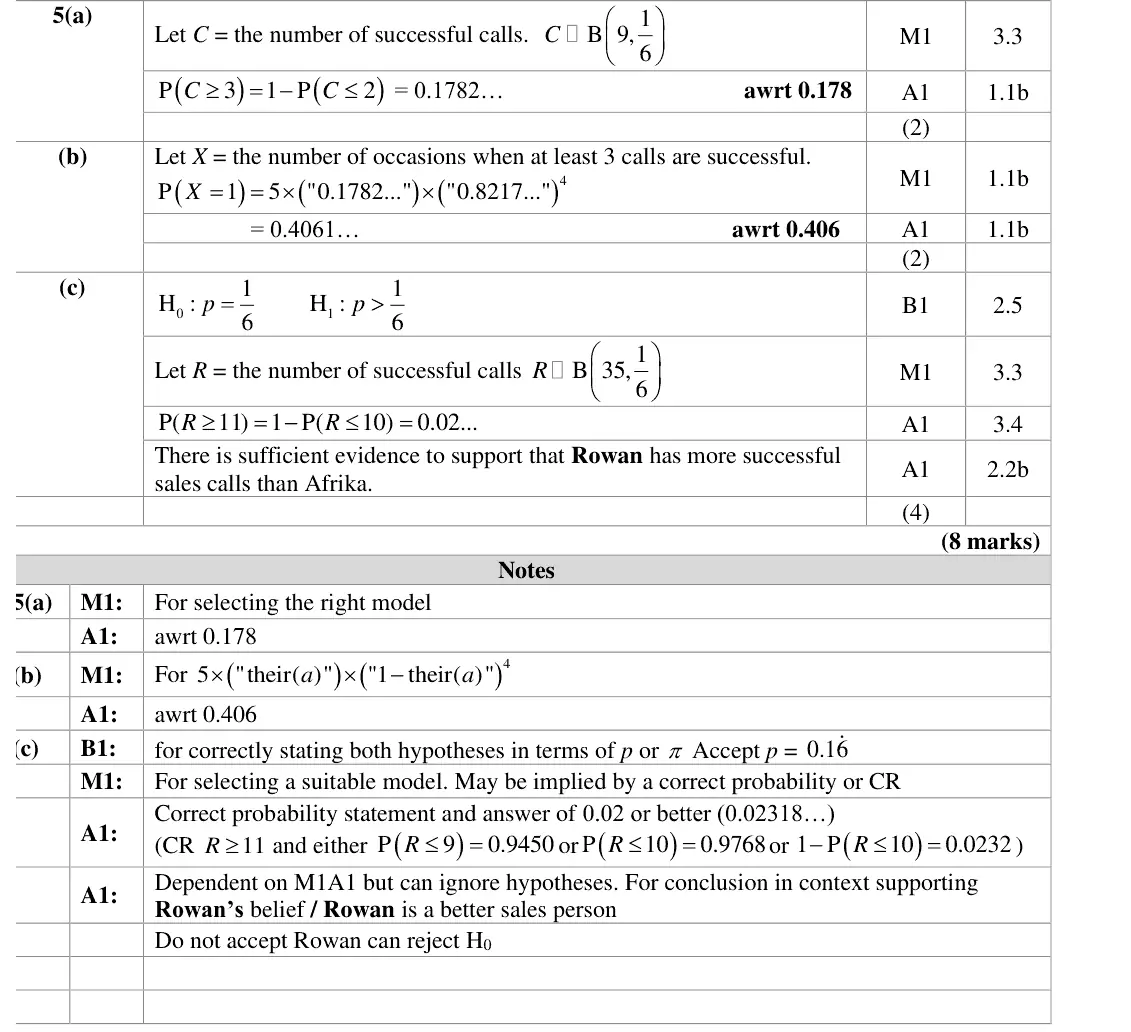
5(a) Discrete distributions and the binomial distribution 2 —
5(b) Discrete distributions and the binomial distribution 2 —
5(c) Hypothesis testing, Discrete distributions and the binomial distribution 4 —

The questions

12(a)2(b)2(c)2(d)34(a)4(b)4(c)4(d)5(a)5(b)5(c)
Oct 2020 · AS Paper 2 (Statistics) · Q1 4 marks data presentation
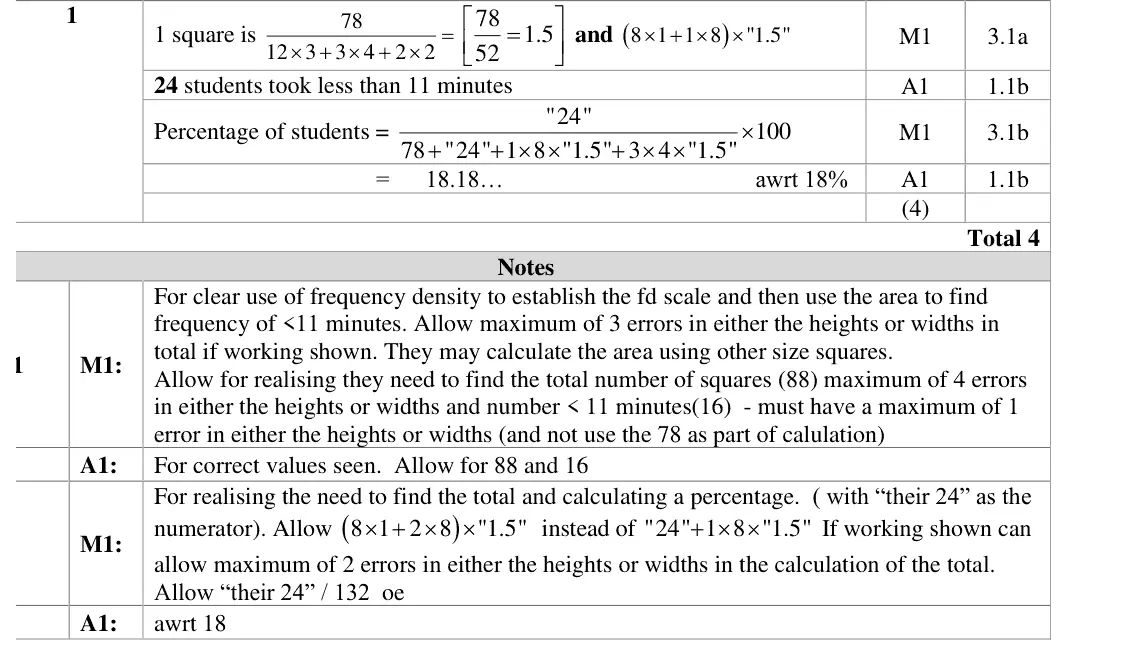
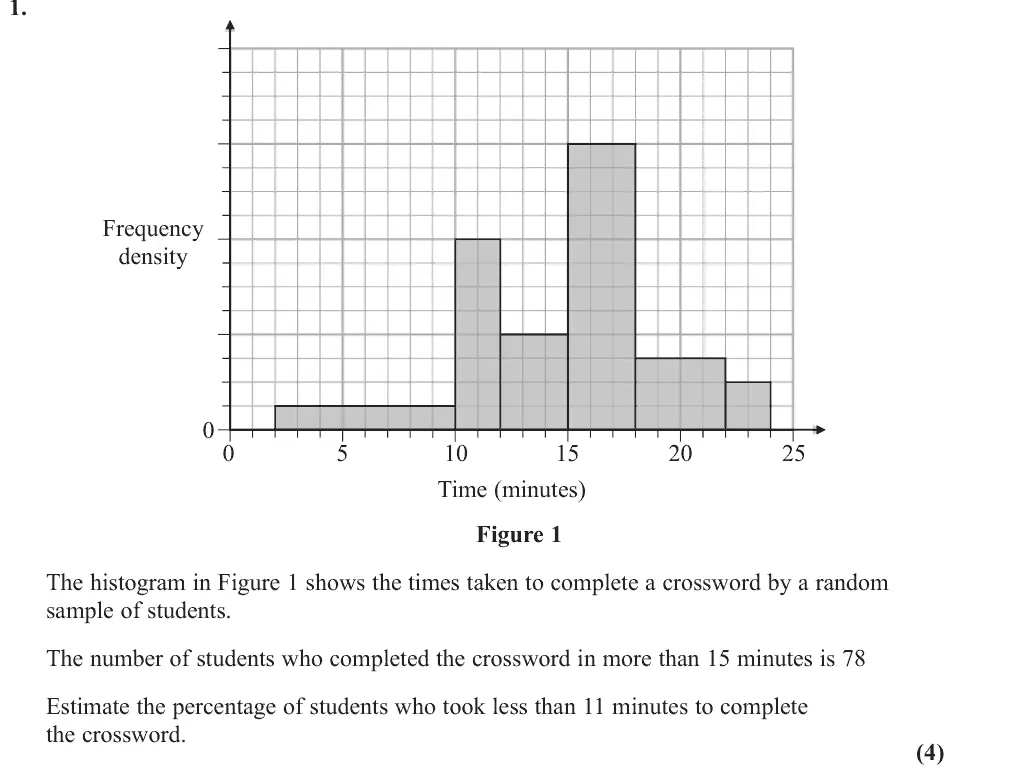
1. Frequency density Time (minutes) Figure 1 The histogram in Figure 1 shows the times taken to complete a crossword by a random sample of students. The number of students who completed the crossword in more than 15 minutes is 78 Estimate the percentage of students who took less than 11 minutes to complete the crossword. (4)
Oct 2020 · AS Paper 2 (Statistics) · Q2(a) 1 mark data presentationlarge data set
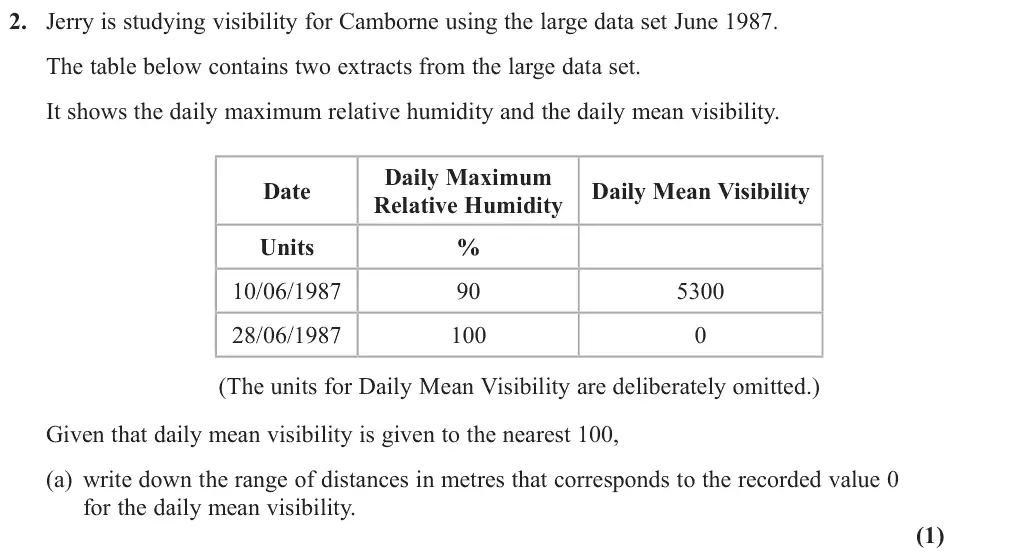
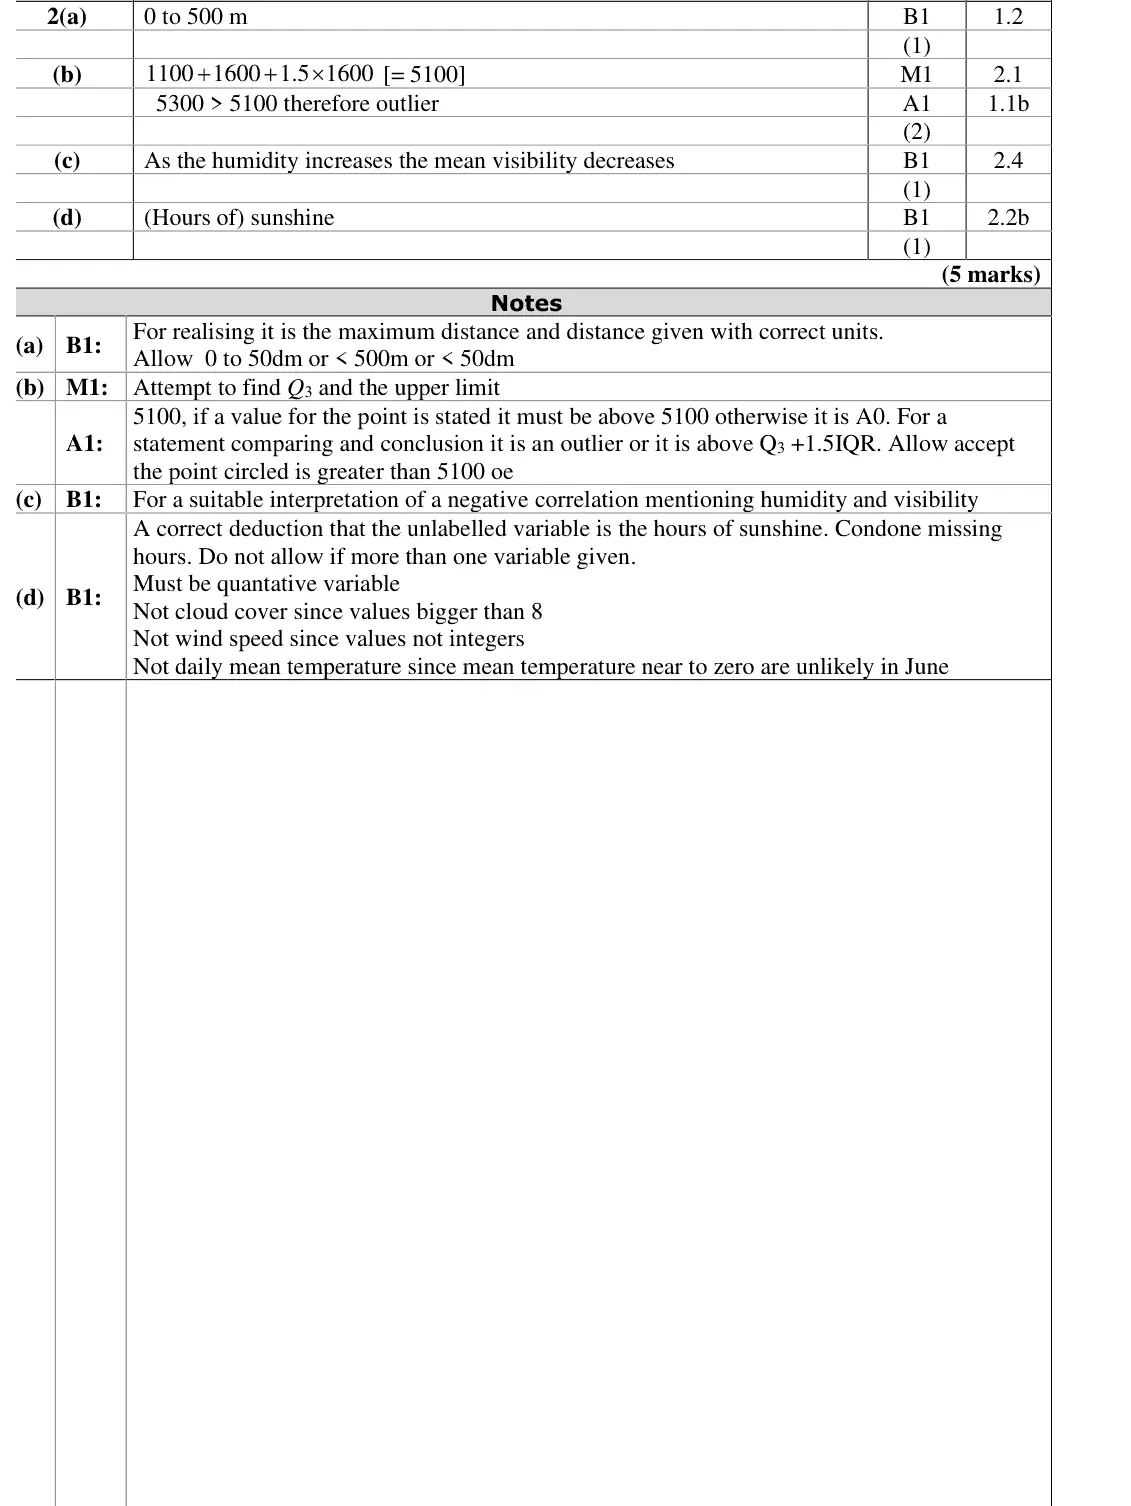
2. Jerry is studying visibility for Camborne using the large data set June 1987. The table below contains two extracts from the large data set. It shows the daily maximum relative humidity and the daily mean visibility. Daily Maximum Date Daily Mean Visibility Relative Humidity Units % 10/06/1987 5300 28/06/1987 (The units for Daily Mean Visibility are deliberately omitted.) Given that daily mean visibility is given to the nearest 100, (a) write down the range of distances in metres that corresponds to the recorded value 0 for the daily mean visibility. (1)
Oct 2020 · AS Paper 2 (Statistics) · Q2(b) 2 marks data presentationcorrelation and regression
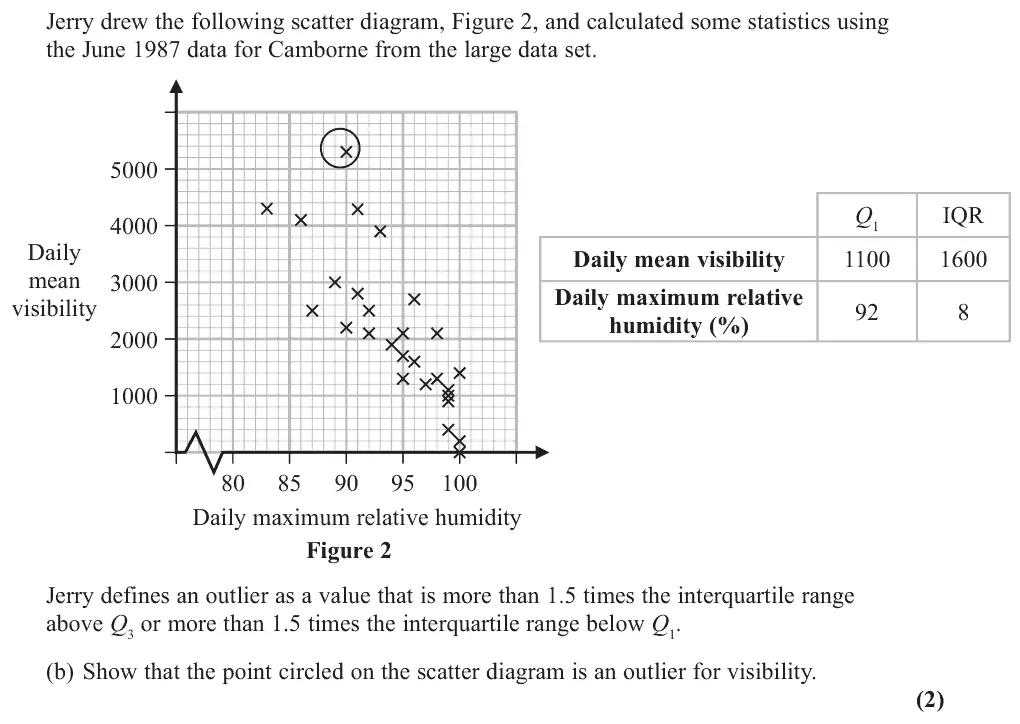
Jerry drew the following scatter diagram, Figure 2, and calculated some statistics using the June 1987 data for Camborne from the large data set. 5000 Q1 IQR 4000 Daily Daily mean visibility 1100 1600 mean 3000 Daily maximum relative visibility humidity (%) 2000 1000 Daily maximum relative humidity Figure 2 Jerry defines an outlier as a value that is more than 1.5 times the interquartile range above Q3 or more than 1.5 times the interquartile range below Q1. (b) Show that the point circled on the scatter diagram is an outlier for visibility. (2)
Oct 2020 · AS Paper 2 (Statistics) · Q2(c) 1 mark correlation and regression
(c) Interpret the correlation between the daily mean visibility and the daily maximum relative humidity. (1)
Oct 2020 · AS Paper 2 (Statistics) · Q2(d) 1 mark correlation and regressionlarge data set
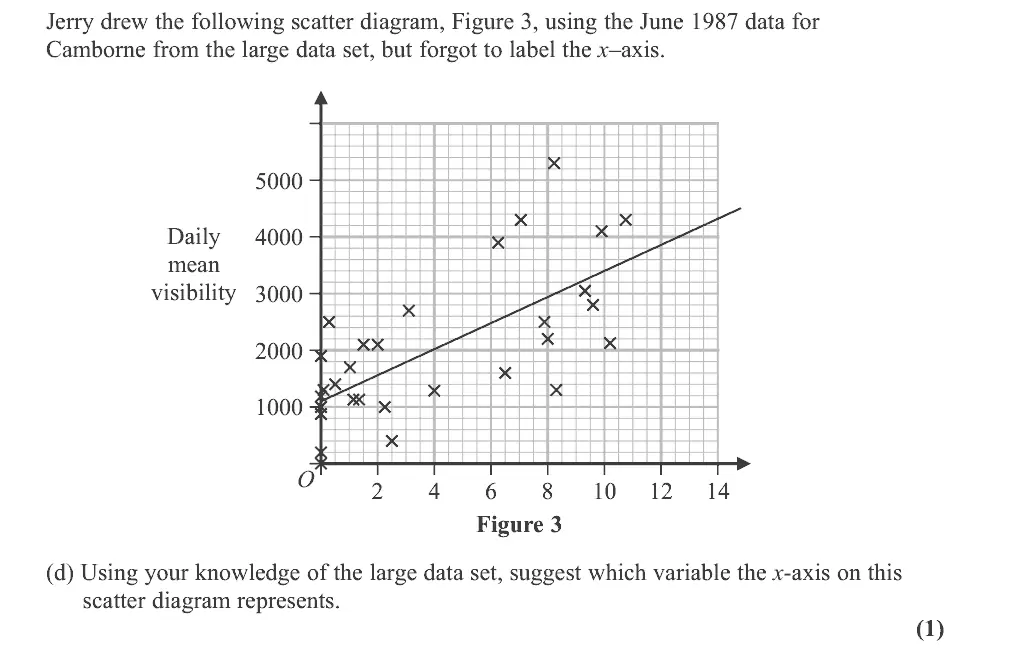
Jerry drew the following scatter diagram, Figure 3, using the June 1987 data for Camborne from the large data set, but forgot to label the x–axis. 5000 Daily 4000 mean visibility 3000 2000 1000 Figure 3 (d) Using your knowledge of the large data set, suggest which variable the x-axis on this scatter diagram represents. (1)
Oct 2020 · AS Paper 2 (Statistics) · Q3 6 marks binomial distributionprobability
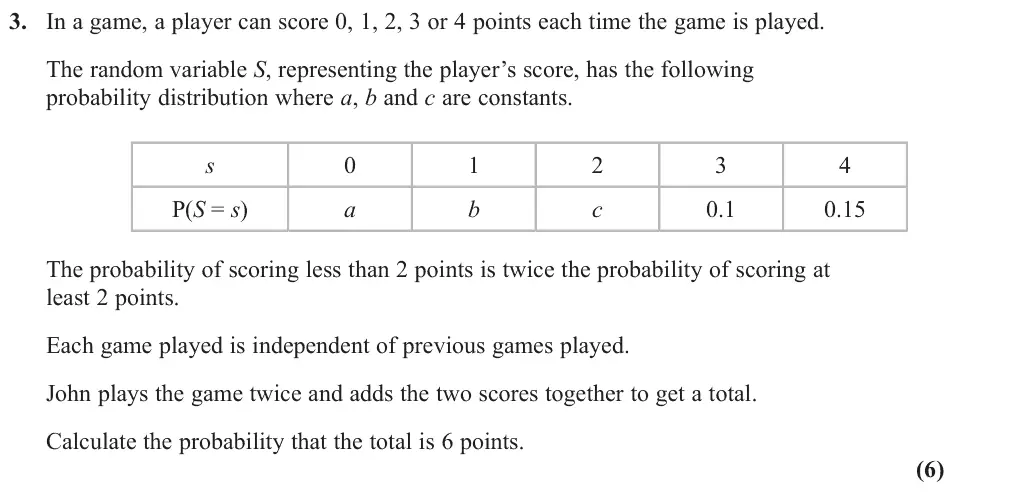
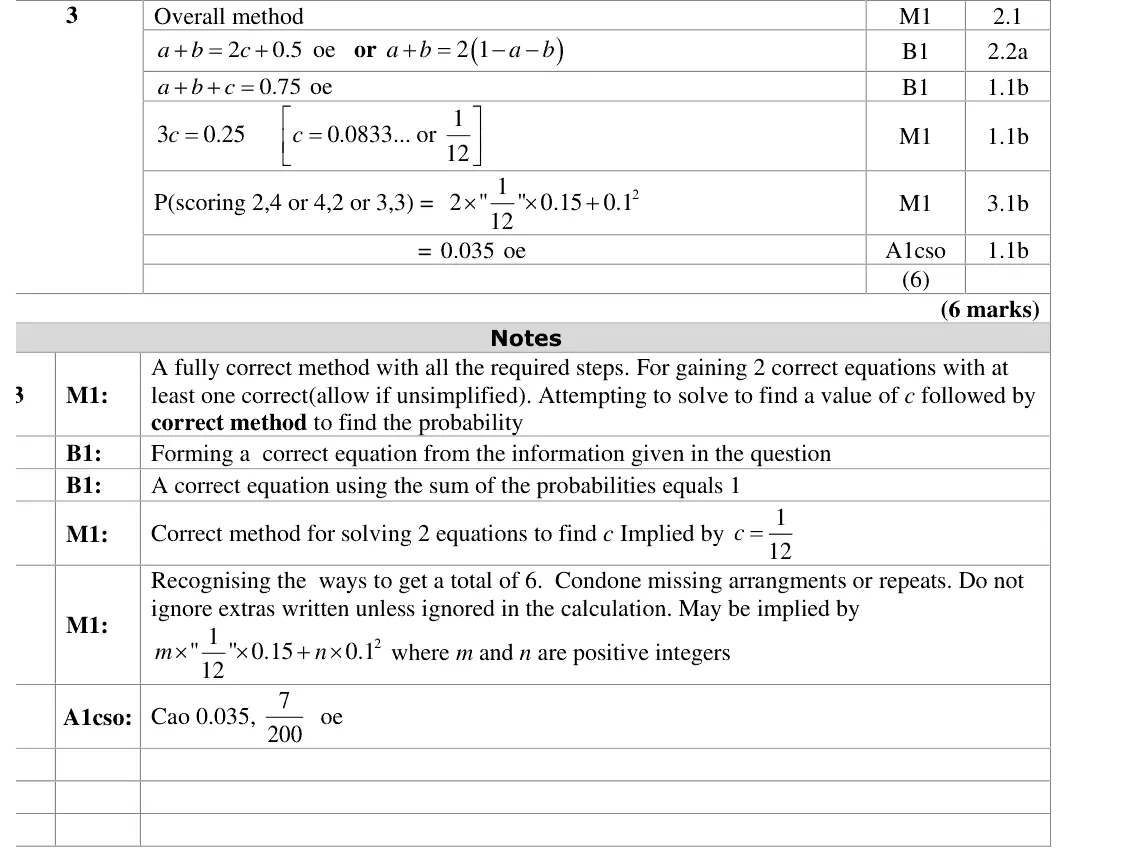
3. In a game, a player can score 0, 1, 2, 3 or 4 points each time the game is played. The random variable S, representing the player’s score, has the following probability distribution where a, b and c are constants. s P(S = s) a b c 0.1 0.15 The probability of scoring less than 2 points is twice the probability of scoring at least 2 points. Each game played is independent of previous games played. John plays the game twice and adds the two scores together to get a total. Calculate the probability that the total is 6 points. (6)
Oct 2020 · AS Paper 2 (Statistics) · Q4(a) 1 mark sampling
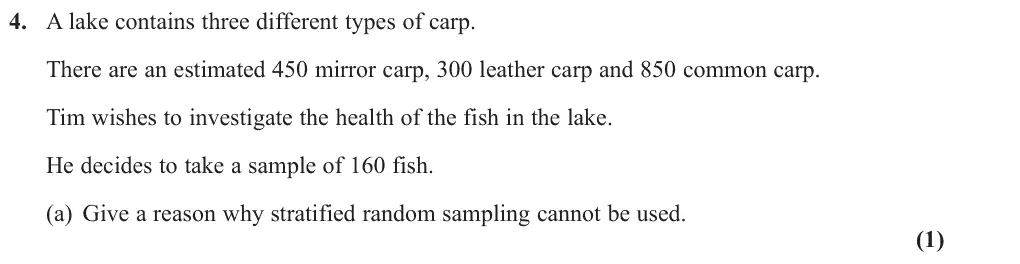
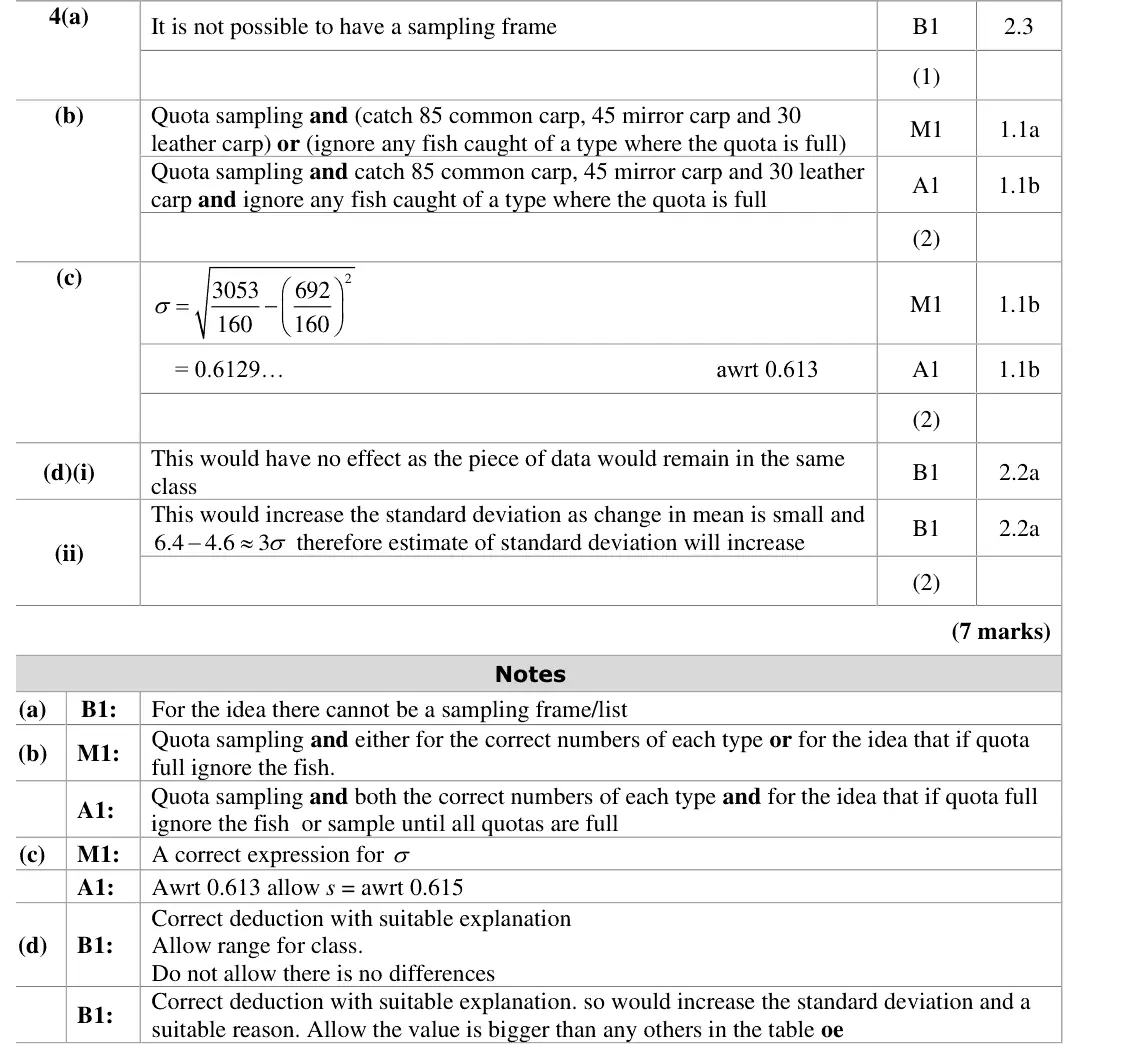
4. A lake contains three different types of carp. There are an estimated 450 mirror carp, 300 leather carp and 850 common carp. Tim wishes to investigate the health of the fish in the lake. He decides to take a sample of 160 fish. (a) Give a reason why stratified random sampling cannot be used. (1)
Oct 2020 · AS Paper 2 (Statistics) · Q4(b) 2 marks sampling
(b) Explain how a sample of size 160 could be taken to ensure that the estimated populations of each type of carp are fairly represented. You should state the name of the sampling method used. (2)
Oct 2020 · AS Paper 2 (Statistics) · Q4(c) 2 marks data presentation
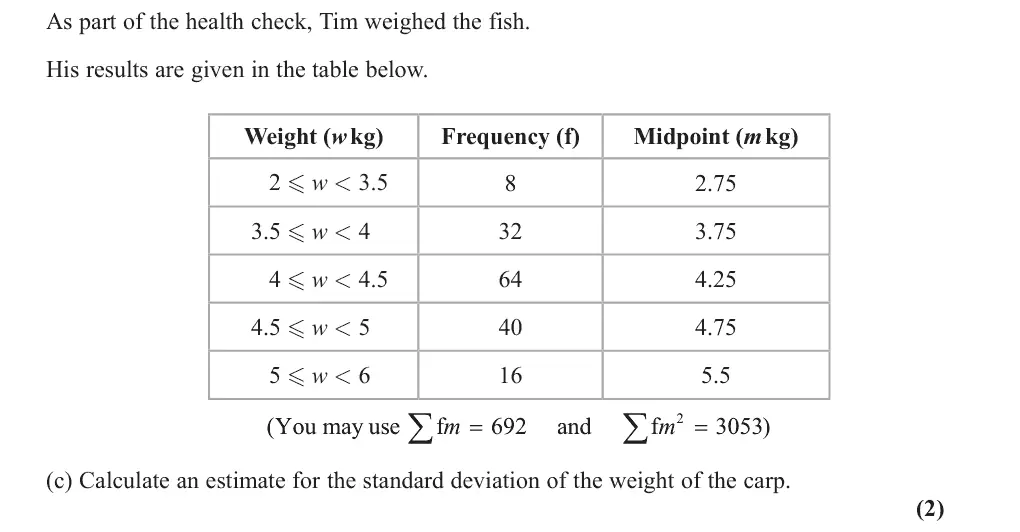
As part of the health check, Tim weighed the fish. His results are given in the table below. Weight (w kg) Frequency (f) Midpoint (m kg) 2 w < 3.5 2.75 3.5 w < 4 3.75 4 w < 4.5 4.25 4.5 w < 5 4.75 5 w < 6 5.5 ; ; m m ( You may use f and f 3053 ) (c) Calculate an estimate for the standard deviation of the weight of the carp. (2)
Oct 2020 · AS Paper 2 (Statistics) · Q4(d) 2 marks data presentation
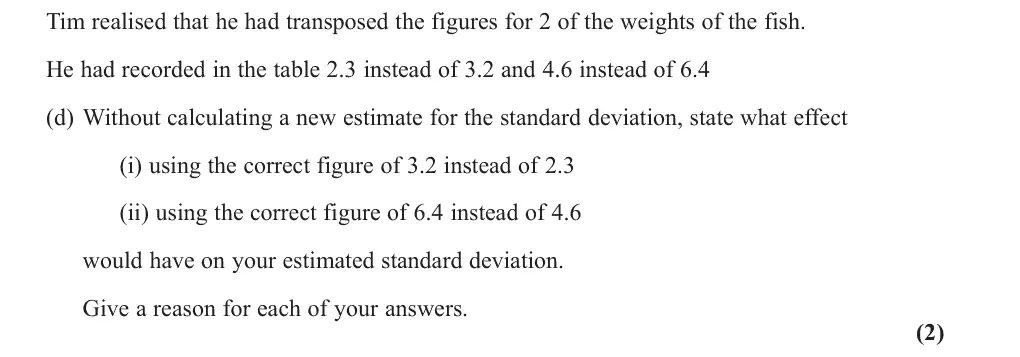
Tim realised that he had transposed the figures for 2 of the weights of the fish. He had recorded in the table 2.3 instead of 3.2 and 4.6 instead of 6.4 (d) Without calculating a new estimate for the standard deviation, state what effect (i) using the correct figure of 3.2 instead of 2.3 (ii) using the correct figure of 6.4 instead of 4.6 would have on your estimated standard deviation. Give a reason for each of your answers. (2)
Oct 2020 · AS Paper 2 (Statistics) · Q5(a) 2 marks binomial distribution
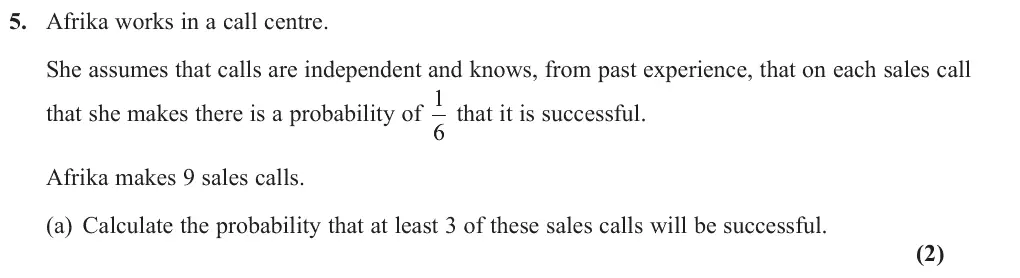
5. Afrika works in a call centre. She assumes that calls are independent and knows, from past experience, that on each sales call that she makes there is a probability of 1 6 that it is successful. Afrika makes 9 sales calls. (a) Calculate the probability that at least 3 of these sales calls will be successful. (2)
Oct 2020 · AS Paper 2 (Statistics) · Q5(b) 2 marks binomial distribution
The probability of Afrika making a successful sales call is the same each day. Afrika makes 9 sales calls on each of 5 different days. (b) Calculate the probability that at least 3 of the sales calls will be successful on exactly 1 of these days. (2)
Oct 2020 · AS Paper 2 (Statistics) · Q5(c) 4 marks hypothesis testingbinomial distribution
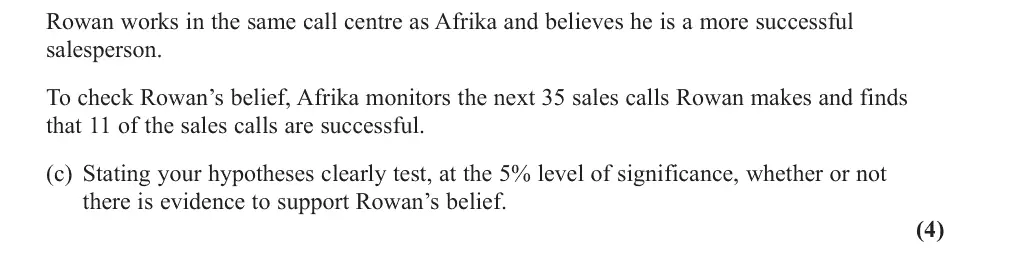
Rowan works in the same call centre as Afrika and believes he is a more successful salesperson. To check Rowan’s belief, Afrika monitors the next 35 sales calls Rowan makes and finds that 11 of the sales calls are successful. (c) Stating your hypotheses clearly test, at the 5% level of significance, whether or not there is evidence to support Rowan’s belief. (4)

Find an Edexcel maths tutor

Want this paper marked and gone through with you? Message us.

Prefer email? Send an enquiry

If you are under 18, please include a parent's contact details. Enquiries go to enquiries@mathsaleveltutor.com and are deleted once handled.