June 2022: AS AS Paper 2 Section A: Statistics

30 marks · 13 question parts · Question paper, mark scheme and examiner's report on Pearson's site

Question by question

QTopicMarksDifficulty
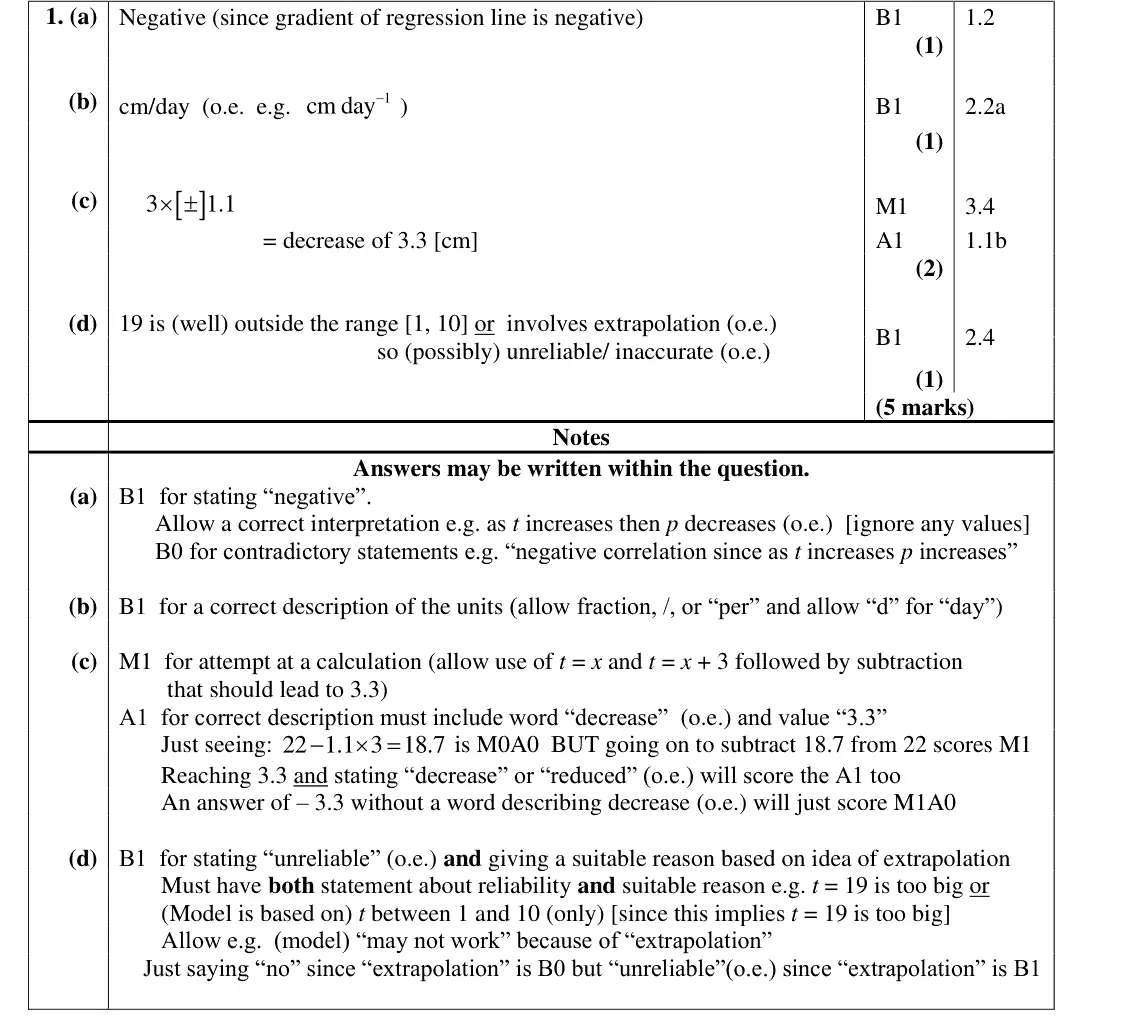
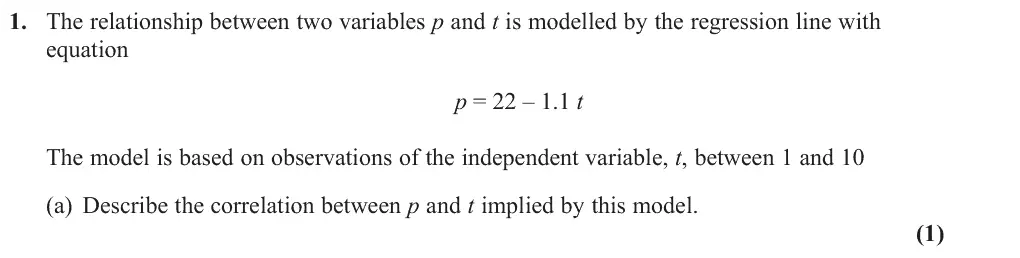
1(a) Correlation and regression 1 —
1(b) Correlation and regression 1 —
1(c) Correlation and regression 2 —
1(d) Correlation and regression 1 —
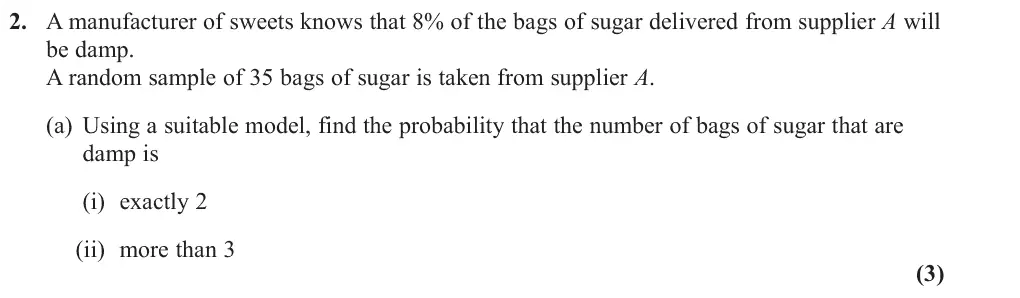
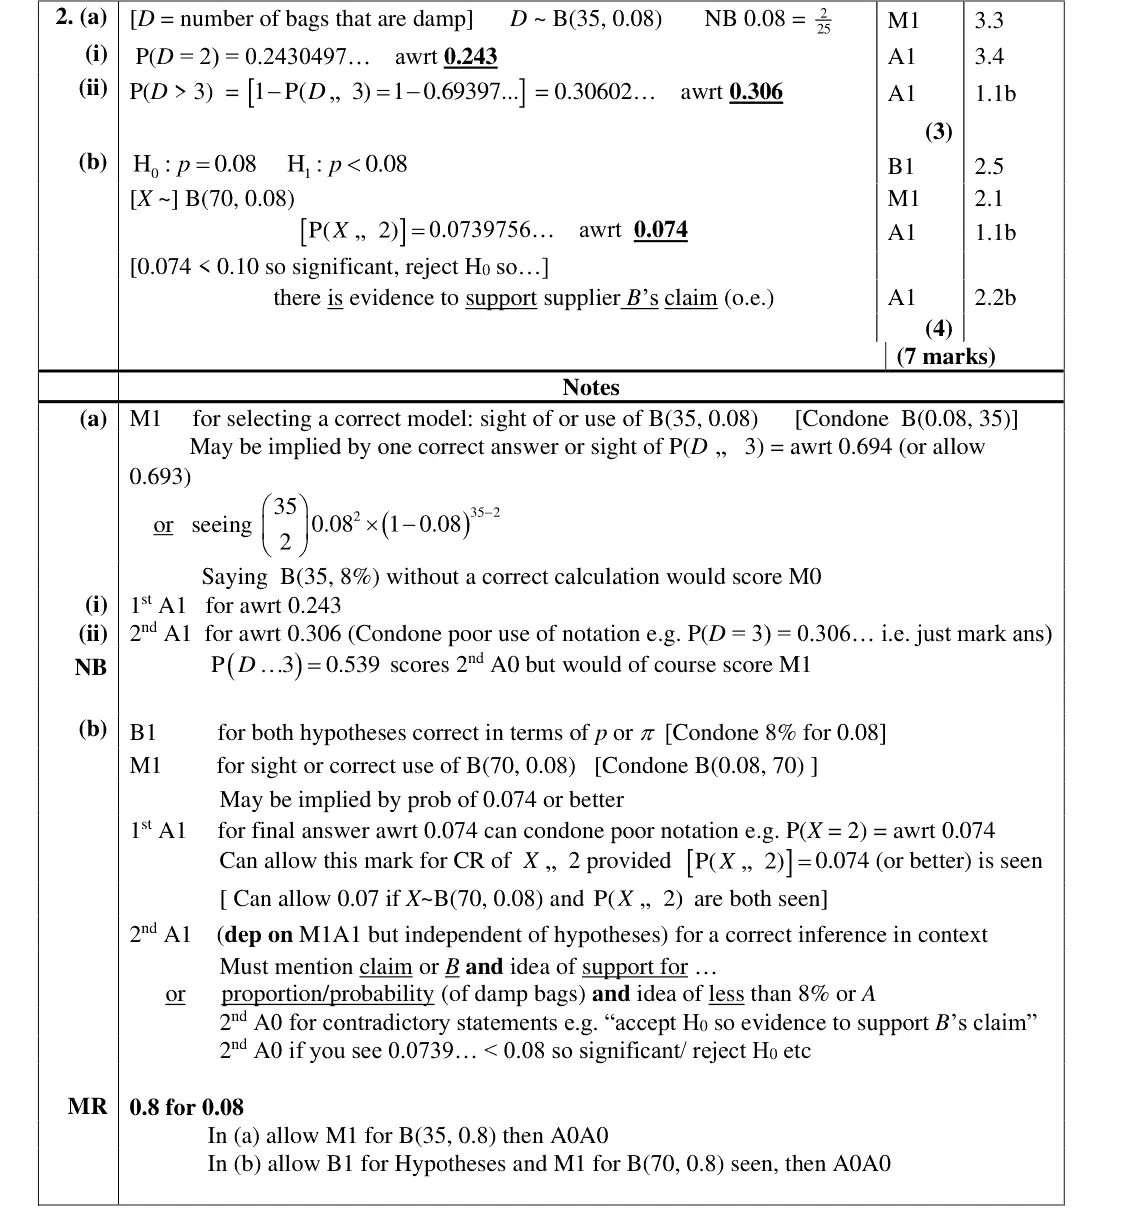
2(a) Discrete distributions and the binomial distribution 3 Easy
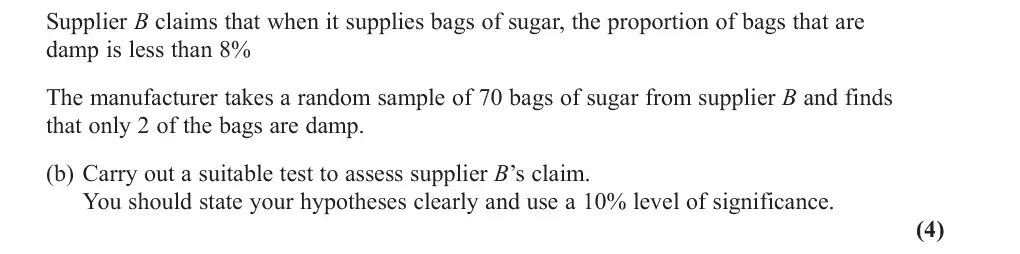
2(b) Hypothesis testing, Discrete distributions and the binomial distribution 4 —
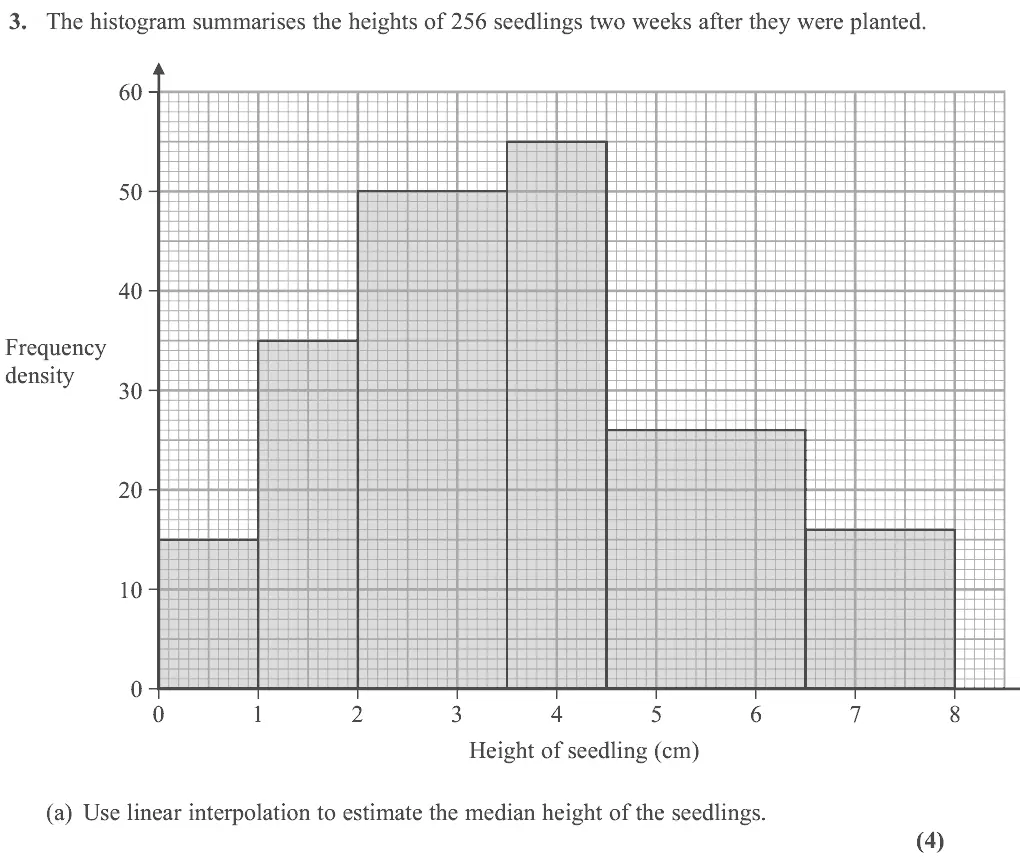
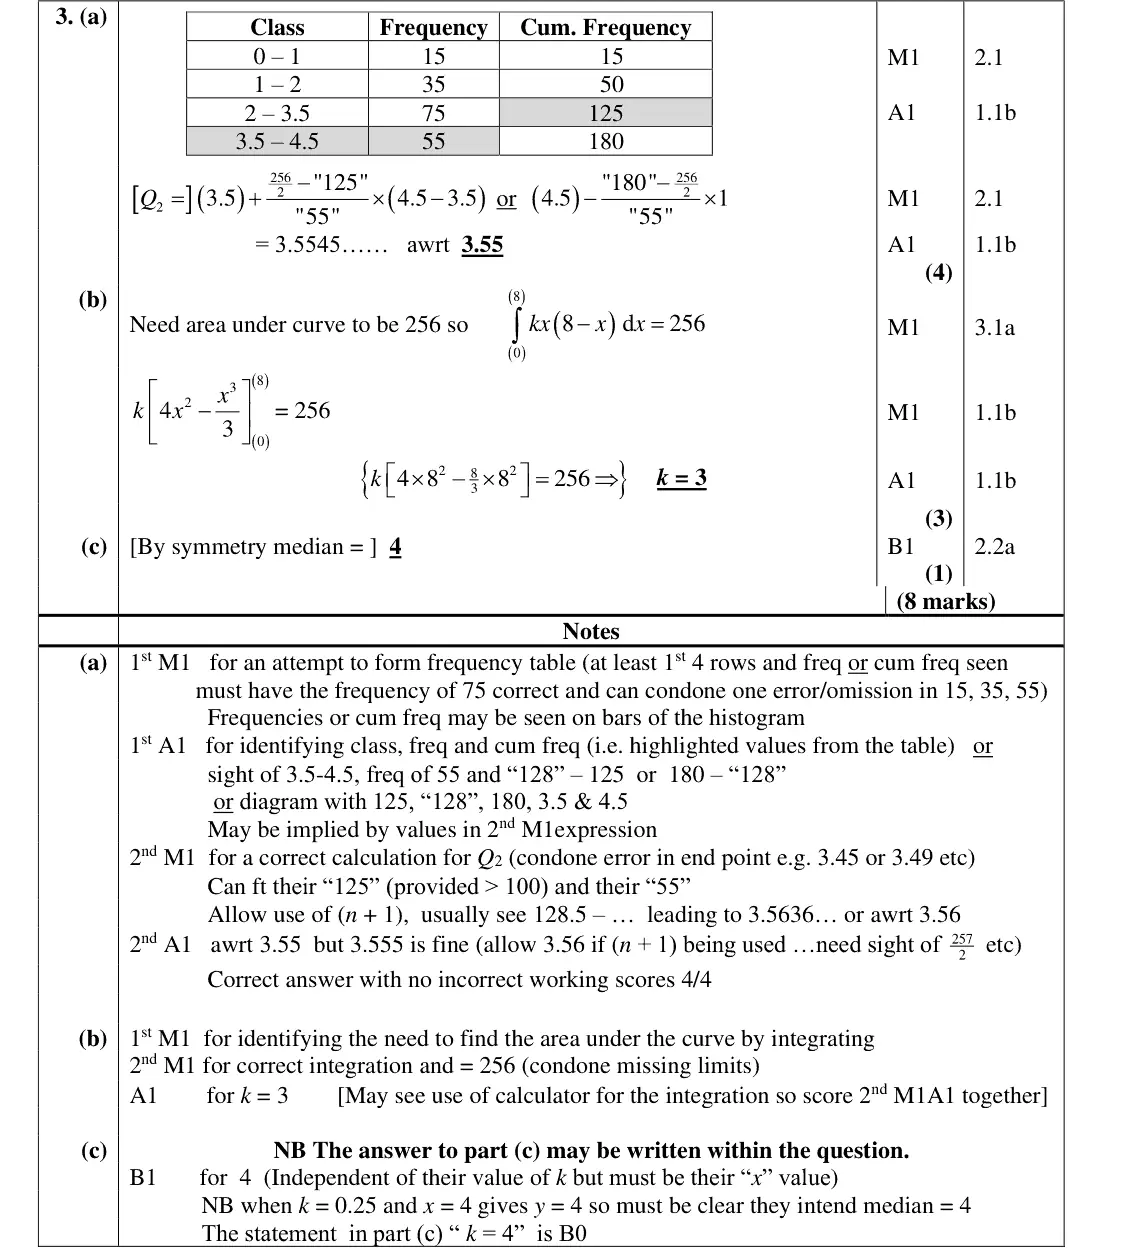
3(a) Data presentation: histograms, box plots, measures and outliers 4 —
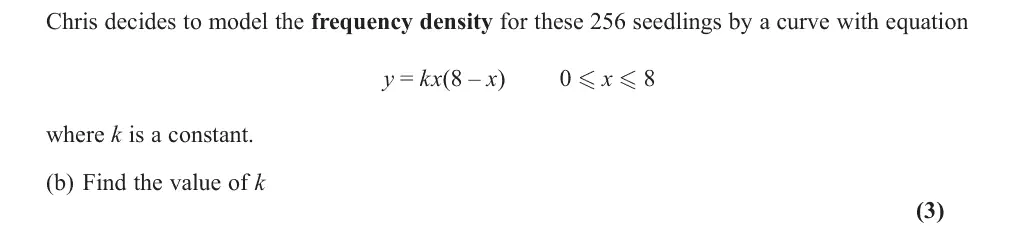
3(b) Data presentation: histograms, box plots, measures and outliers, Integration: standard integrals, definite integrals and areas 3 —
3(c) Data presentation: histograms, box plots, measures and outliers 1 —
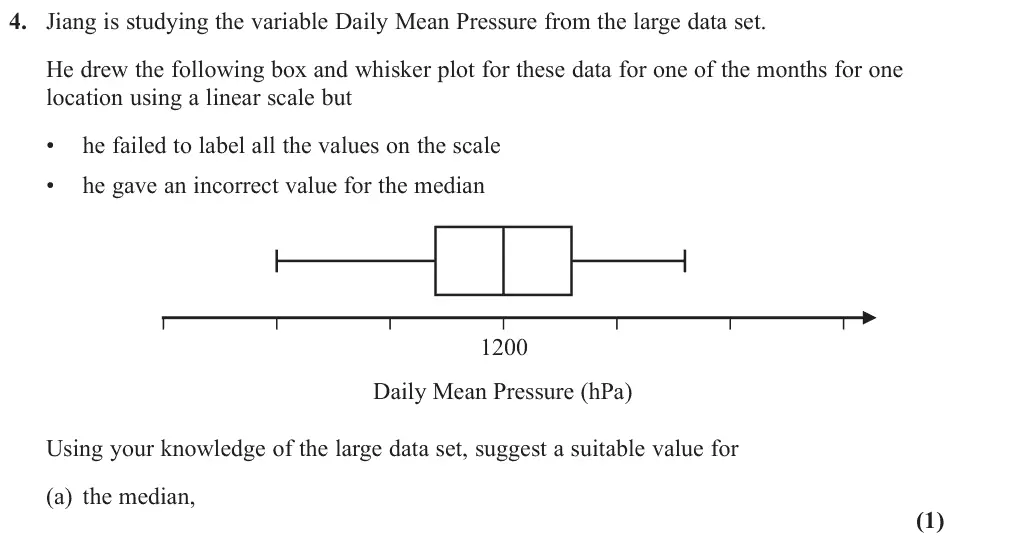
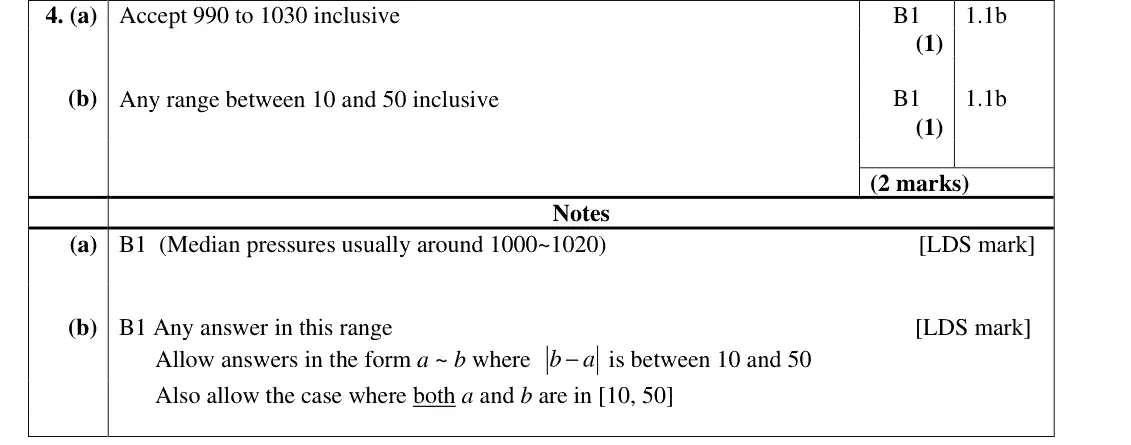
4(a) Data presentation: histograms, box plots, measures and outliers, The large data set 1 —
4(b) Data presentation: histograms, box plots, measures and outliers, The large data set 1 —
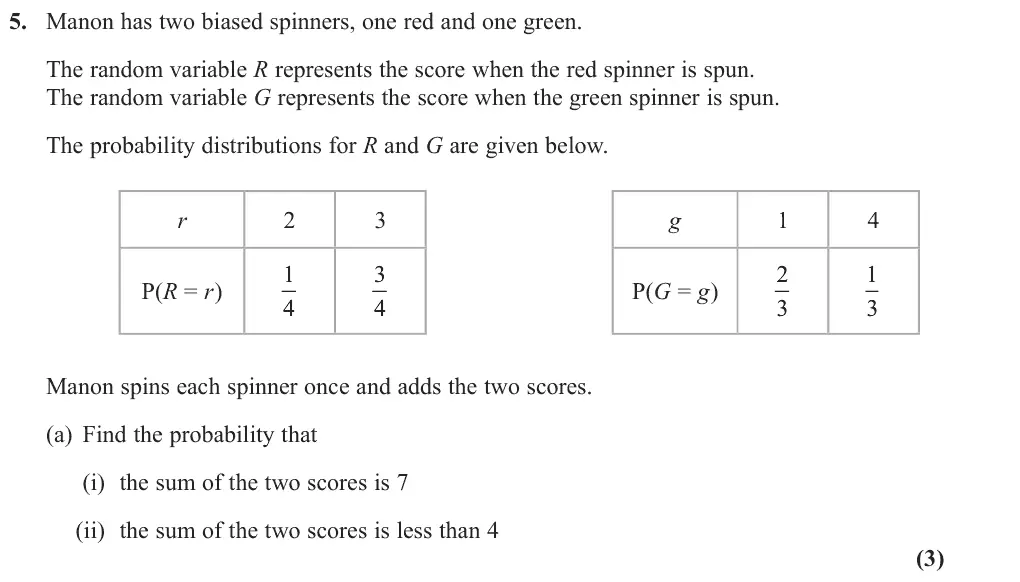
5(a) Probability, including conditional probability, Discrete distributions and the binomial distribution 3 —
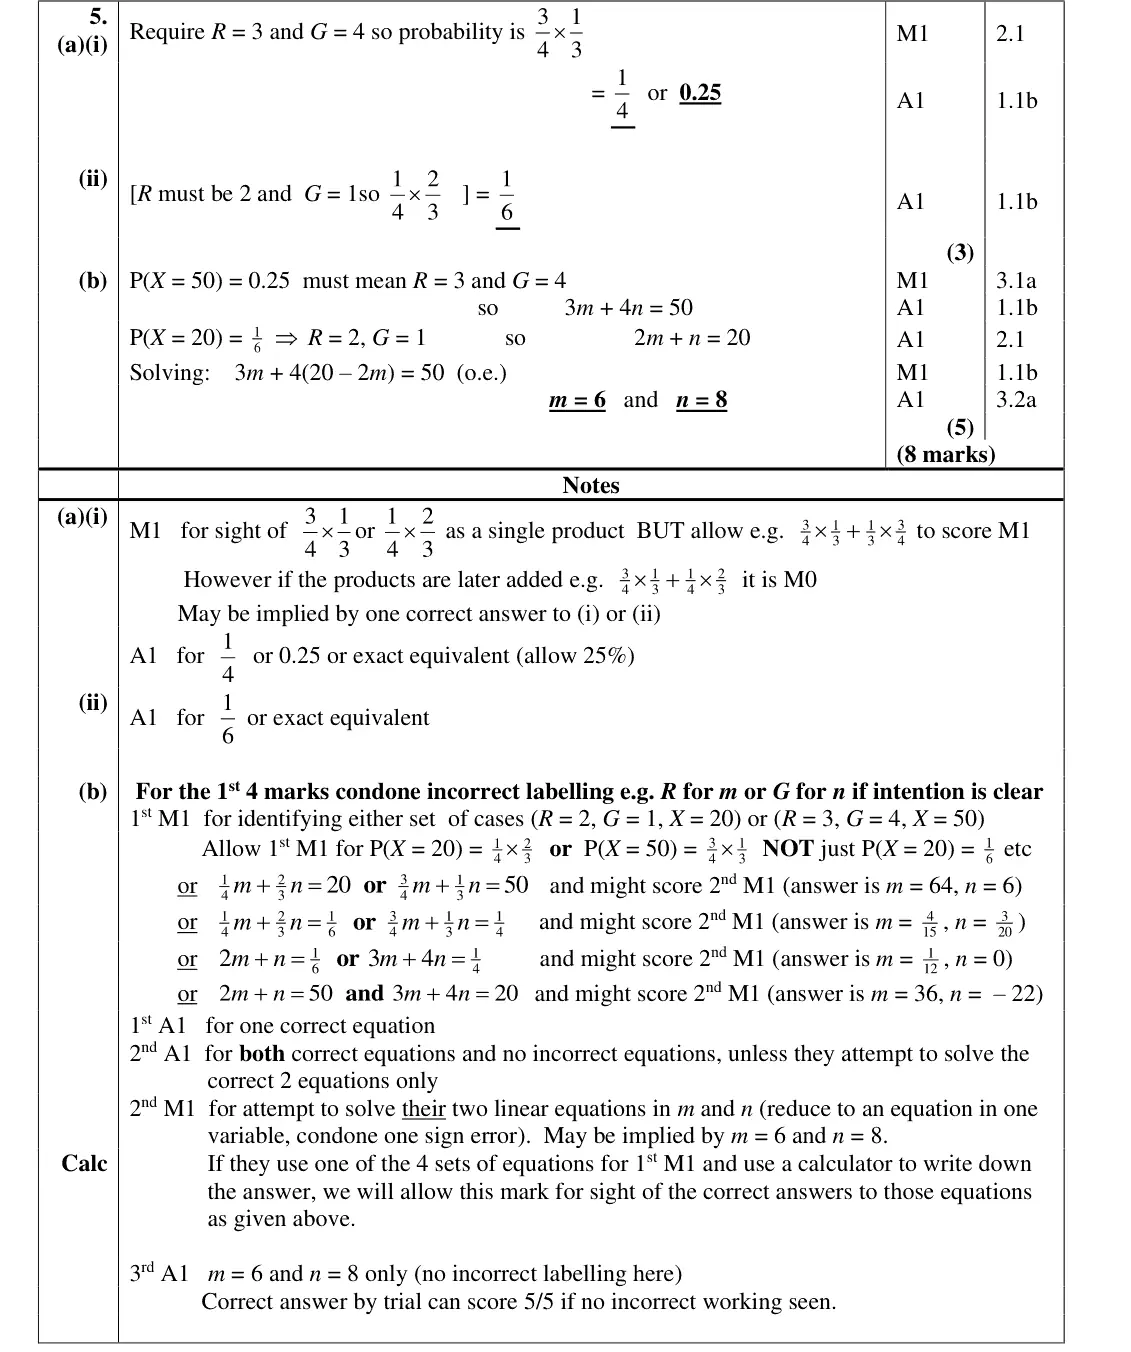
5(b) Discrete distributions and the binomial distribution, Probability, including conditional probability, Simultaneous equations 5 Medium

The questions

1(a)1(b)1(c)1(d)2(a)2(b)3(a)3(b)3(c)4(a)4(b)5(a)5(b)
June 2022 · AS Paper 2 (Statistics) · Q1(a) 1 mark correlation and regression
1. The relationship between two variables p and t is modelled by the regression line with equation p = 22 – 1.1 t The model is based on observations of the independent variable, t, between 1 and 10 (a) Describe the correlation between p and t implied by this model. (1)
June 2022 · AS Paper 2 (Statistics) · Q1(b) 1 mark correlation and regression
Given that p is measured in centimetres and t is measured in days, (b) state the units of the gradient of the regression line. (1)
June 2022 · AS Paper 2 (Statistics) · Q1(c) 2 marks correlation and regression
Using the model, (c) calculate the change in p over a 3‑day period. (2)
June 2022 · AS Paper 2 (Statistics) · Q1(d) 1 mark correlation and regression
Tisam uses this model to estimate the value of p when t = 19 (d) Comment, giving a reason, on the reliability of this estimate. (1)
June 2022 · AS Paper 2 (Statistics) · Q2(a) 3 marks Easy binomial distribution
2. A manufacturer of sweets knows that 8% of the bags of sugar delivered from supplier A will be damp. A random sample of 35 bags of sugar is taken from supplier A. (a) Using a suitable model, find the probability that the number of bags of sugar that are damp is (i) exactly 2 (ii) more than 3 (3)
June 2022 · AS Paper 2 (Statistics) · Q2(b) 4 marks hypothesis testingbinomial distribution
Supplier B claims that when it supplies bags of sugar, the proportion of bags that are damp is less than 8% The manufacturer takes a random sample of 70 bags of sugar from supplier B and finds that only 2 of the bags are damp. (b) Carry out a suitable test to assess supplier B’s claim. You should state your hypotheses clearly and use a 10% level of significance. (4)
June 2022 · AS Paper 2 (Statistics) · Q3(a) 4 marks data presentation
3. The histogram summarises the heights of 256 seedlings two weeks after they were planted. Frequency density Height of seedling (cm) (a) Use linear interpolation to estimate the median height of the seedlings. (4)
June 2022 · AS Paper 2 (Statistics) · Q3(b) 3 marks data presentationintegration
Chris decides to model the frequency density for these 256 seedlings by a curve with equation y = kx(8 – x) 0 x 8 where k is a constant. (b) Find the value of k (3)
June 2022 · AS Paper 2 (Statistics) · Q3(c) 1 mark data presentation
Using this model, (c) write down the median height of the seedlings. (1)
June 2022 · AS Paper 2 (Statistics) · Q4(a) 1 mark data presentationlarge data set
4. Jiang is studying the variable Daily Mean Pressure from the large data set. He drew the following box and whisker plot for these data for one of the months for one location using a linear scale but • he failed to label all the values on the scale • he gave an incorrect value for the median 1200 Daily Mean Pressure (hPa) Using your knowledge of the large data set, suggest a suitable value for (a) the median, (1)
June 2022 · AS Paper 2 (Statistics) · Q4(b) 1 mark data presentationlarge data set
(b) the range. (1)
June 2022 · AS Paper 2 (Statistics) · Q5(a) 3 marks probabilitybinomial distribution
5. Manon has two biased spinners, one red and one green. The random variable R represents the score when the red spinner is spun. The random variable G represents the score when the green spinner is spun. The probability distributions for R and G are given below. r g P(R = r) P(G = g) Manon spins each spinner once and adds the two scores. (a) Find the probability that (i) the sum of the two scores is 7 (ii) the sum of the two scores is less than 4 (3)
June 2022 · AS Paper 2 (Statistics) · Q5(b) 5 marks Medium binomial distributionprobabilitysimultaneous equations
The random variable X = mR + nG where m and n are integers. P(X = 20) = 1 6 and P(X = 50) = 1 (b) Find the value of m and the value of n (5)

Find an Edexcel maths tutor

Want this paper marked and gone through with you? Message us.

Prefer email? Send an enquiry

If you are under 18, please include a parent's contact details. Enquiries go to enquiries@mathsaleveltutor.com and are deleted once handled.