June 2019: AS AS Paper 2 Section A: Statistics

30 marks · 14 question parts · Question paper, mark scheme and examiner's report on Pearson's site

Question by question

QTopicMarksDifficulty
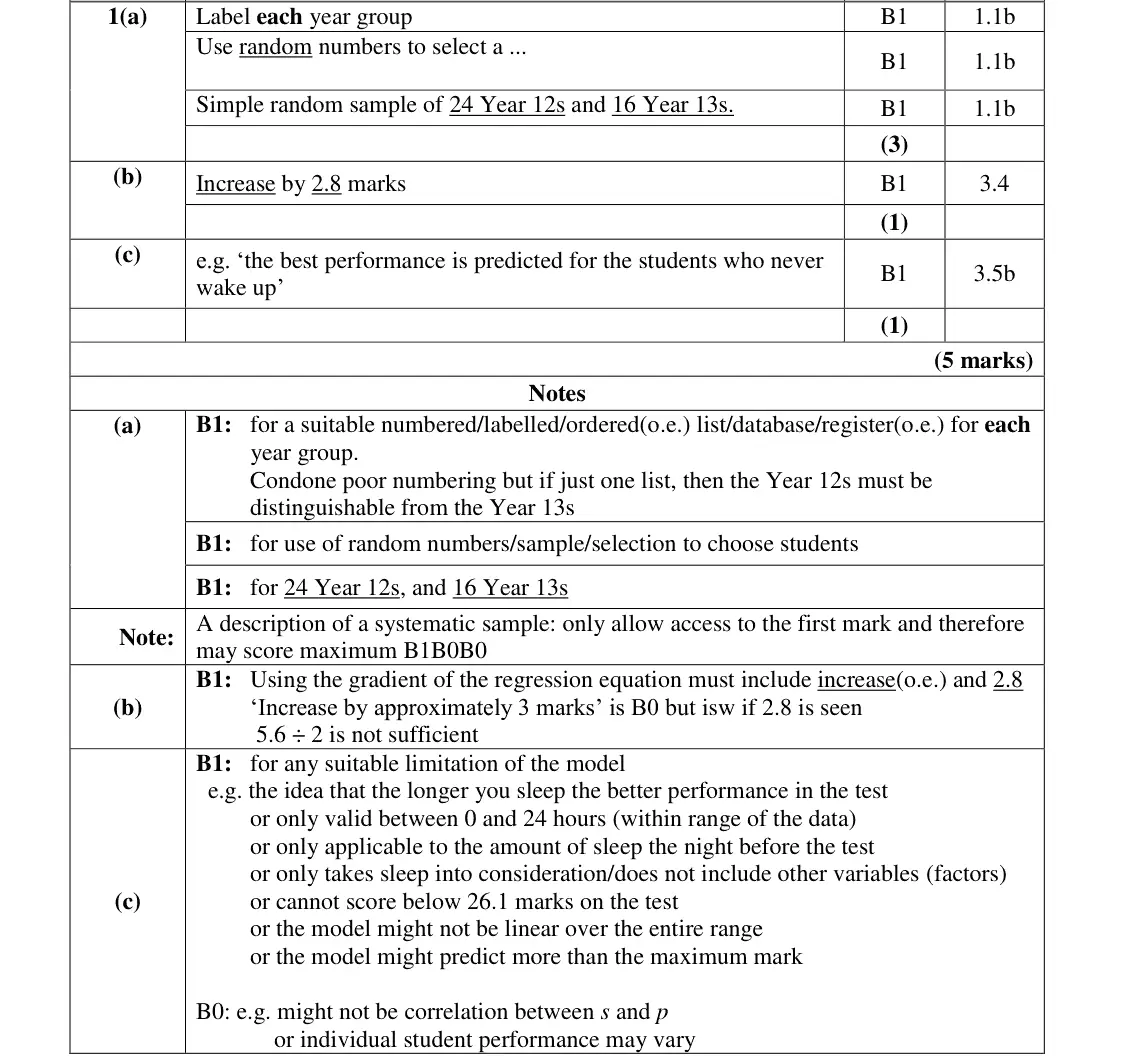
1(a) Sampling 3 —
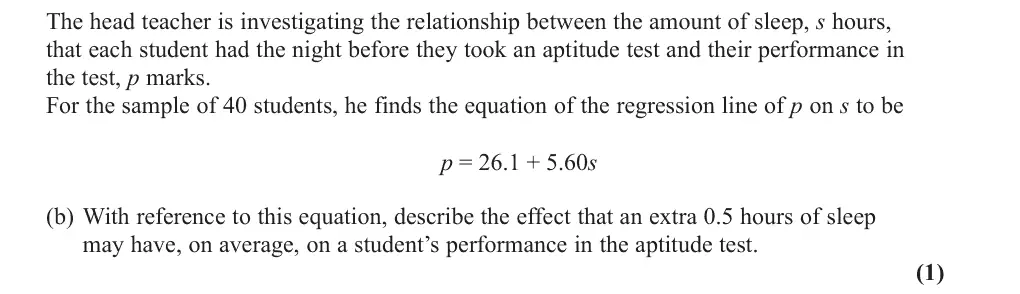
1(b) Correlation and regression 1 —
1(c) Correlation and regression 1 —
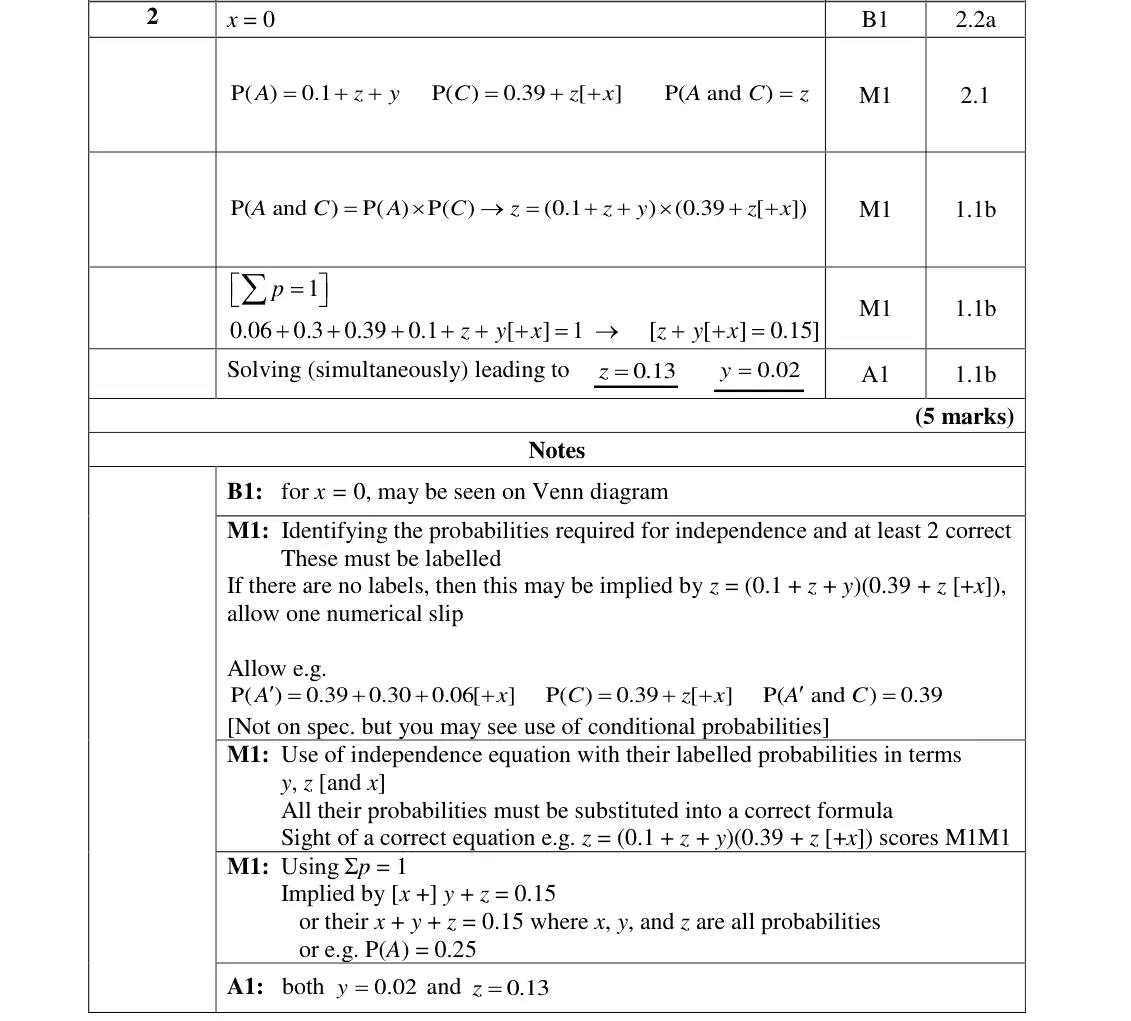
2 Probability, including conditional probability 5 Medium
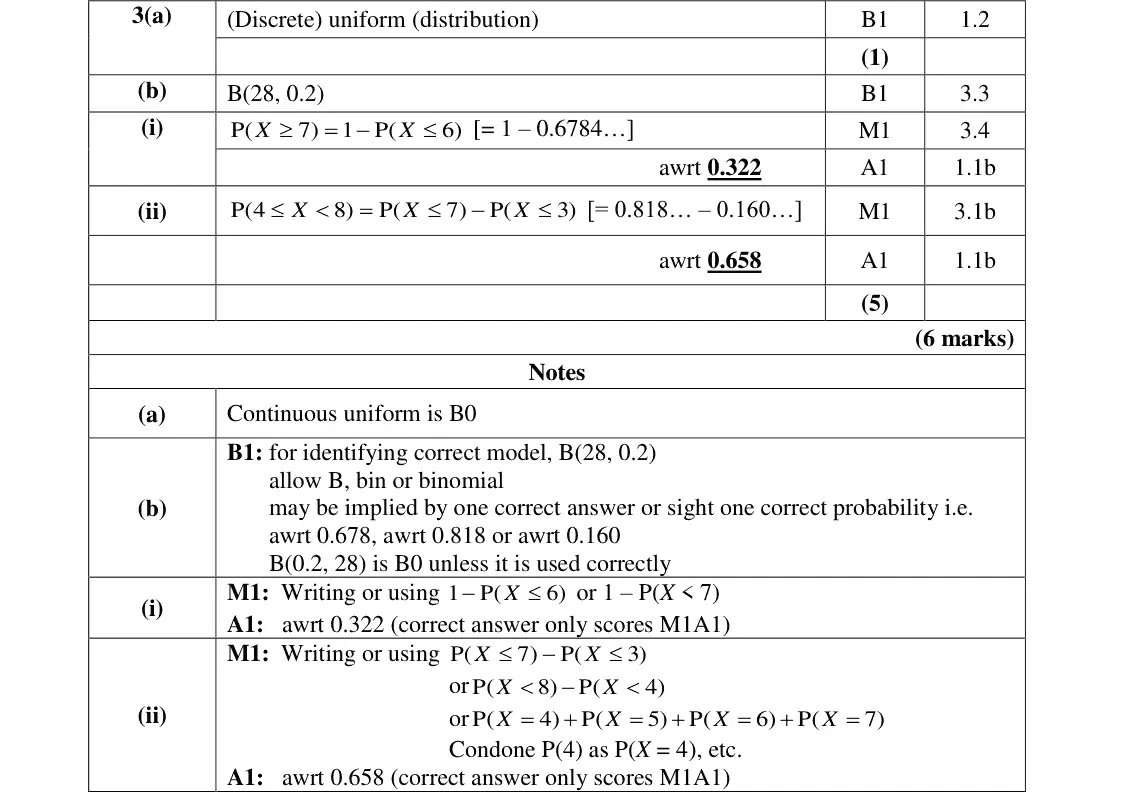
3(a) Discrete distributions and the binomial distribution 1 Medium
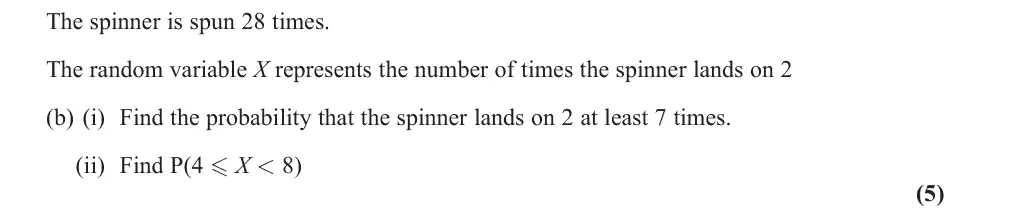
3(b) Discrete distributions and the binomial distribution 5 Medium
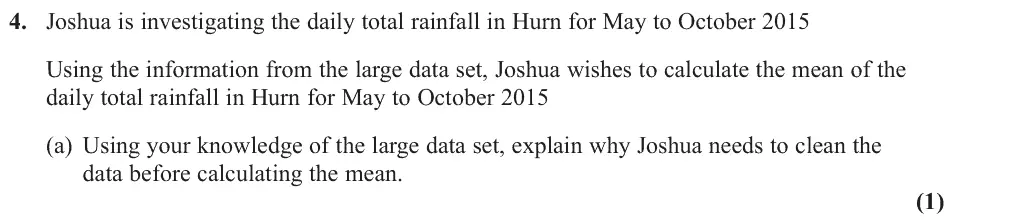
4(a) Data presentation: histograms, box plots, measures and outliers, The large data set 1 —
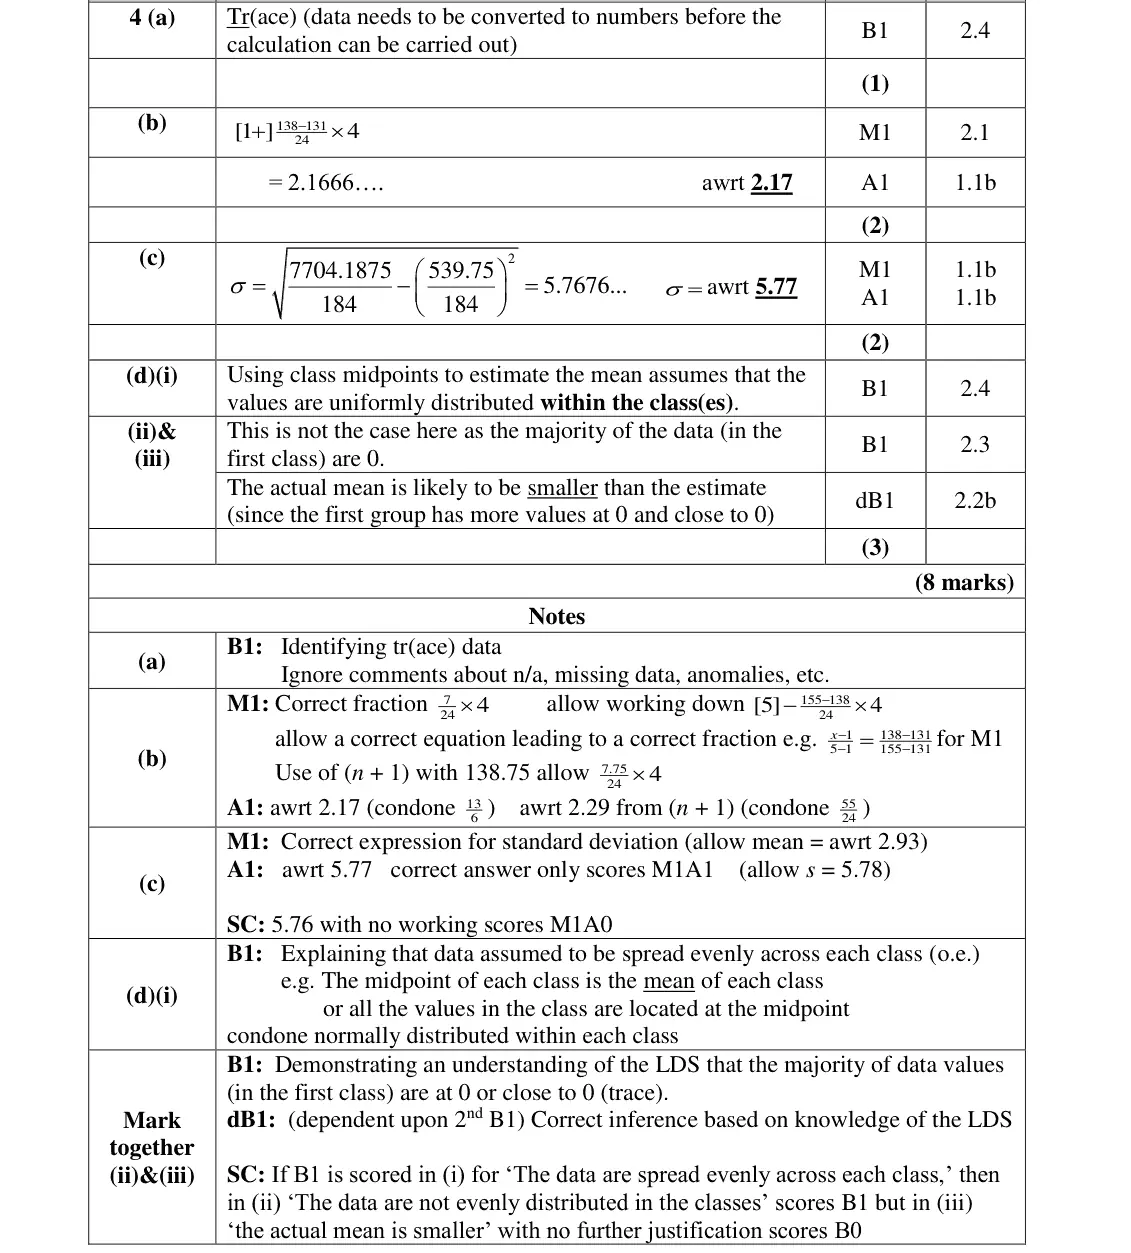
4(b) Data presentation: histograms, box plots, measures and outliers 2 —
4(c) Data presentation: histograms, box plots, measures and outliers 2 —
4(d) Data presentation: histograms, box plots, measures and outliers, The large data set 3 —
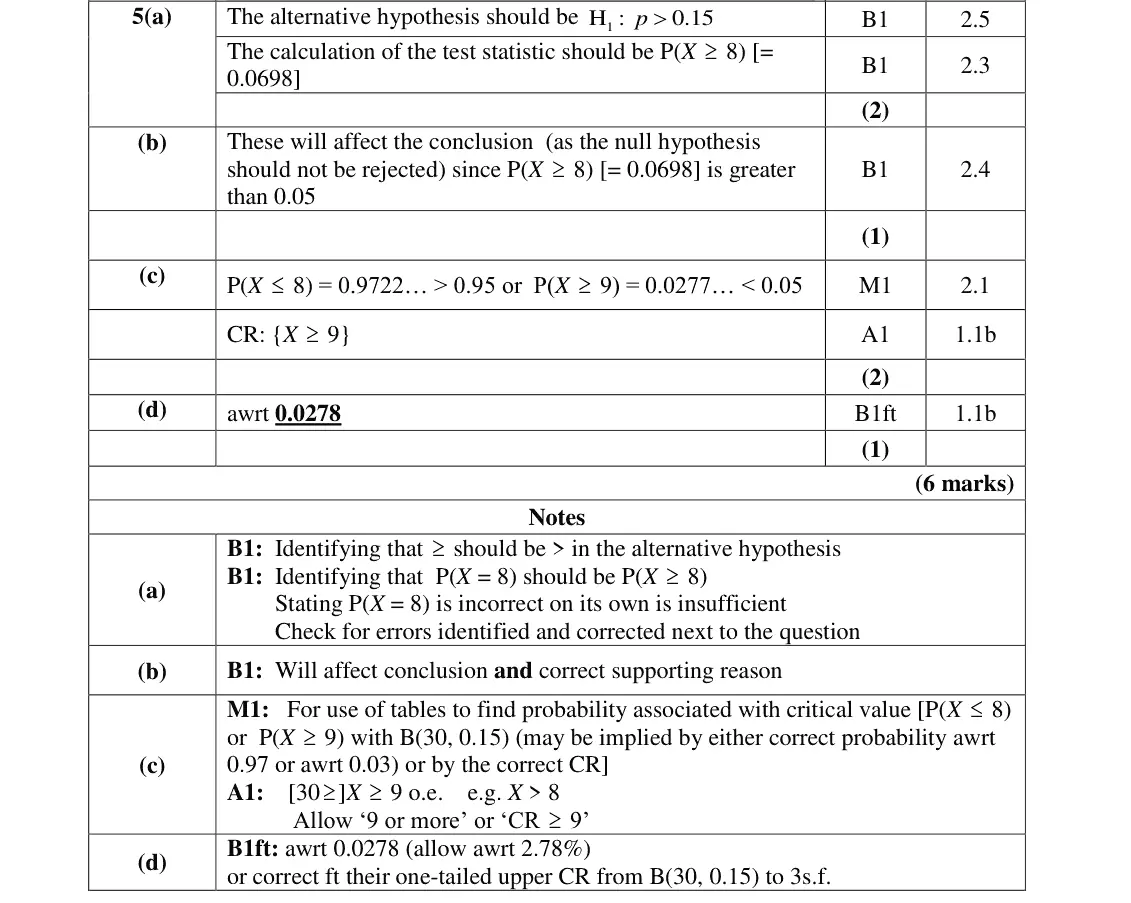
5(a) Hypothesis testing 2 —
5(b) Hypothesis testing 1 —
5(c) Hypothesis testing, Discrete distributions and the binomial distribution 2 Hard
5(d) Hypothesis testing 1 Hard

The questions

1(a)1(b)1(c)23(a)3(b)4(a)4(b)4(c)4(d)5(a)5(b)5(c)5(d)
June 2019 · AS Paper 2 (Statistics) · Q1(a) 3 marks sampling
1. A sixth form college has 84 students in Year 12 and 56 students in Year 13 The head teacher selects a stratified sample of 40 students, stratified by year group. (a) Describe how this sample could be taken. (3)
June 2019 · AS Paper 2 (Statistics) · Q1(b) 1 mark correlation and regression
The head teacher is investigating the relationship between the amount of sleep, s hours, that each student had the night before they took an aptitude test and their performance in the test, p marks. For the sample of 40 students, he finds the equation of the regression line of p on s to be p = 26.1 + 5.60s (b) With reference to this equation, describe the effect that an extra 0.5 hours of sleep may have, on average, on a student’s performance in the aptitude test. (1)
June 2019 · AS Paper 2 (Statistics) · Q1(c) 1 mark correlation and regression
(c) Describe one limitation of this regression model. (1)
June 2019 · AS Paper 2 (Statistics) · Q2 5 marks Medium probability
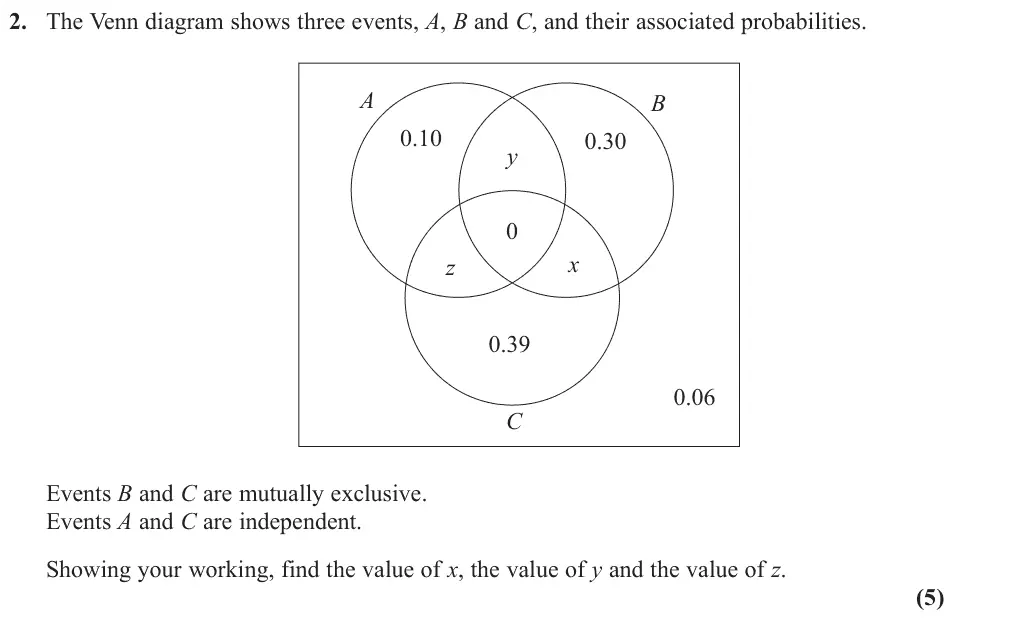
2. The Venn diagram shows three events, A, B and C, and their associated probabilities. A B 0.10 0.30 y x z 0.39 0.06 C Events B and C are mutually exclusive. Events A and C are independent. Showing your working, find the value of x, the value of y and the value of z. (5)
June 2019 · AS Paper 2 (Statistics) · Q3(a) 1 mark Medium binomial distribution
3. A fair 5-sided spinner has sides numbered 1, 2, 3, 4 and 5 The spinner is spun once and the score of the side it lands on is recorded. (a) Write down the name of the distribution that can be used to model the score of the side it lands on. (1)
June 2019 · AS Paper 2 (Statistics) · Q3(b) 5 marks Medium binomial distribution
The spinner is spun 28 times. The random variable X represents the number of times the spinner lands on 2 (b) (i) Find the probability that the spinner lands on 2 at least 7 times. (ii) Find P(4 - X : 8) (5)
June 2019 · AS Paper 2 (Statistics) · Q4(a) 1 mark data presentationlarge data set
4. Joshua is investigating the daily total rainfall in Hurn for May to October 2015 Using the information from the large data set, Joshua wishes to calculate the mean of the daily total rainfall in Hurn for May to October 2015 (a) Using your knowledge of the large data set, explain why Joshua needs to clean the data before calculating the mean. (1)
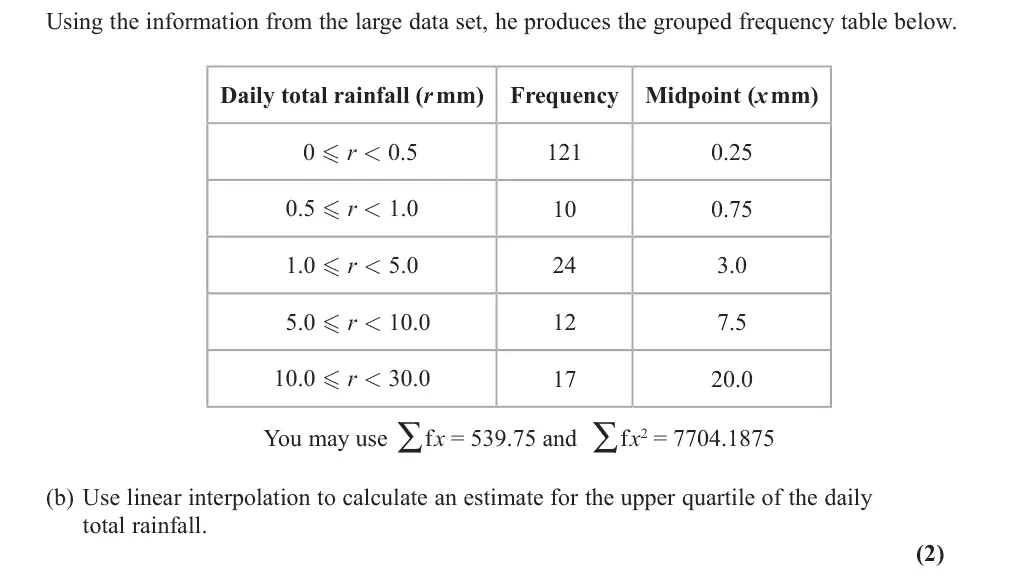
June 2019 · AS Paper 2 (Statistics) · Q4(b) 2 marks data presentation
Using the information from the large data set, he produces the grouped frequency table below. Daily total rainfall (r mm) Frequency Midpoint (x mm) 0 - r : 0.5 0.25 0.5 - r : 1.0 0.75 1.0 - r : 5.0 3.0 5.0 - r : 10.0 7.5 10.0 - r : 30.0 20.0 You may use ∑fx = 539.75 and ∑fx2 = 7704.1875 (b) Use linear interpolation to calculate an estimate for the upper quartile of the daily total rainfall. (2)
June 2019 · AS Paper 2 (Statistics) · Q4(c) 2 marks data presentation
(c) Calculate an estimate for the standard deviation of the daily total rainfall in Hurn for May to October 2015 (2)
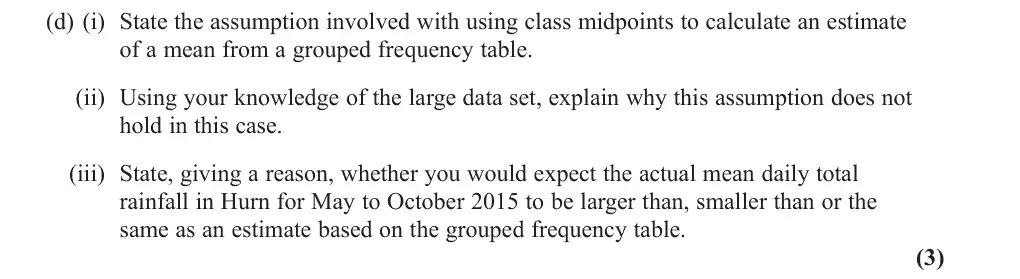
June 2019 · AS Paper 2 (Statistics) · Q4(d) 3 marks data presentationlarge data set
(d) (i) State the assumption involved with using class midpoints to calculate an estimate of a mean from a grouped frequency table. (ii) Using your knowledge of the large data set, explain why this assumption does not hold in this case. (iii) State, giving a reason, whether you would expect the actual mean daily total rainfall in Hurn for May to October 2015 to be larger than, smaller than or the same as an estimate based on the grouped frequency table. (3)
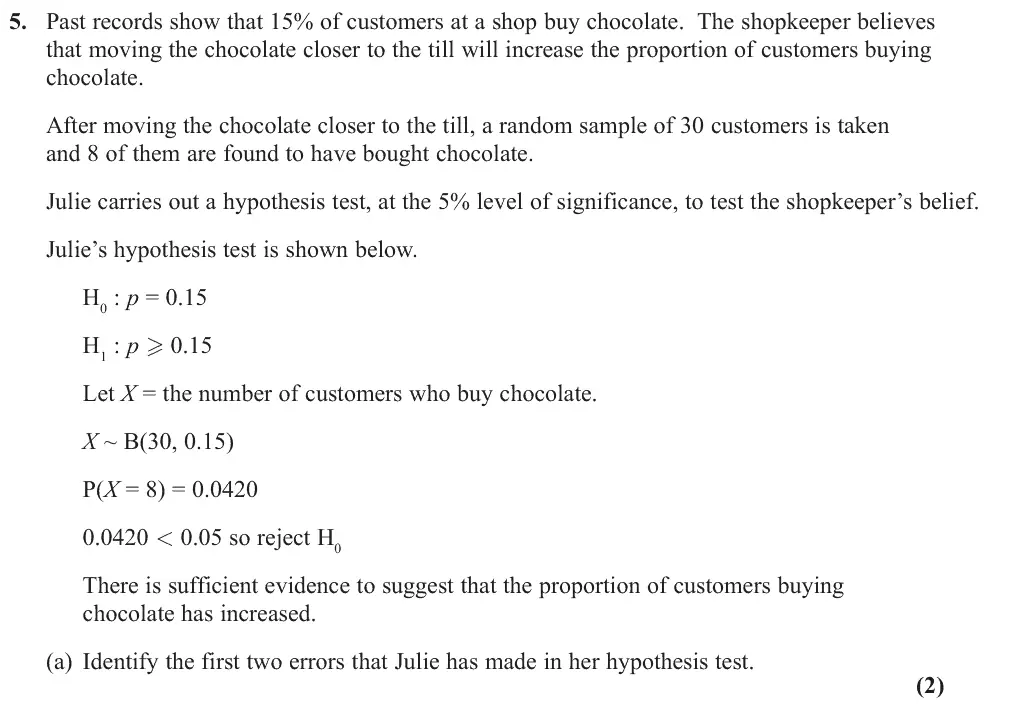
June 2019 · AS Paper 2 (Statistics) · Q5(a) 2 marks hypothesis testing
5. Past records show that 15% of customers at a shop buy chocolate. The shopkeeper believes that moving the chocolate closer to the till will increase the proportion of customers buying chocolate. After moving the chocolate closer to the till, a random sample of 30 customers is taken and 8 of them are found to have bought chocolate. Julie carries out a hypothesis test, at the 5% level of significance, to test the shopkeeper’s belief. Julie’s hypothesis test is shown below. H0 : p = 0.15 H1 : p . 0.15 Let X = the number of customers who buy chocolate. X ~ B(30, 0.15) P(X = 8) = 0.0420 0.0420 : 0.05 so reject H0 There is sufficient evidence to suggest that the proportion of customers buying chocolate has increased. (a) Identify the first two errors that Julie has made in her hypothesis test. (2)
June 2019 · AS Paper 2 (Statistics) · Q5(b) 1 mark hypothesis testing
(b) Explain whether or not these errors will affect the conclusion of her hypothesis test. Give a reason for your answer. (1)
June 2019 · AS Paper 2 (Statistics) · Q5(c) 2 marks Hard hypothesis testingbinomial distribution
(c) Find, using a 5% level of significance, the critical region for a one-tailed test of the shopkeeper’s belief. The probability in the tail should be less than 0.05 (2)
June 2019 · AS Paper 2 (Statistics) · Q5(d) 1 mark Hard hypothesis testing
(d) Find the actual level of significance of this test. (1)

Find an Edexcel maths tutor

Want this paper marked and gone through with you? Message us.

Prefer email? Send an enquiry

If you are under 18, please include a parent's contact details. Enquiries go to enquiries@mathsaleveltutor.com and are deleted once handled.