S4.3 Choosing a distribution

Section
S4 Statistical distributions
Level
A level only
Statement
Select an appropriate probability distribution for a context, with appropriate reasoning, including recognising when the binomial or Normal model may not be appropriate.
Guidance
Students should know under what conditions a binomial distribution or a Normal distribution might be a suitable model.
Since 2018
9 parts, 12 marks · topic pages: Normal distribution, Data presentation: histograms, box plots, measures and outliers, The large data set, Discrete distributions and the binomial distribution, Probability, including conditional probability

Back to the checklist

June 2023 · Paper 3 (Statistics) · Q6(b) 1 mark
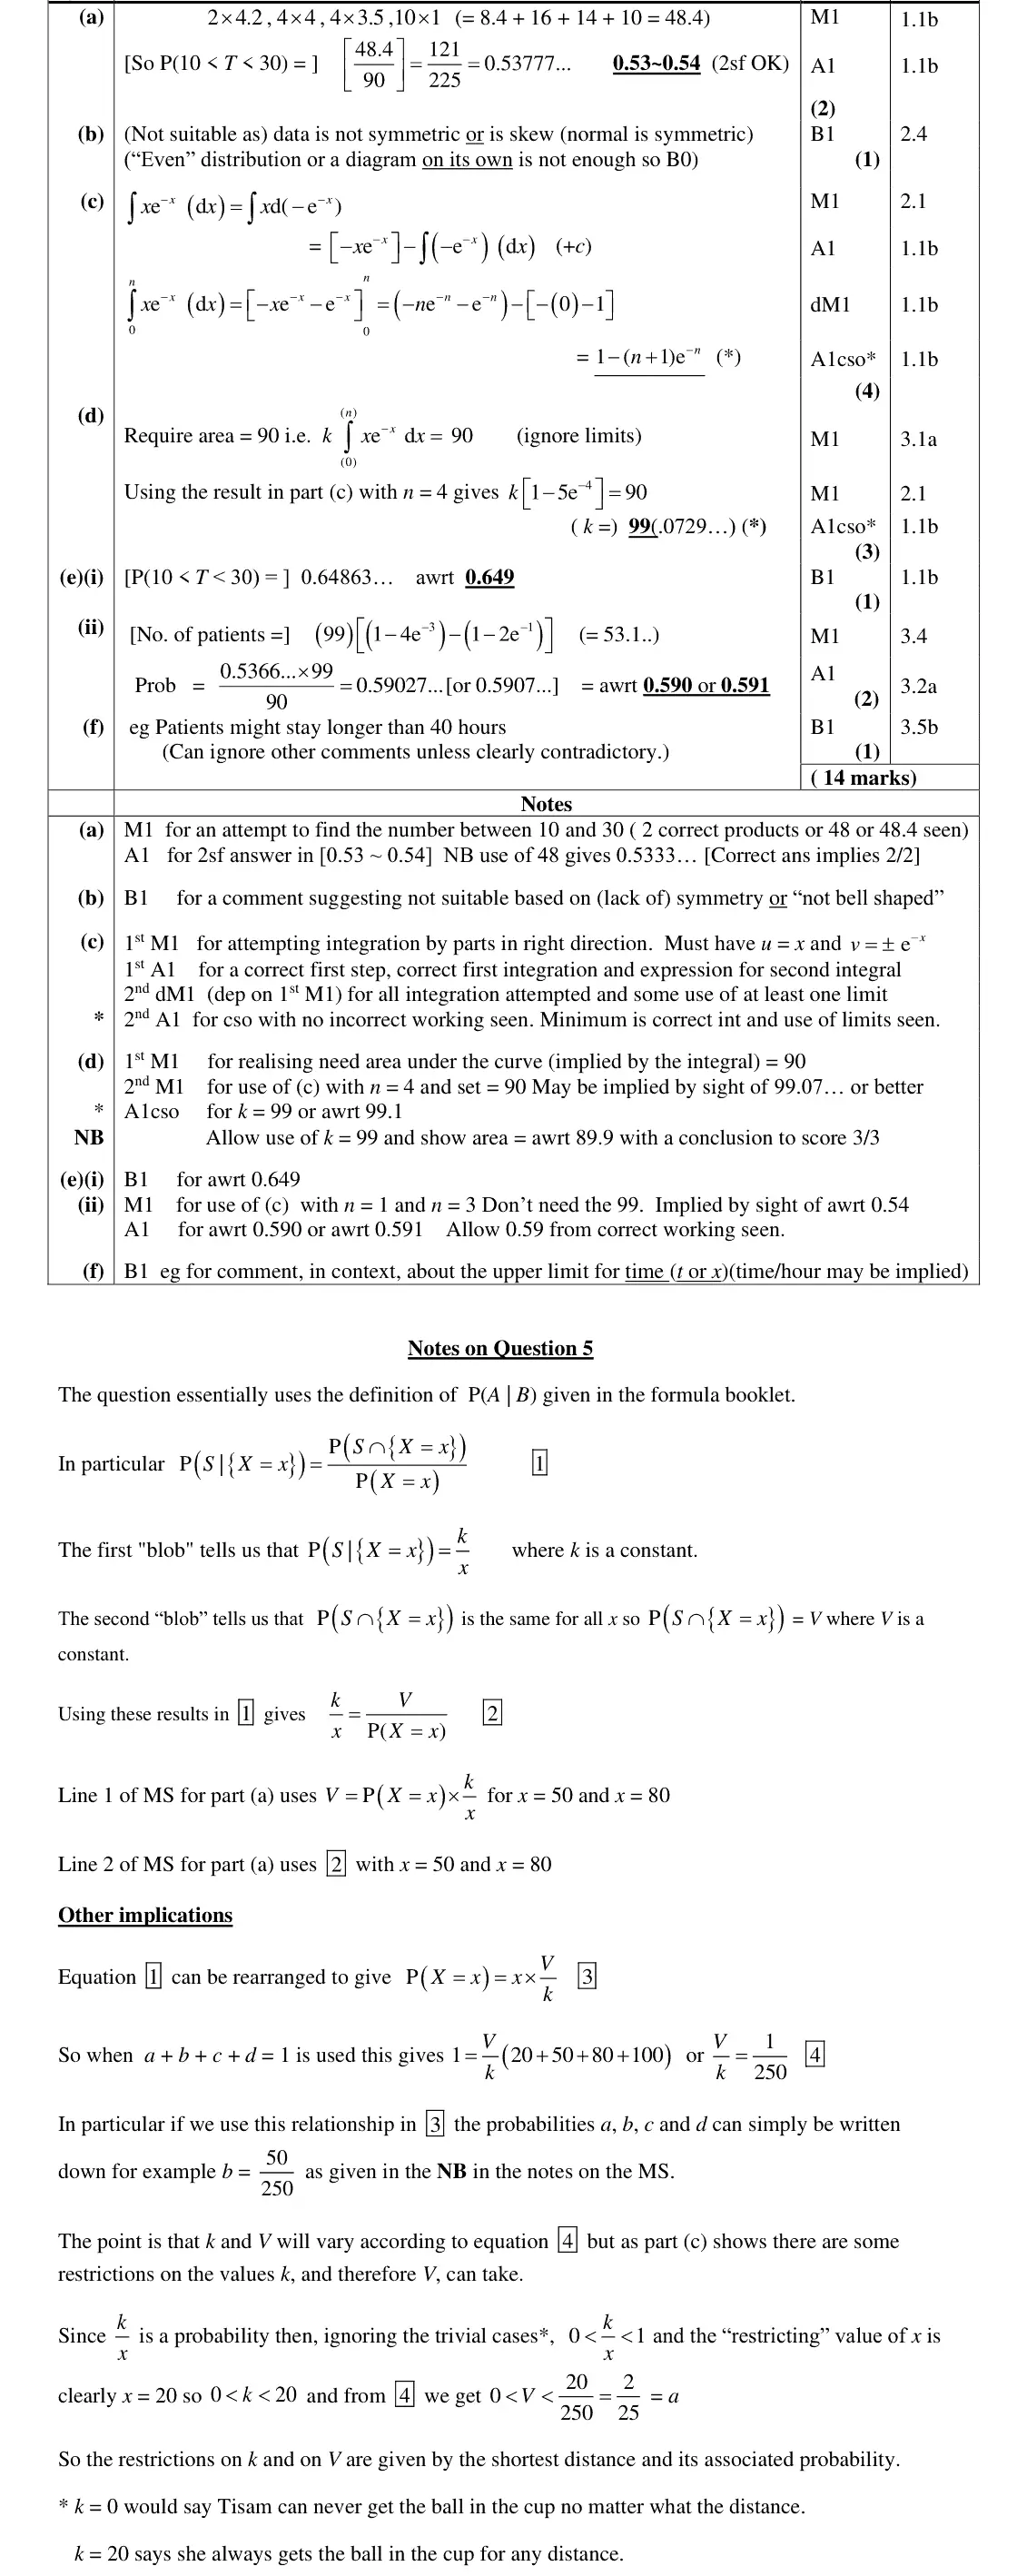
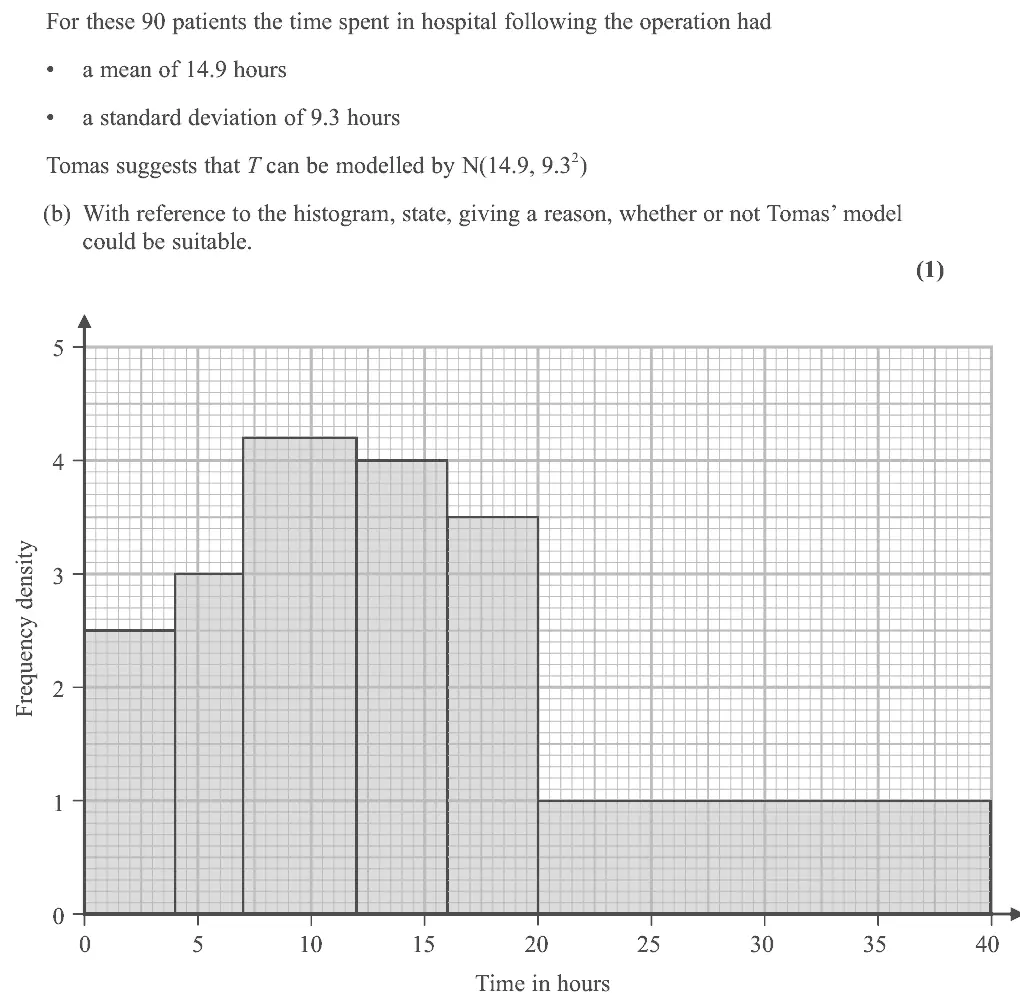
For these 90 patients the time spent in hospital following the operation had • a mean of 14.9 hours • a standard deviation of 9.3 hours Tomas suggests that T can be modelled by N(14.9, 9.3 2) (b) With reference to the histogram, state, giving a reason, whether or not Tomas’ model could be suitable. (1)
June 2022 · Paper 3 (Statistics) · Q3(d) 1 mark
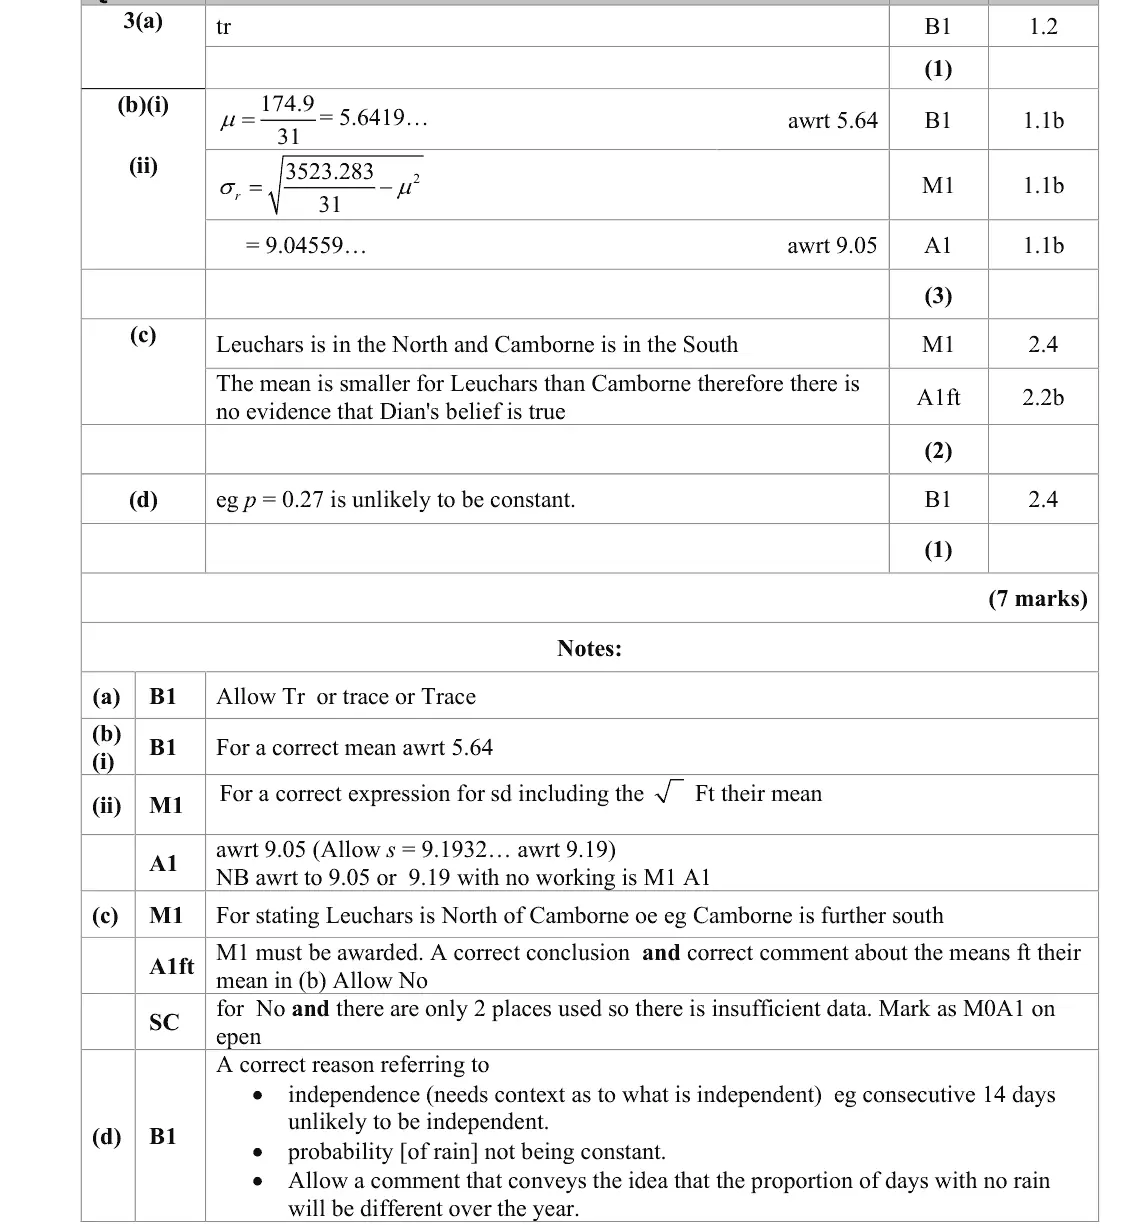
Dian uses the large data set to estimate the proportion of days with no rain in Camborne for 1987 to be 0.27 to 2 decimal places. (d) Explain why the distribution B(14, 0.27) might not be a reasonable model for the number of days without rain for a 14‑day summer event. (1)
Oct 2020 · Paper 3 (Statistics) · Q5(c)(iii) 1 mark Easy
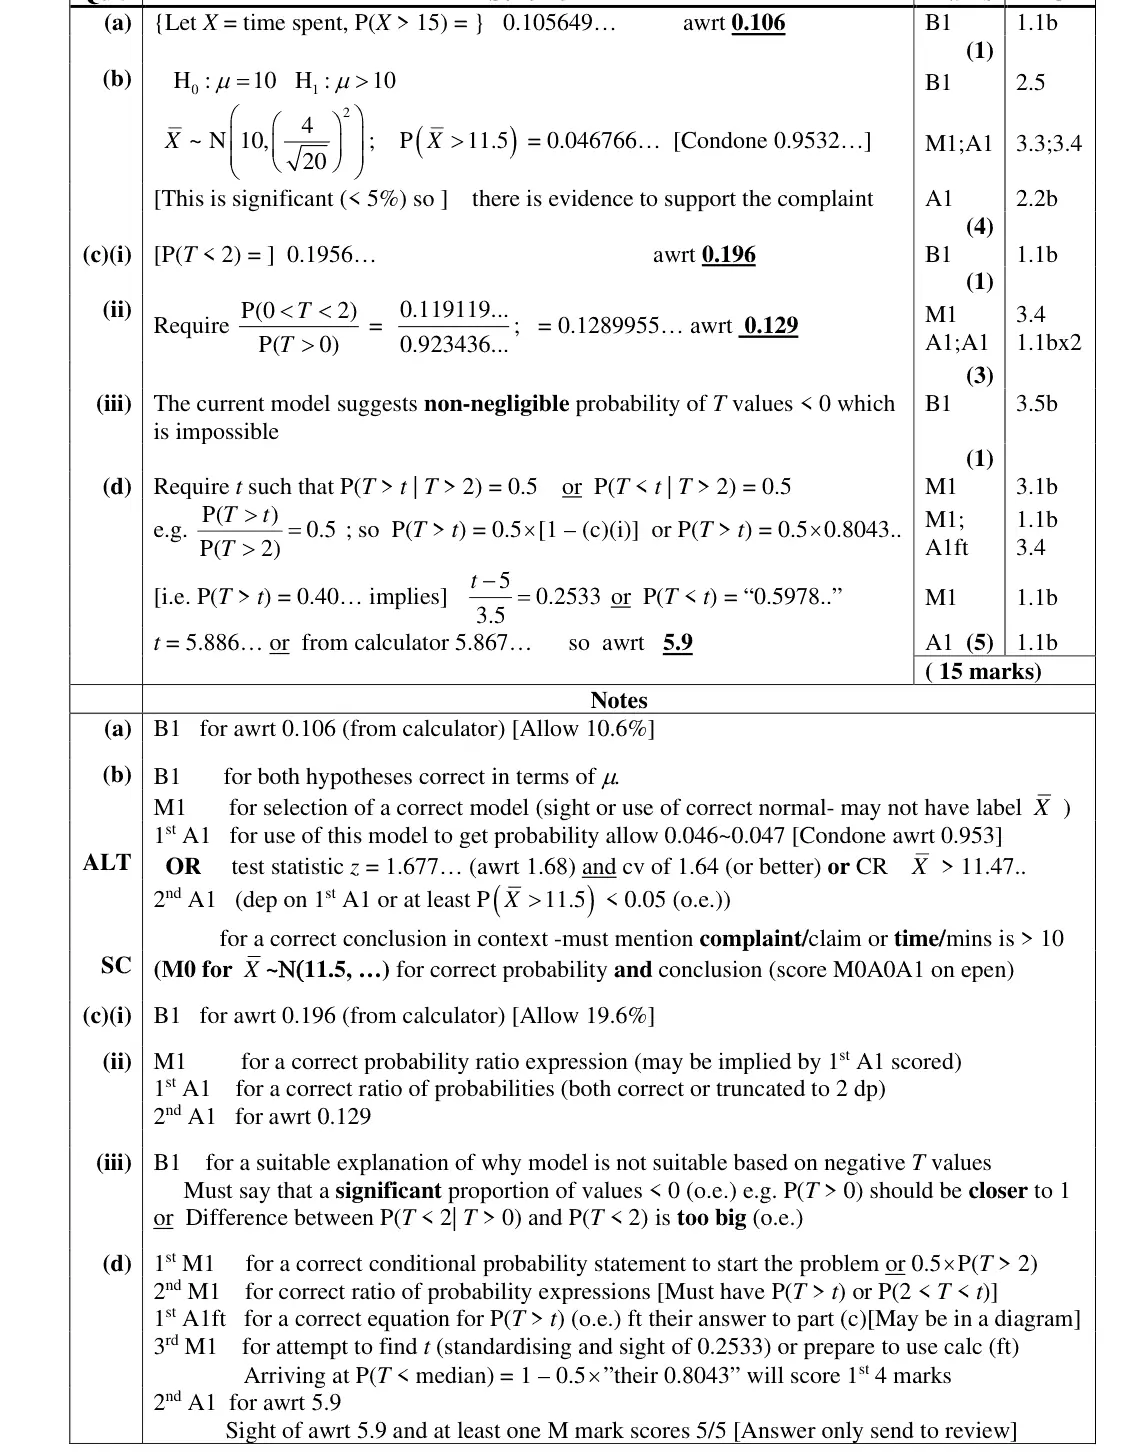
(iii) hence explain why this normal distribution may not be a good model for T. (1)
June 2019 · Paper 3 (Statistics) · Q2(e) 2 marks
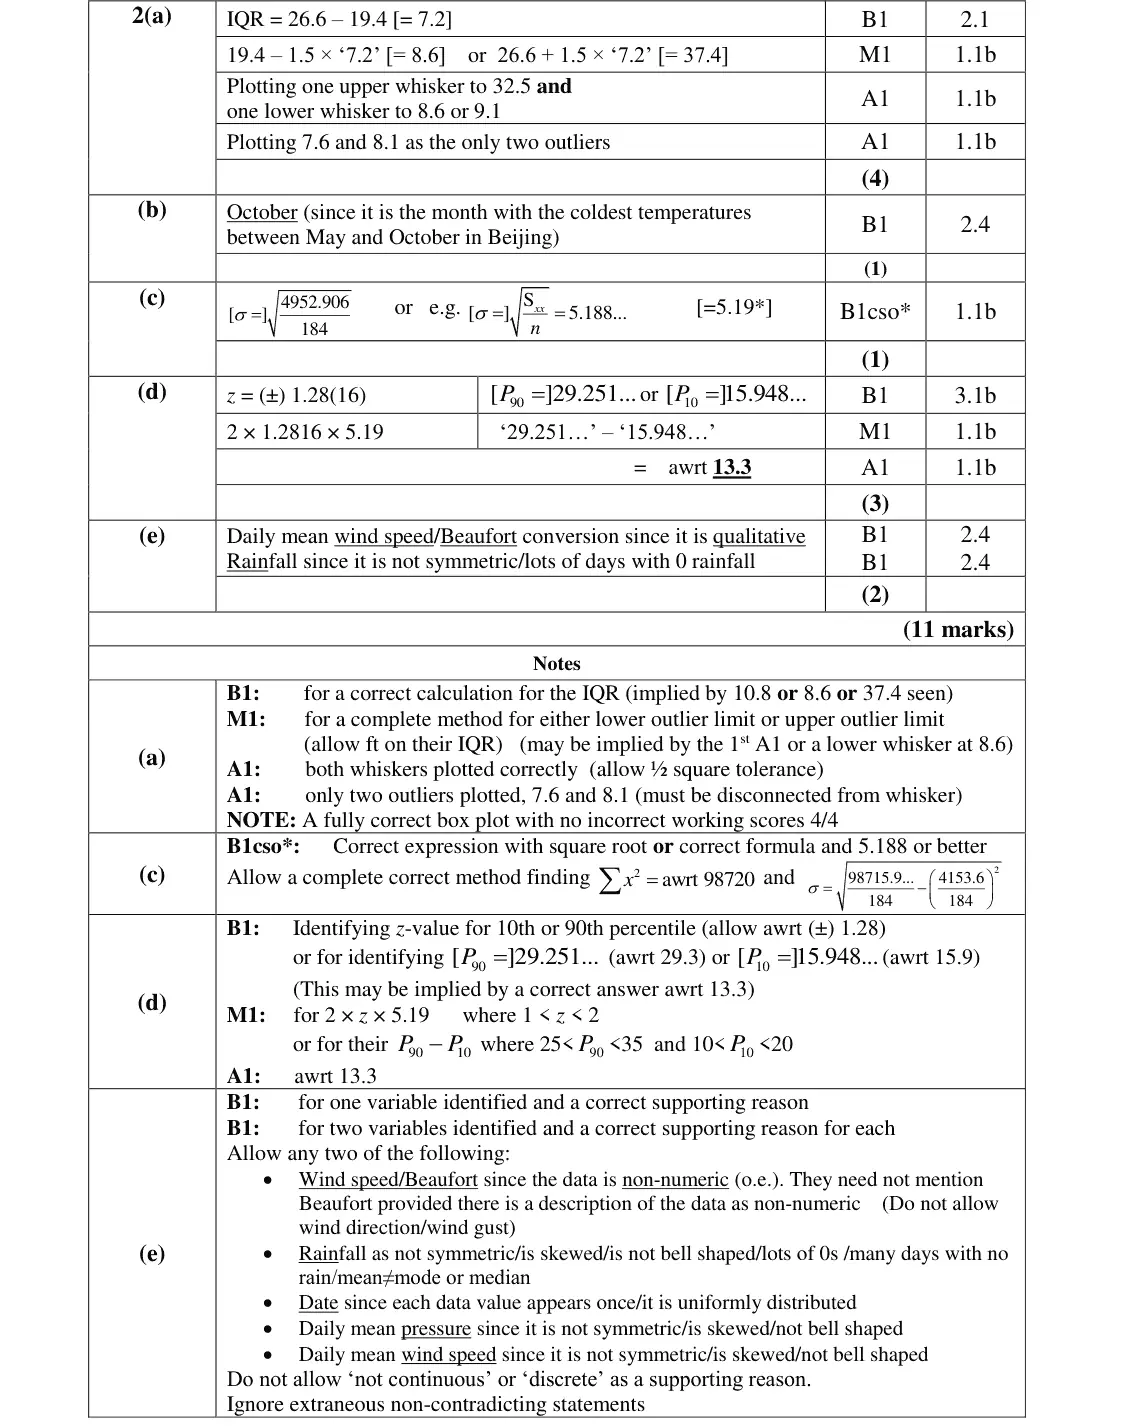
Simon wants to model another variable from the large data set for Beijing using a normal distribution. (e) State two variables from the large data set for Beijing that are not suitable to be modelled by a normal distribution. Give a reason for each answer.
June 2019 · Paper 3 (Statistics) · Q4(c) 1 mark
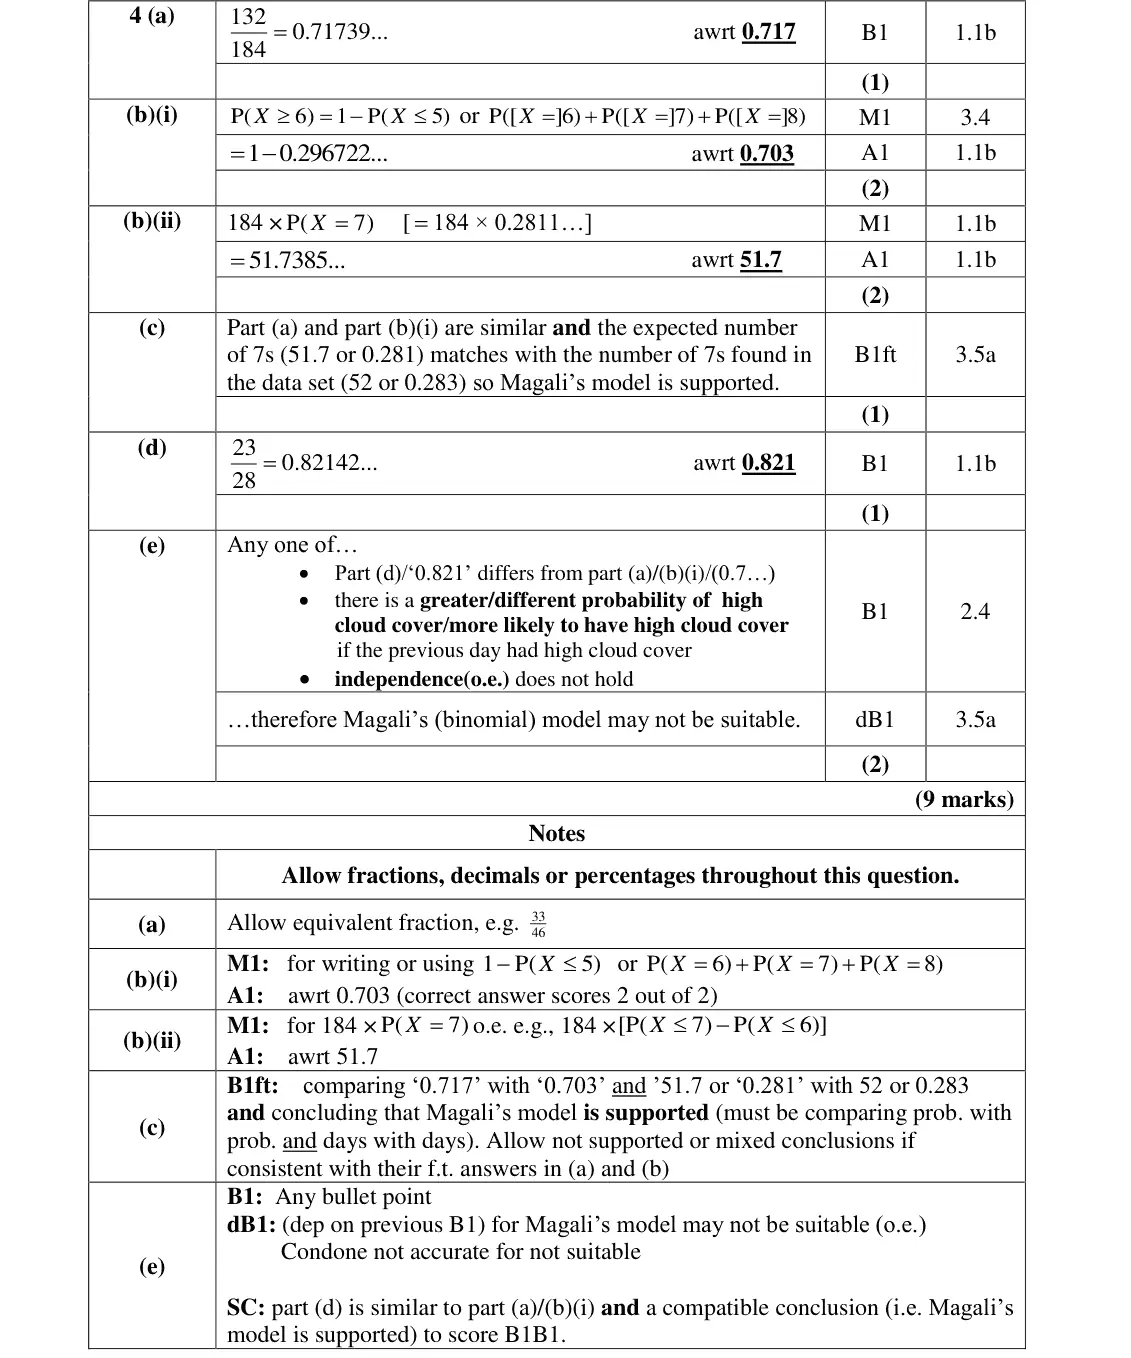
(c) Explain whether or not your answers to part (b) support the use of Magali’s model.
June 2019 · Paper 3 (Statistics) · Q4(e) 2 marks
(e) Comment on Magali’s model in light of your answer to part (d).
June 2018 · Paper 3 · Q1(c) 1 mark
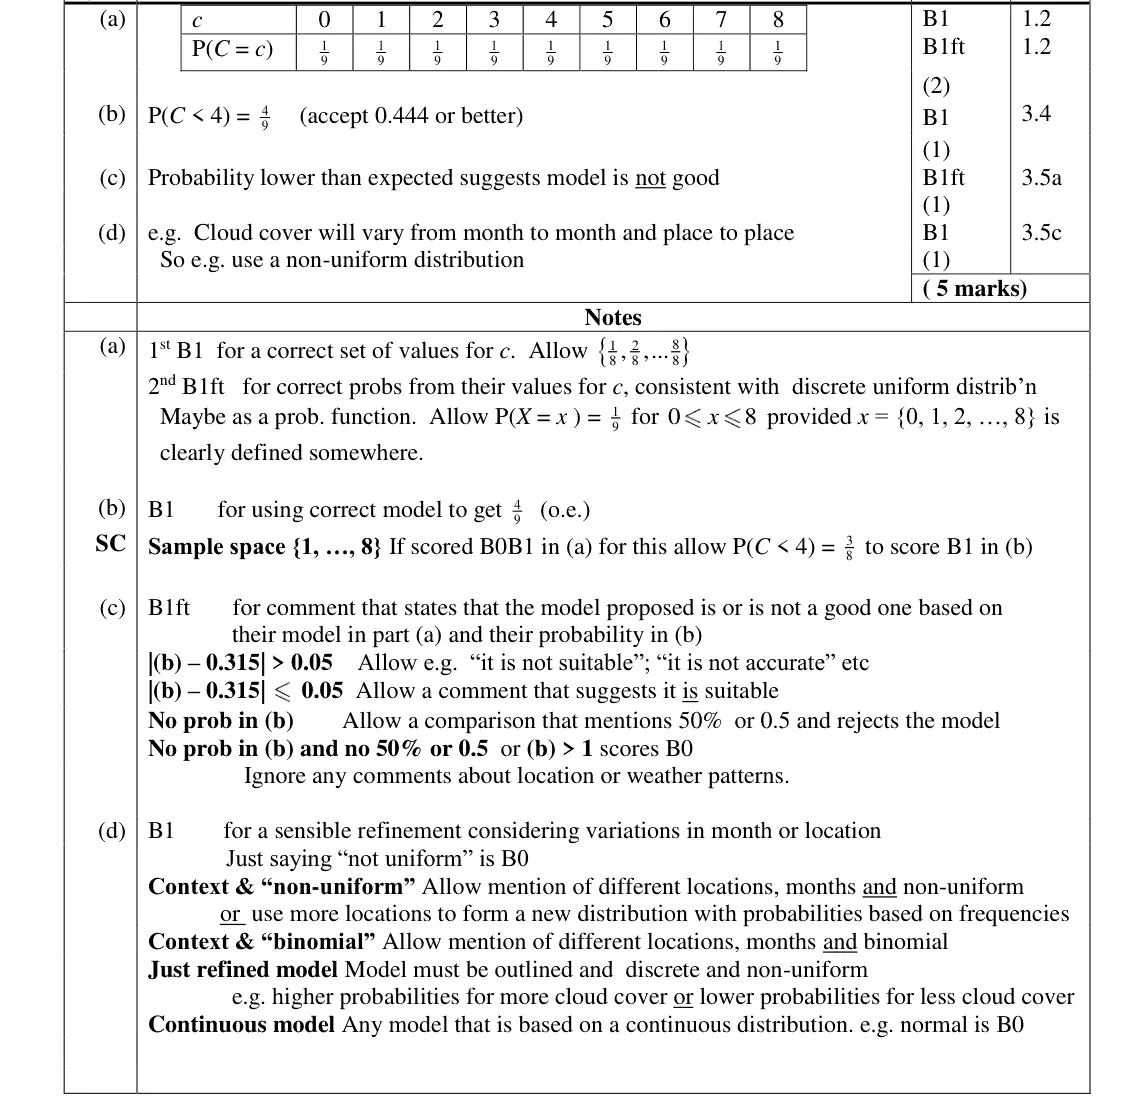
Helen used all the data from the large data set for Hurn in 2015 and found that the proportion of days with cloud cover of less than 50% was 0.315 (c) Comment on the suitability of Helen’s model in the light of this information. (1)
June 2018 · Paper 3 · Q1(d) 1 mark
(d) Suggest an appropriate refinement to Helen’s model. (1)
June 2018 · Paper 3 · Q3(a) 2 marks
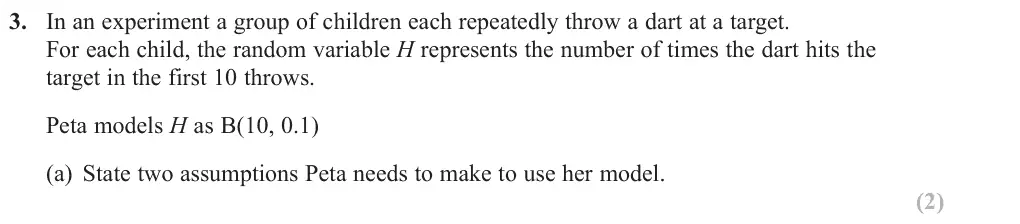
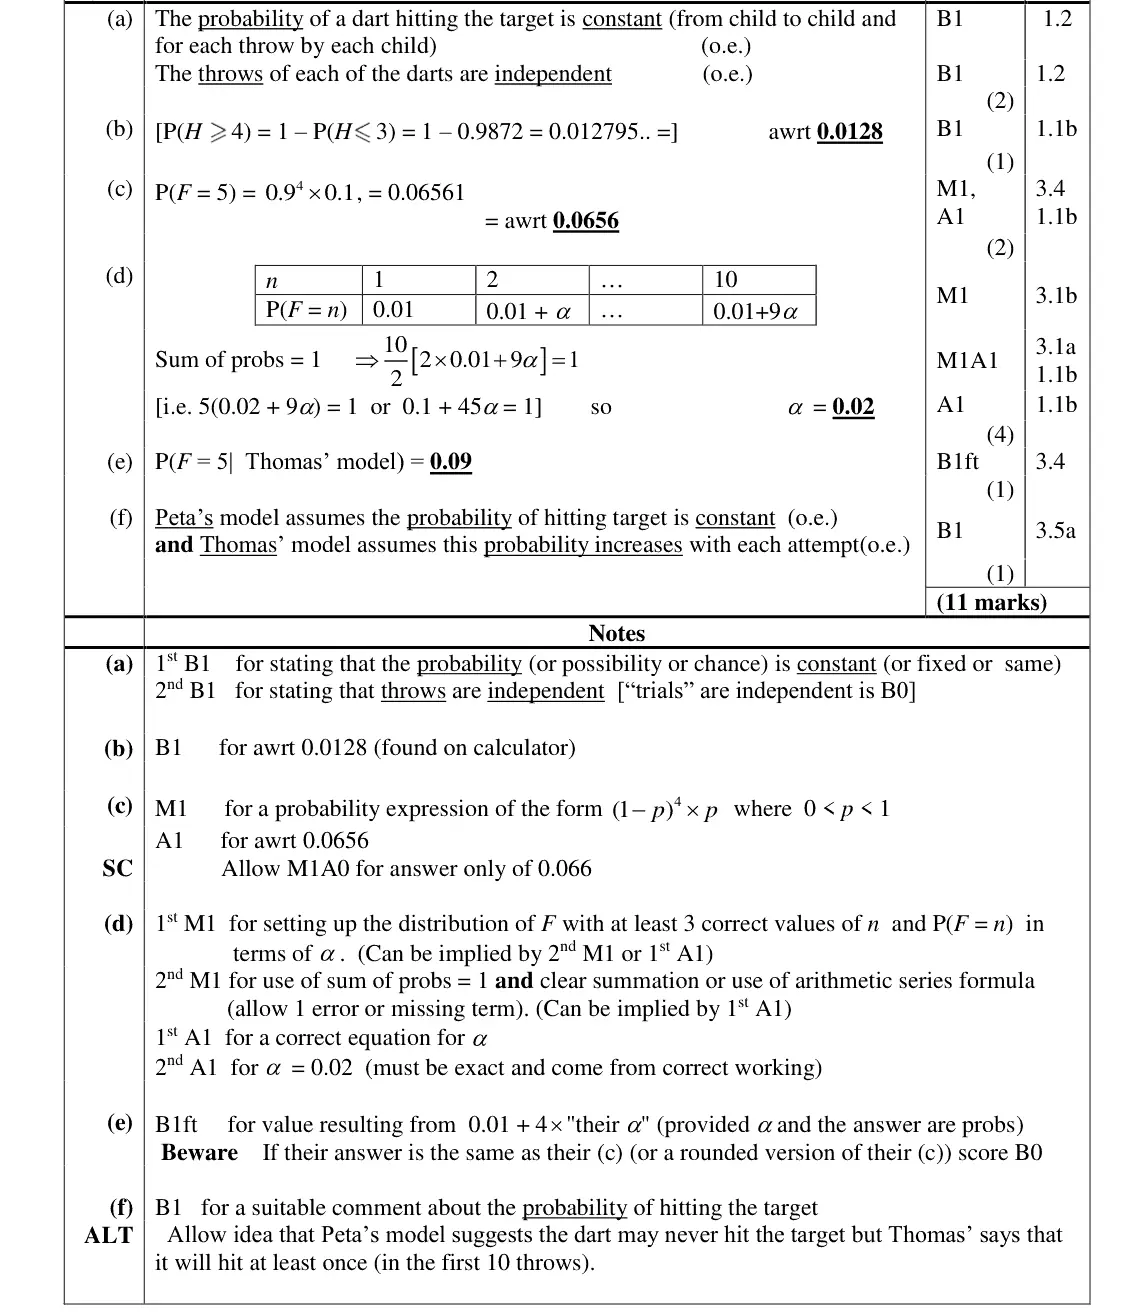
3. In an experiment a group of children each repeatedly throw a dart at a target. For each child, the random variable H represents the number of times the dart hits the target in the first 10 throws. Peta models H as B(10, 0.1) (a) State two assumptions Peta needs to make to use her model. (2)

Find an Edexcel maths tutor

Stuck on this? Book a trial session with an Edexcel specialist.

Prefer email? Send an enquiry

If you are under 18, please include a parent's contact details. Enquiries go to enquiries@mathsaleveltutor.com and are deleted once handled.