S3.3 Modelling with probability

Section
S3 Probability
Level
A level only
Statement
Modelling with probability, including critiquing assumptions made and the likely effect of more realistic assumptions.
Guidance
For example, questioning the assumption that a die or coin is fair.
Since 2018
8 parts, 15 marks · topic pages: Probability, including conditional probability, Discrete distributions and the binomial distribution, Data presentation: histograms, box plots, measures and outliers, Normal distribution

Back to the checklist

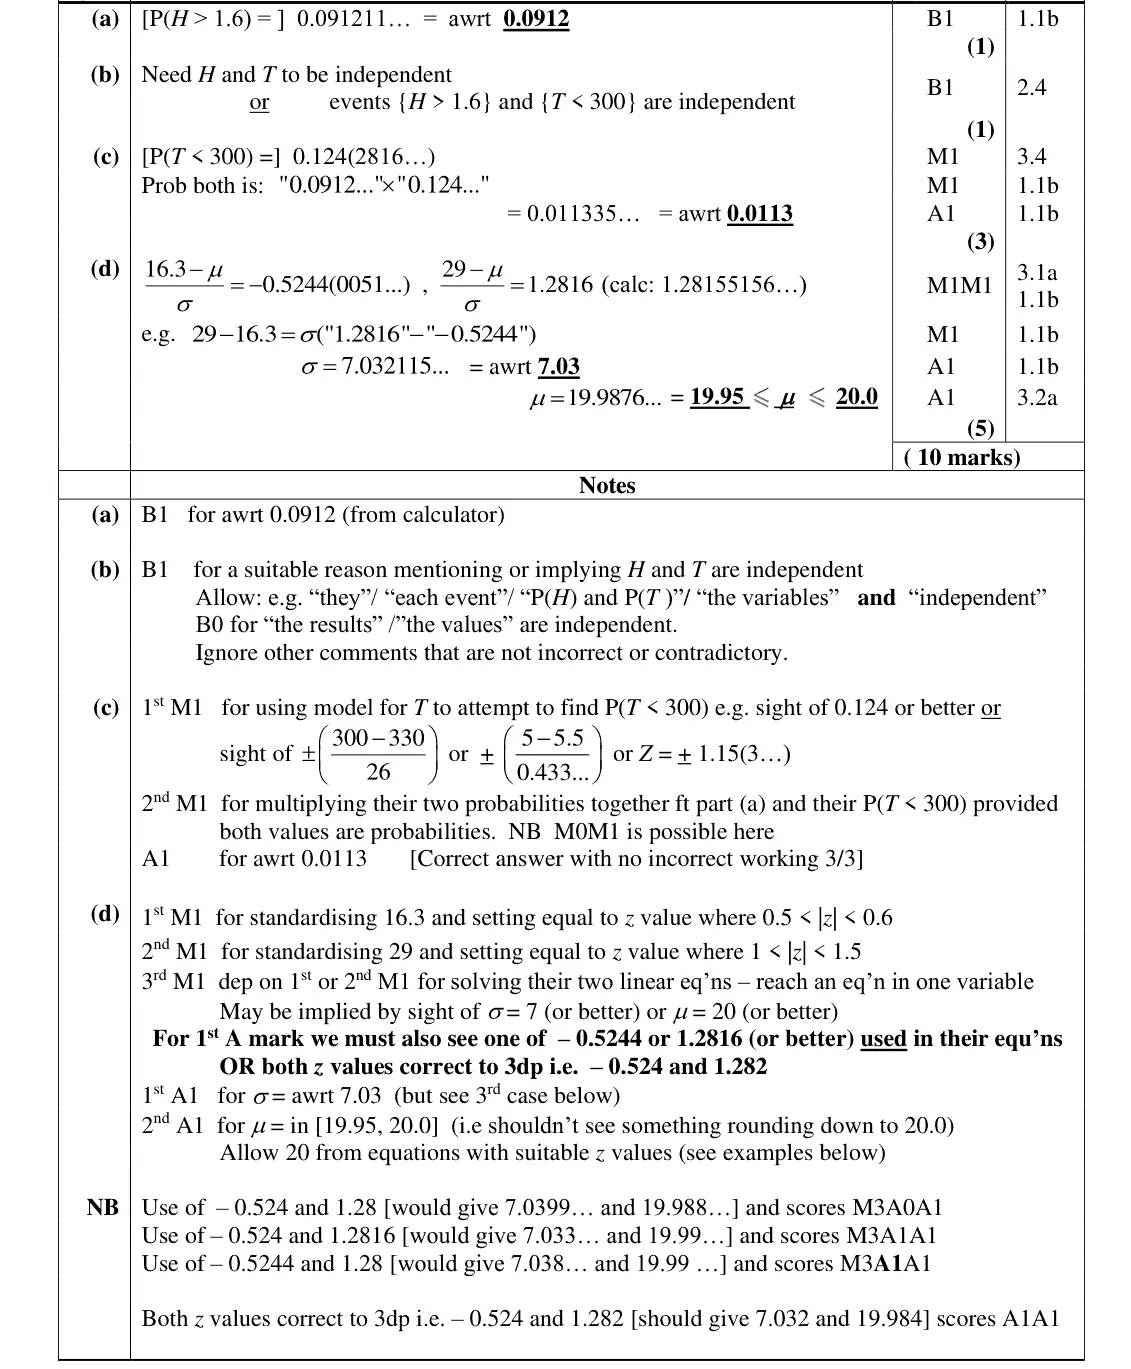
June 2024 · Paper 3 (Statistics) · Q5(b) 1 mark
The records also show that the time, T seconds, to run 1500 metres is normally distributed with mean 330 seconds and standard deviation 26 seconds. The school’s Head would like to use these distributions to estimate the proportion of students from the school athletics club who can jump higher than 1.6 metres and can run 1500 metres in less than 5 minutes. (b) State a necessary assumption about H and T for the Head to calculate an estimate of this proportion. (1)
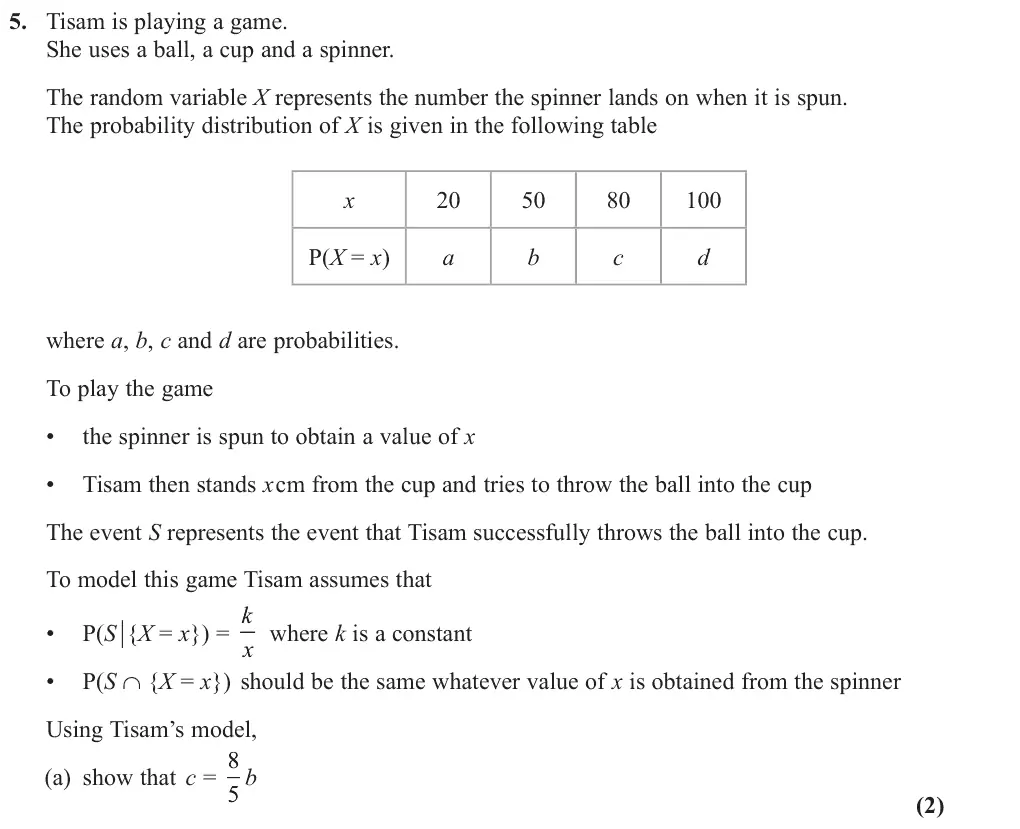
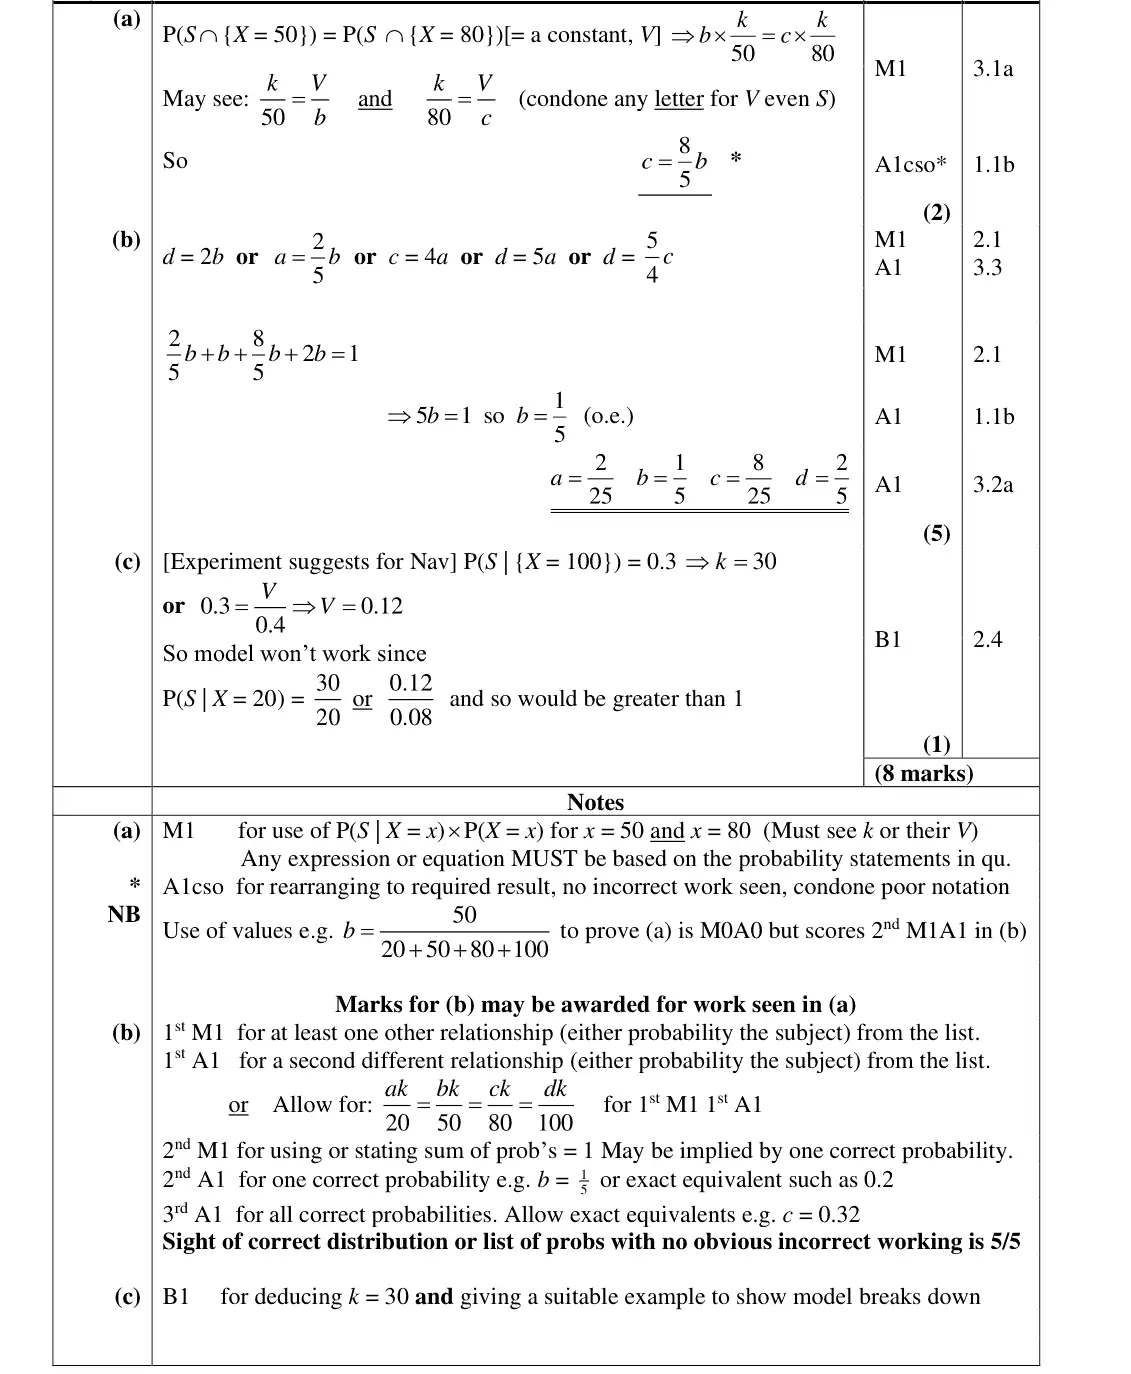
June 2023 · Paper 3 (Statistics) · Q5(a) 2 marks
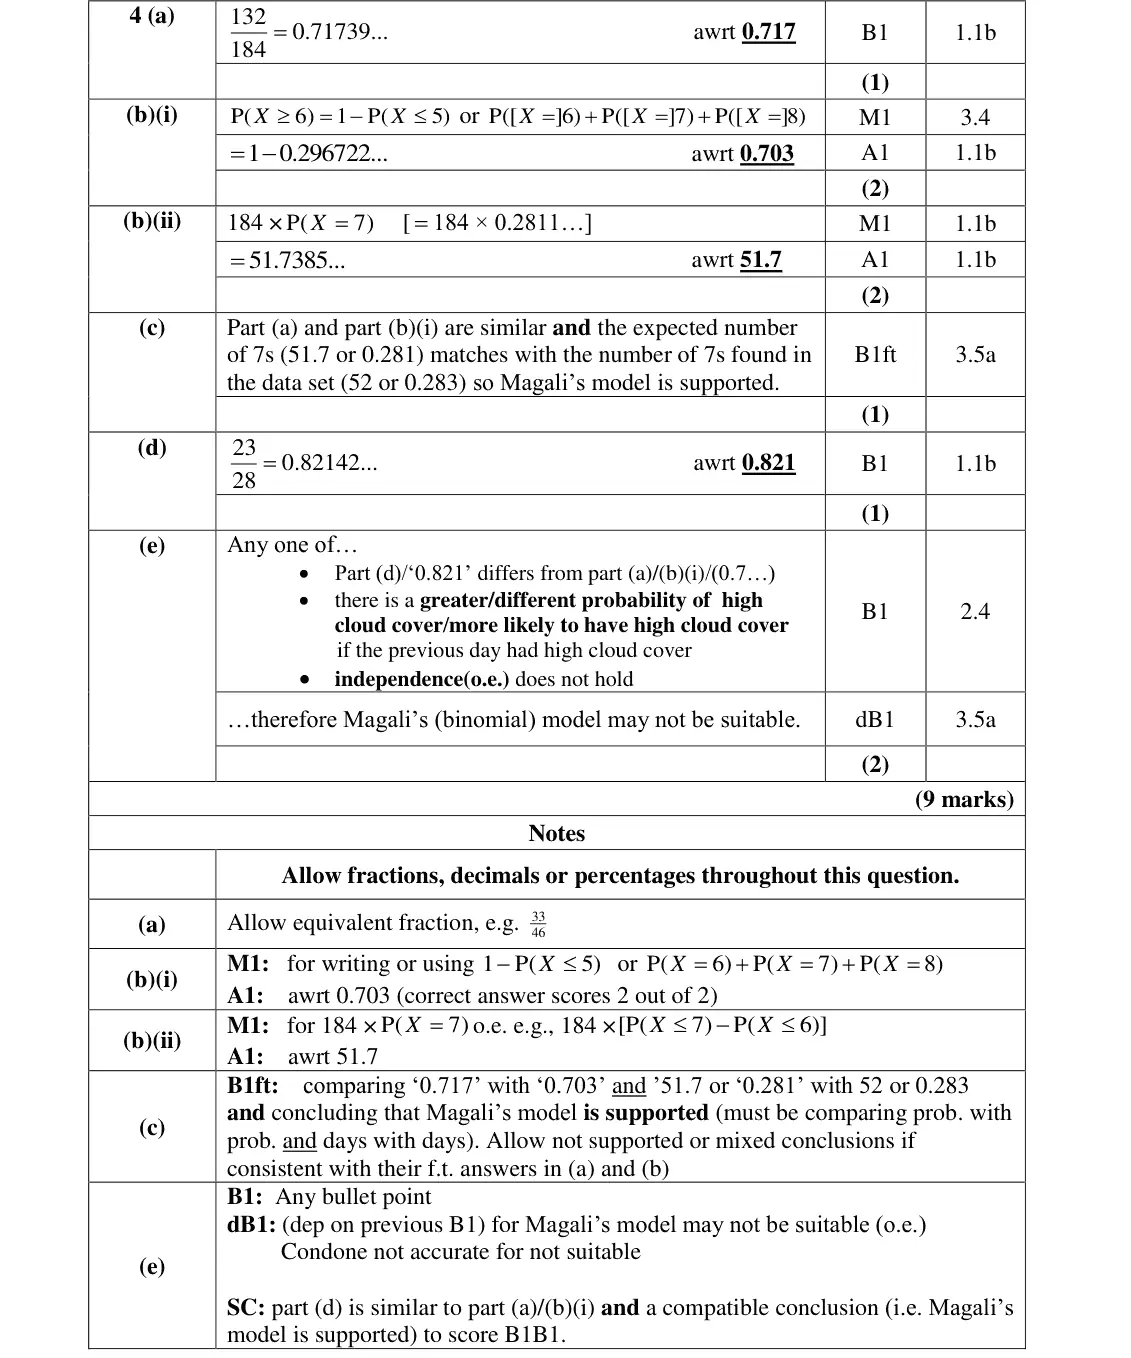
5. Tisam is playing a game. She uses a ball, a cup and a spinner. The random variable X represents the number the spinner lands on when it is spun. The probability distribution of X is given in the following table x P(X = x) a b c d where a, b, c and d are probabilities. To play the game • the spinner is spun to obtain a value of x • Tisam then stands x cm from the cup and tries to throw the ball into the cup The event S represents the event that Tisam successfully throws the ball into the cup. To model this game Tisam assumes that P(S½{X = x}) = k • x where k is a constant • P(S ∩ {X = x}) should be the same whatever value of x is obtained from the spinner Using Tisam’s model, (a) show that c = 8 5 b (2)
June 2023 · Paper 3 (Statistics) · Q5(b) 5 marks
(b) find the probability distribution of X (5)
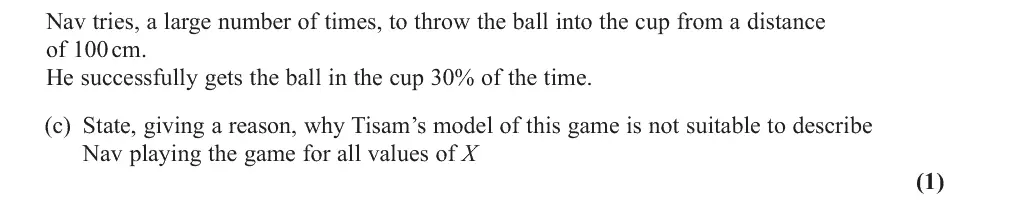
June 2023 · Paper 3 (Statistics) · Q5(c) 1 mark
Nav tries, a large number of times, to throw the ball into the cup from a distance of 100 cm. He successfully gets the ball in the cup 30% of the time. (c) State, giving a reason, why Tisam’s model of this game is not suitable to describe Nav playing the game for all values of X (1)
June 2023 · Paper 3 (Statistics) · Q6(f) 1 mark
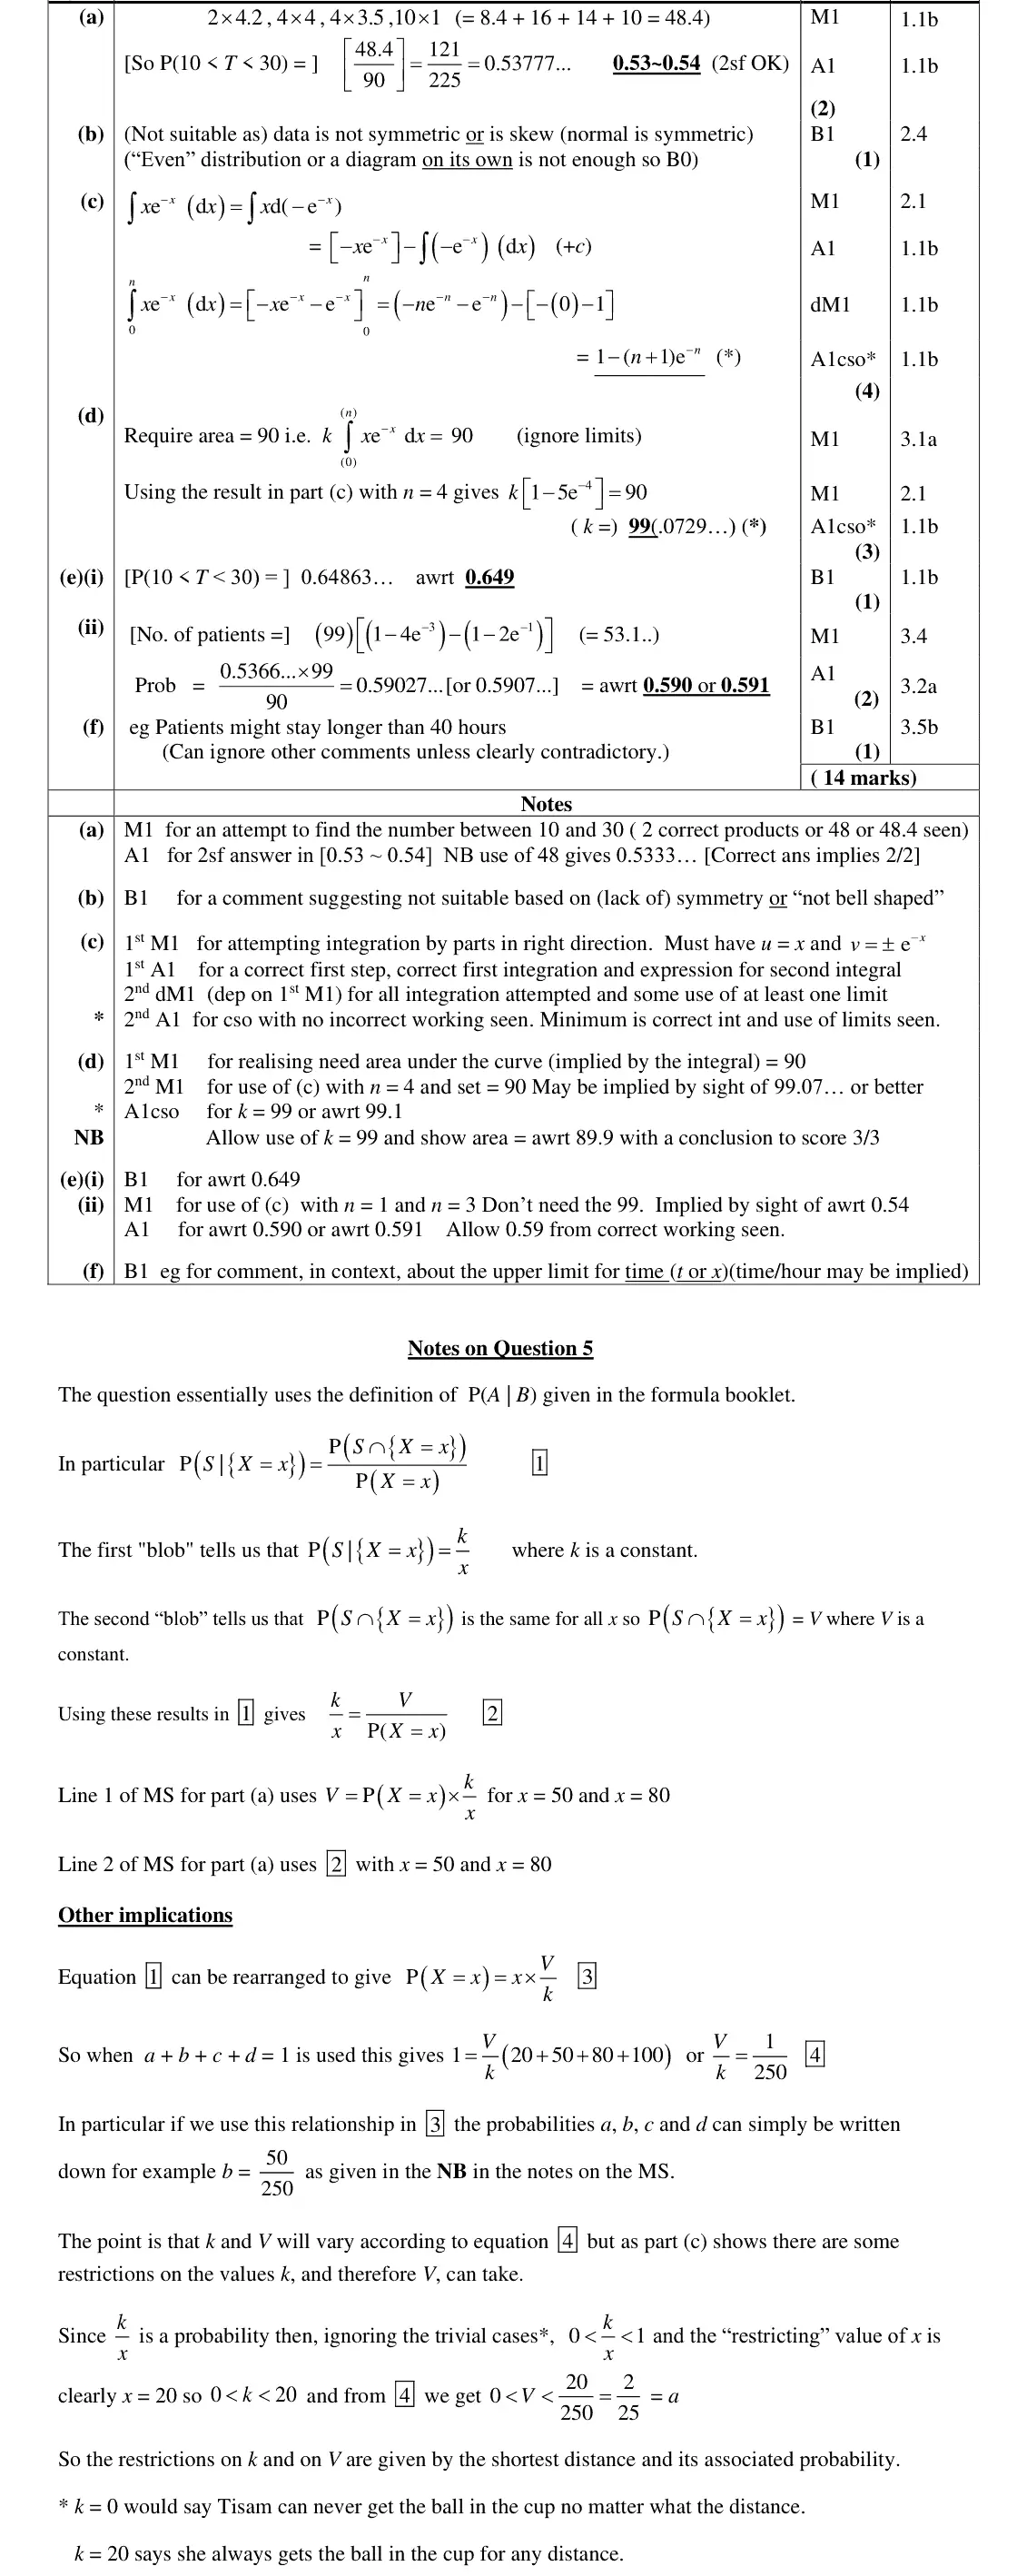
The researcher decides to use Xiang’s curve to model P(a < T < b) (f) State one limitation of Xiang’s model. (1)
June 2019 · Paper 3 (Statistics) · Q4(e) 2 marks
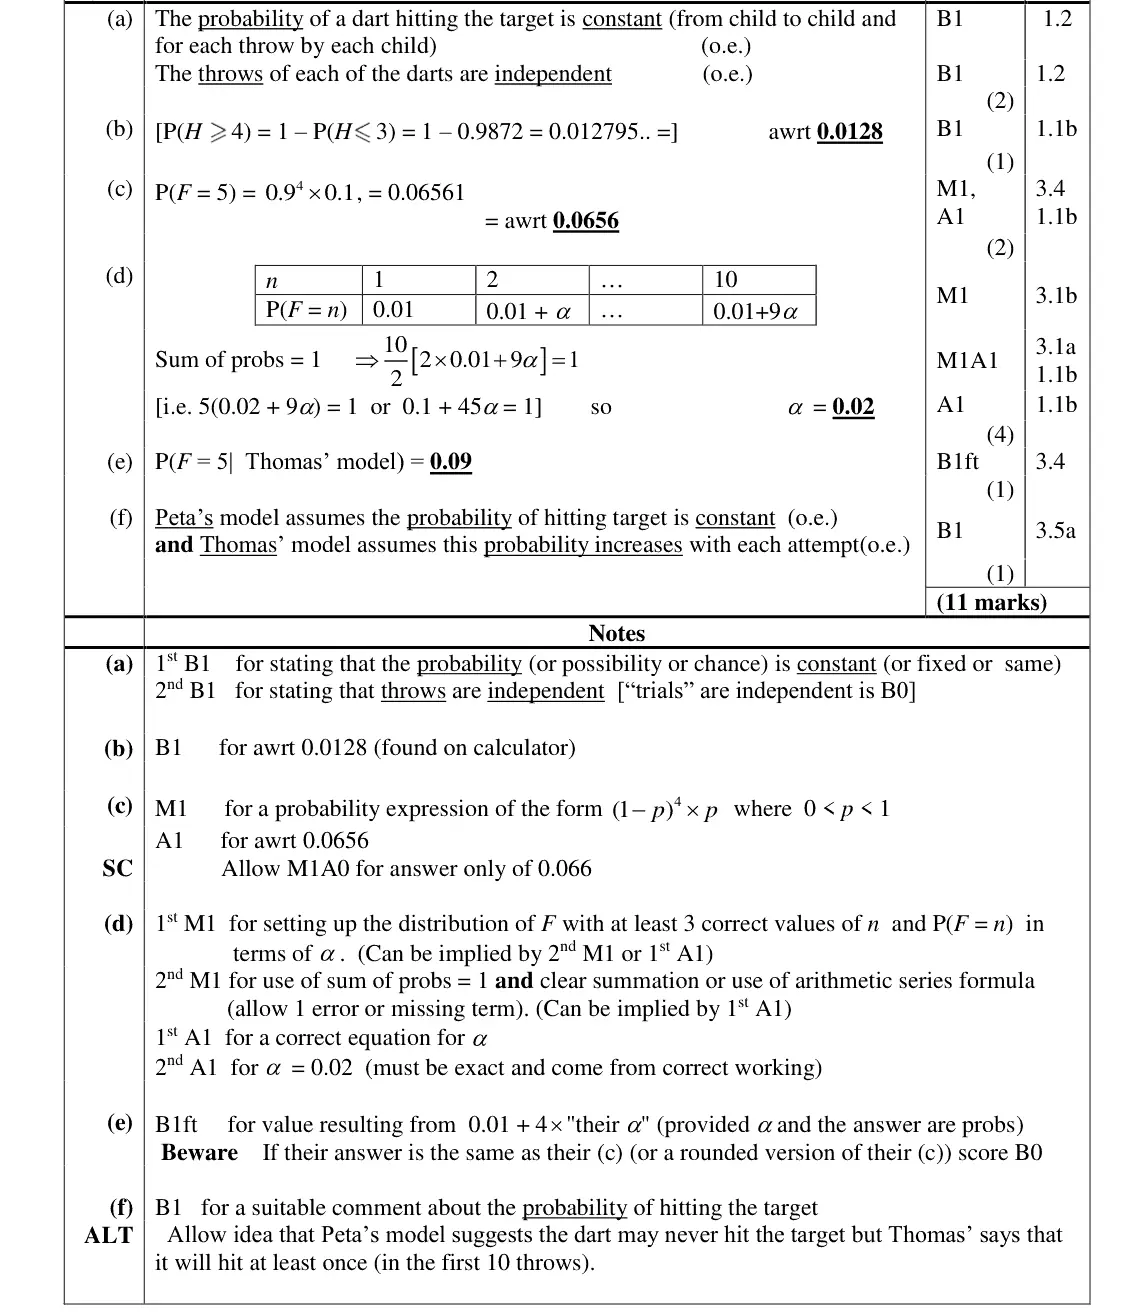
(e) Comment on Magali’s model in light of your answer to part (d).
June 2018 · Paper 3 · Q3(c) 2 marks
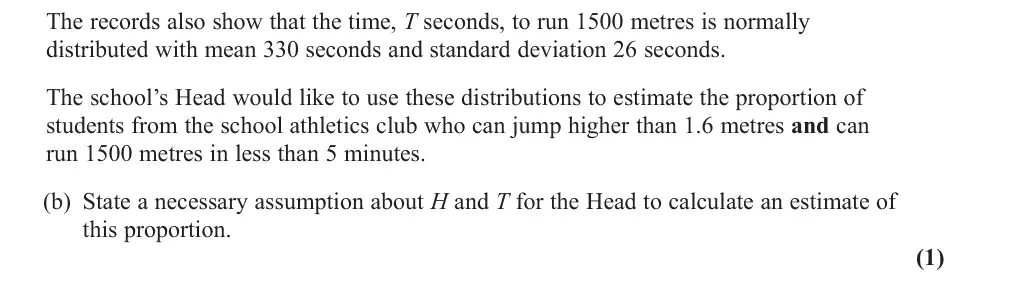
For each child the random variable F represents the number of the throw on which the dart first hits the target. Using Peta’s assumptions about this experiment, (c) find P(F = 5) (2)
June 2018 · Paper 3 · Q3(f) 1 mark
(f) Explain how Peta’s and Thomas’ models differ in describing the probability that a dart hits the target in this experiment. (1)

Find an Edexcel maths tutor

Stuck on this? Book a trial session with an Edexcel specialist.

Prefer email? Send an enquiry

If you are under 18, please include a parent's contact details. Enquiries go to enquiries@mathsaleveltutor.com and are deleted once handled.