Understand, use and interpret graphs in kinematics for motion in a straight line: displacement against time and interpretation of gradient; velocity against time and interpretation of gradient and area under the graph.
Mark scheme (whole question; this part is marked with the orange bar)
Examiner's comment
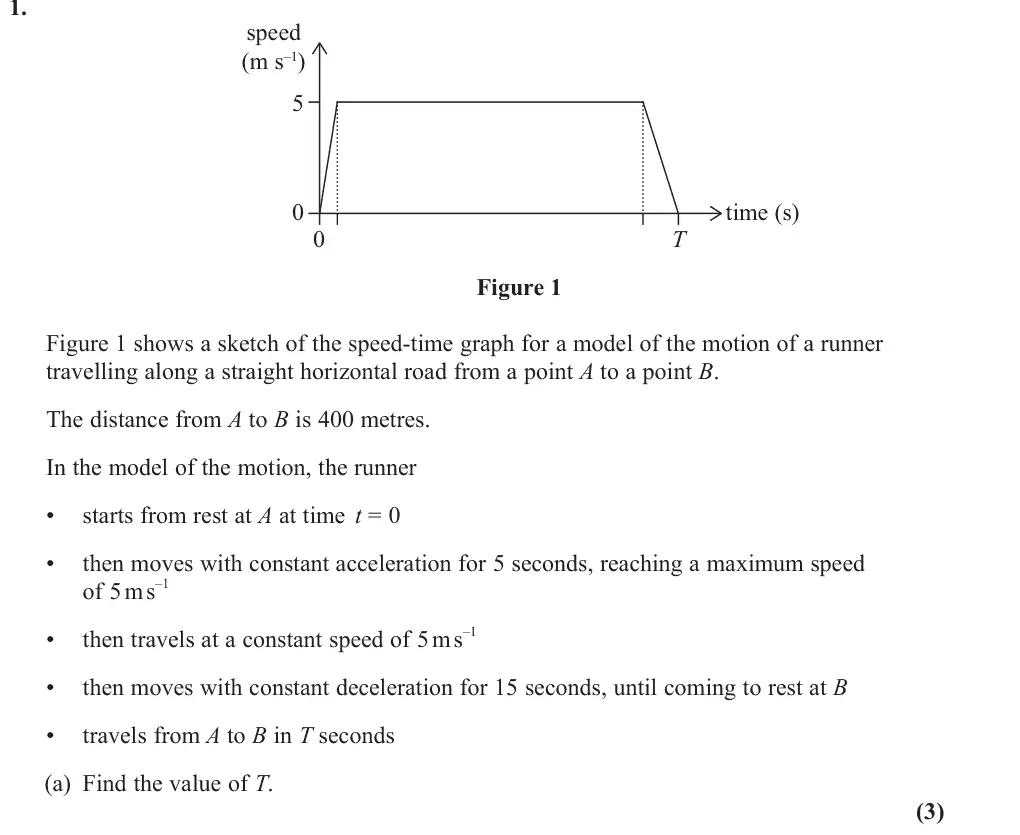
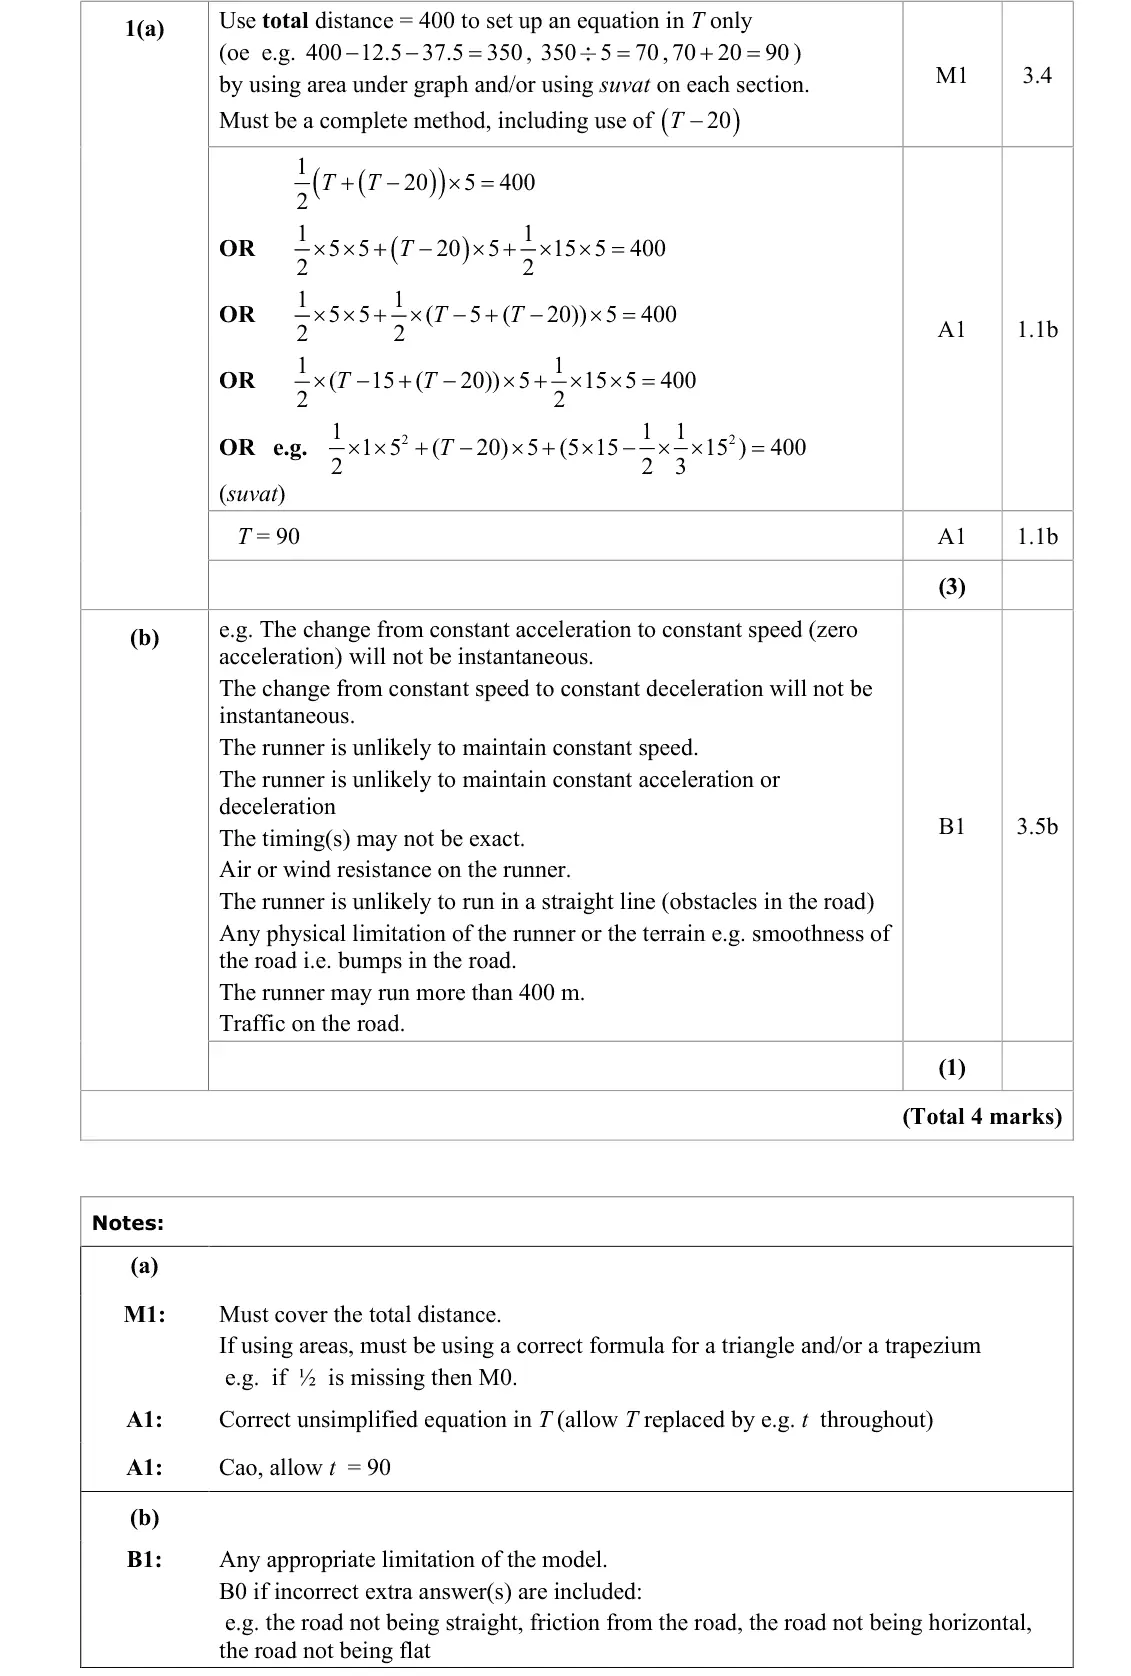
In part (a), the majority of candidates made an attempt to equate the area under the graph to the distance covered. Some used the formula for the area of a trapezium to form an equation in T but the parallel sides were not always identified correctly as T and (T -20). However, the most common approach was to use the area of a triangle, rectangle and triangle respectively for each of the three stages of the motion. Many who used this approach found the time for the constant speed was 70 seconds and then added 5 and 15 to find T= 90 as required. Those who just left their final answer as 70 gained no credit as there was no complete method to find T. A few added the distances rather than the times to 70 showing confusion in their understanding. A small number of candidates used suvat equations for each of the three stages but those using this approach seemed more likely to make an error with one or more of the values. Occasionally attempts were seen using a single suvat equation with s = 400.
Common mistakes
total area under the speed-time graph = 400: ½(T + (T − 20)) × 5 = 400 or triangle + rectangle + triangle gives T = 90
the parallel sides of the trapezium are T and T − 20
leaving 70 (the constant-speed time) scores 0
adding distances to 70 instead of the times 5 and 15
the ½ is needed for the M mark
June 2025 · AS Paper 2 (Mechanics) · Q1(b)1 mark
Mark scheme (whole question; this part is marked with the orange bar)
Examiner's comment
In part (b), the reasons given for the actual time being different from T were many and varied but usually gained the mark by stating, for example, either a physical factor that could affect the runner or a limitation of the model such as the speed was unlikely to be exactly constant for a given period of time. The road was specified as being straight and horizontal in the question so comments relating to those factors were not relevant here.
Common mistakes
a limitation of the model: changes of acceleration not instantaneous, speed or acceleration not constant, wind resistance, runner may not run 400 m
the road is given as straight and horizontal so comments about it (not straight, not horizontal, friction) score 0
June 2024 · AS Paper 2 (Mechanics) · Q1(a)3 marks
Mark scheme (whole question; this part is marked with the orange bar)
Examiner's comment
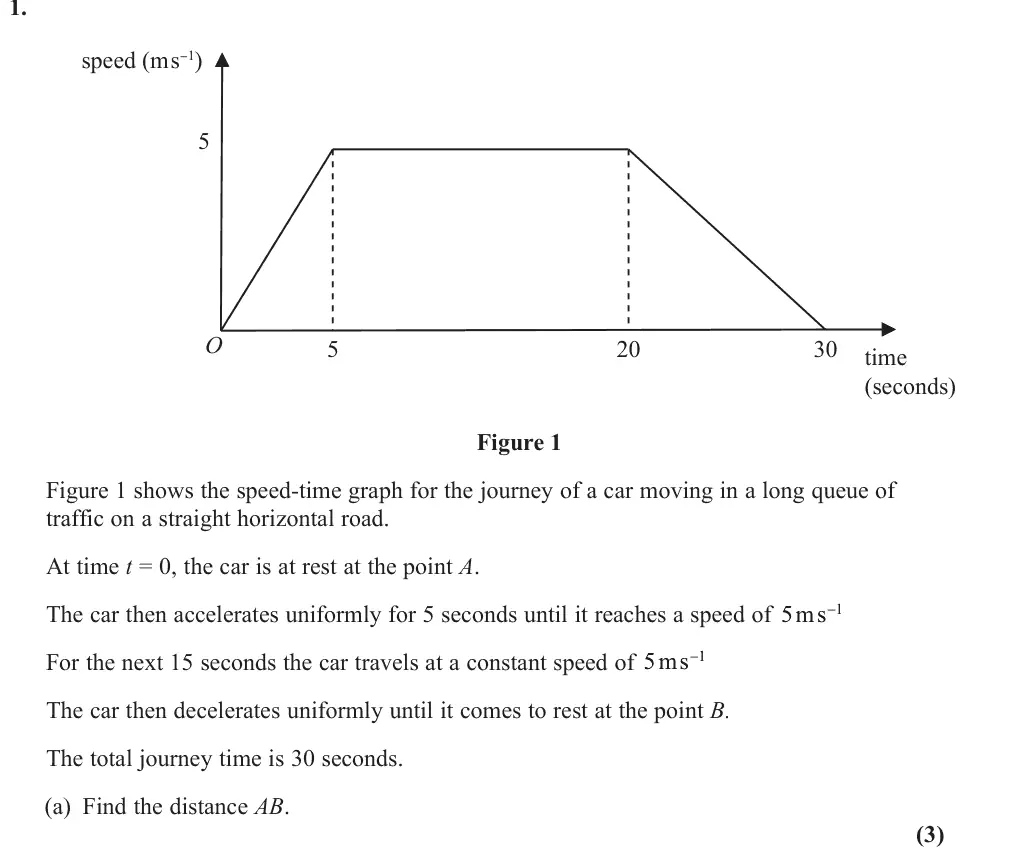
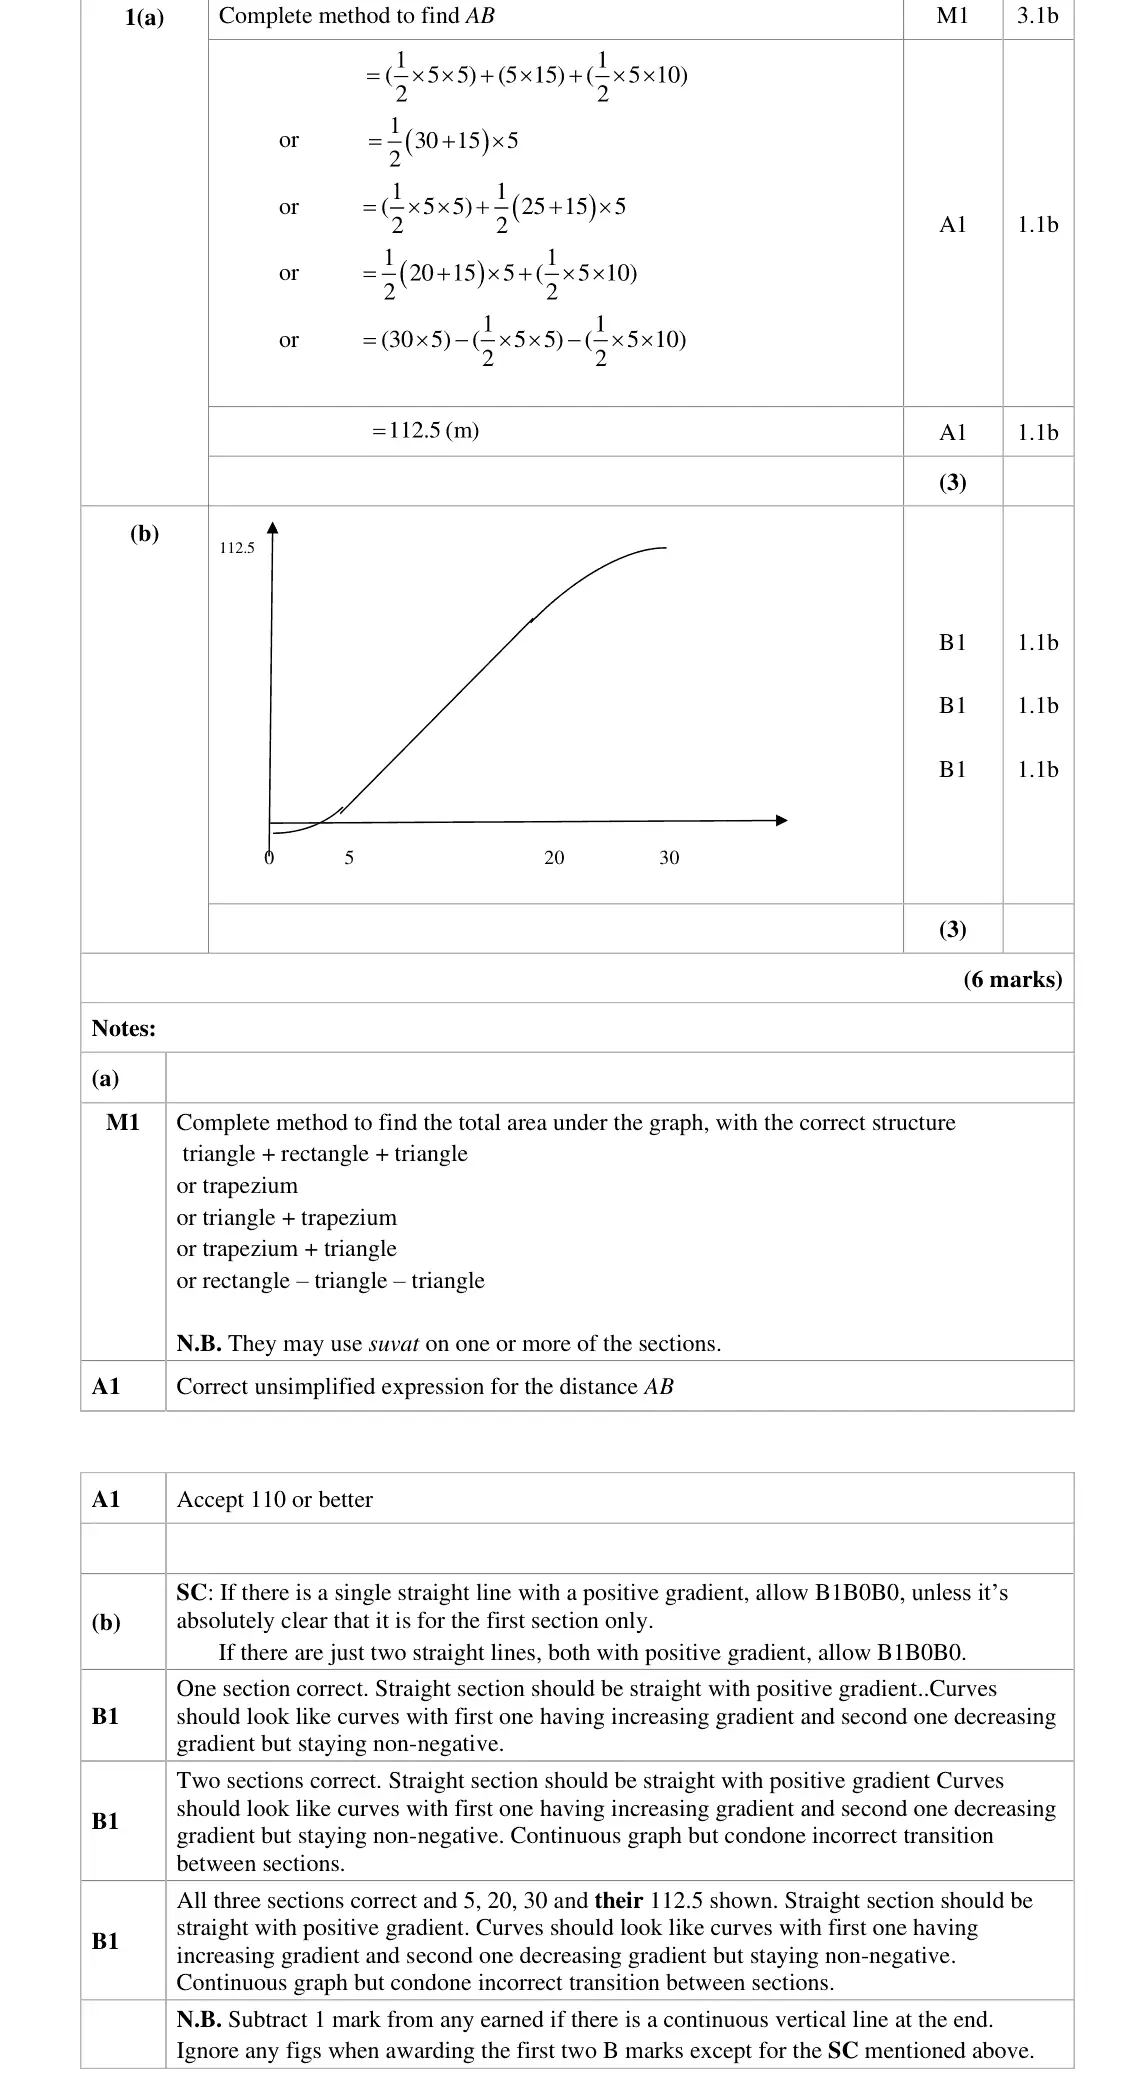
Part (a) proved to be a good starter question for almost all of the candidates. Successful candidates found the area under the graph by either separating into two triangles and a rectangle (the most popualar method) or by going directly to a trapezium. A few candidates applied suvat formulae to each part of the motion. Unsuccessful candidates used incorrect formulae or had a correct, unsimplified expression for the area but then made mistakes in the arithmetic. A few, oddly, found the length of the hypotenuse instead of the area of the triangles. The second part proved to be much more of a challenge, although the majority of candidates
Common mistakes
distance = area under the speed-time graph: triangle + rectangle + triangle or trapezium ½(30 + 15) × 5 = 112.5 m
arithmetic slips
finding the hypotenuse instead of an area
June 2024 · AS Paper 2 (Mechanics) · Q1(b)3 marks
Mark scheme (whole question; this part is marked with the orange bar)
Examiner's comment
The second part proved to be much more of a challenge, although the majority of candidates did offer a graph with three sections. Most had three straight lines with different positive gradients or one continuous straight line but quite a few attempts included lines with negative gradients or horizontal lines for the first and/or last sections. Most candidates only gained one mark out of three in this part of the question. Successful candidates realised that the first and third sections of the graph needed to be quadratic, from suvat formula, whilst the middle section was a straight line with positive gradient. In addition, the numbers 5, 20, 30 and their total distance were not always clearly shown on the axes. Some candidates had graphs that were unclearly drawn, often without straight lines. Many candidates with the three sections correct struggled with the transition between the sections and failed to produce a smooth curve, often exaggerating the curves, but they were not penalised for this. A few candidates simply recreated the speed-time graph trapezium with different axis labels.
Common mistakes
distance-time graph: curve with increasing gradient for 0–5 s, straight line with positive gradient 5–20 s, curve with decreasing gradient levelling off at 112.5 at 30 s
label 5, 20, 30 and 112.5
negative gradients, horizontal sections or redrawing the trapezium are wrong
no vertical line at the end
June 2024 · Paper 3 (Mechanics) · Q2(a)2 marks
Mark scheme (whole question; this part is marked with the orange bar)
Examiner's comment
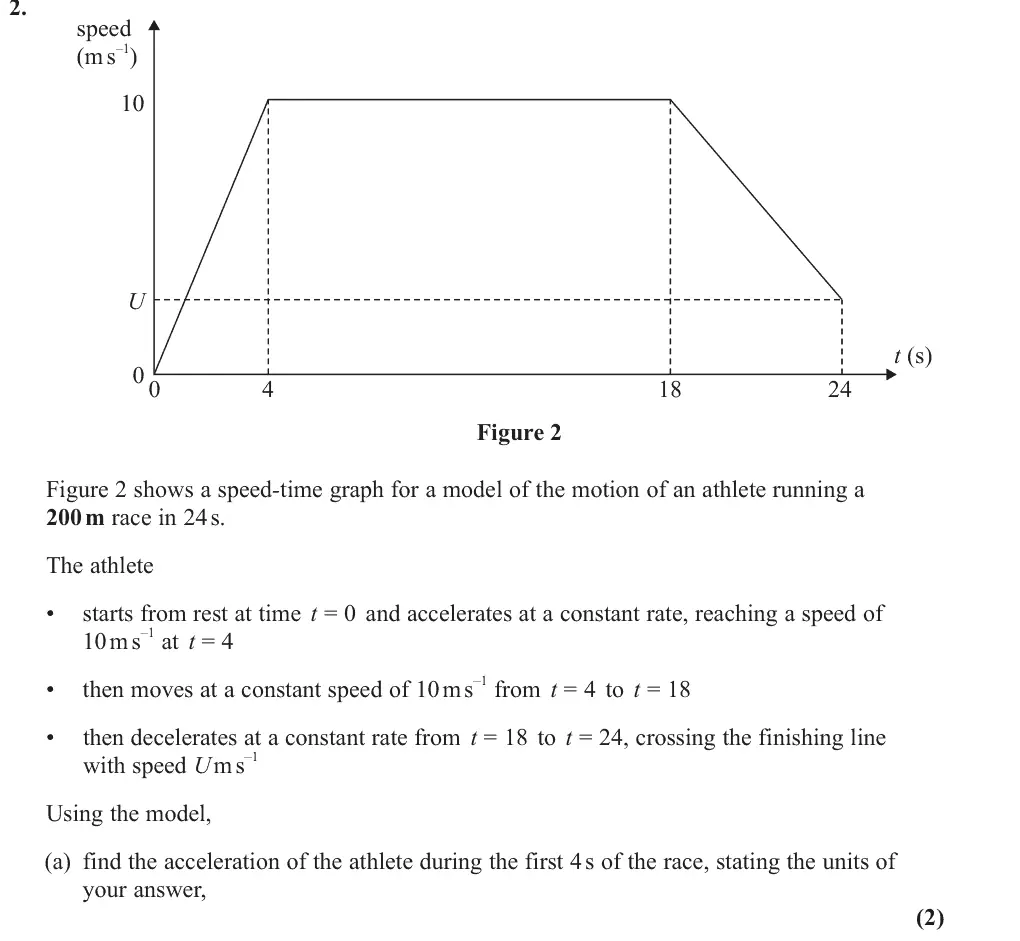
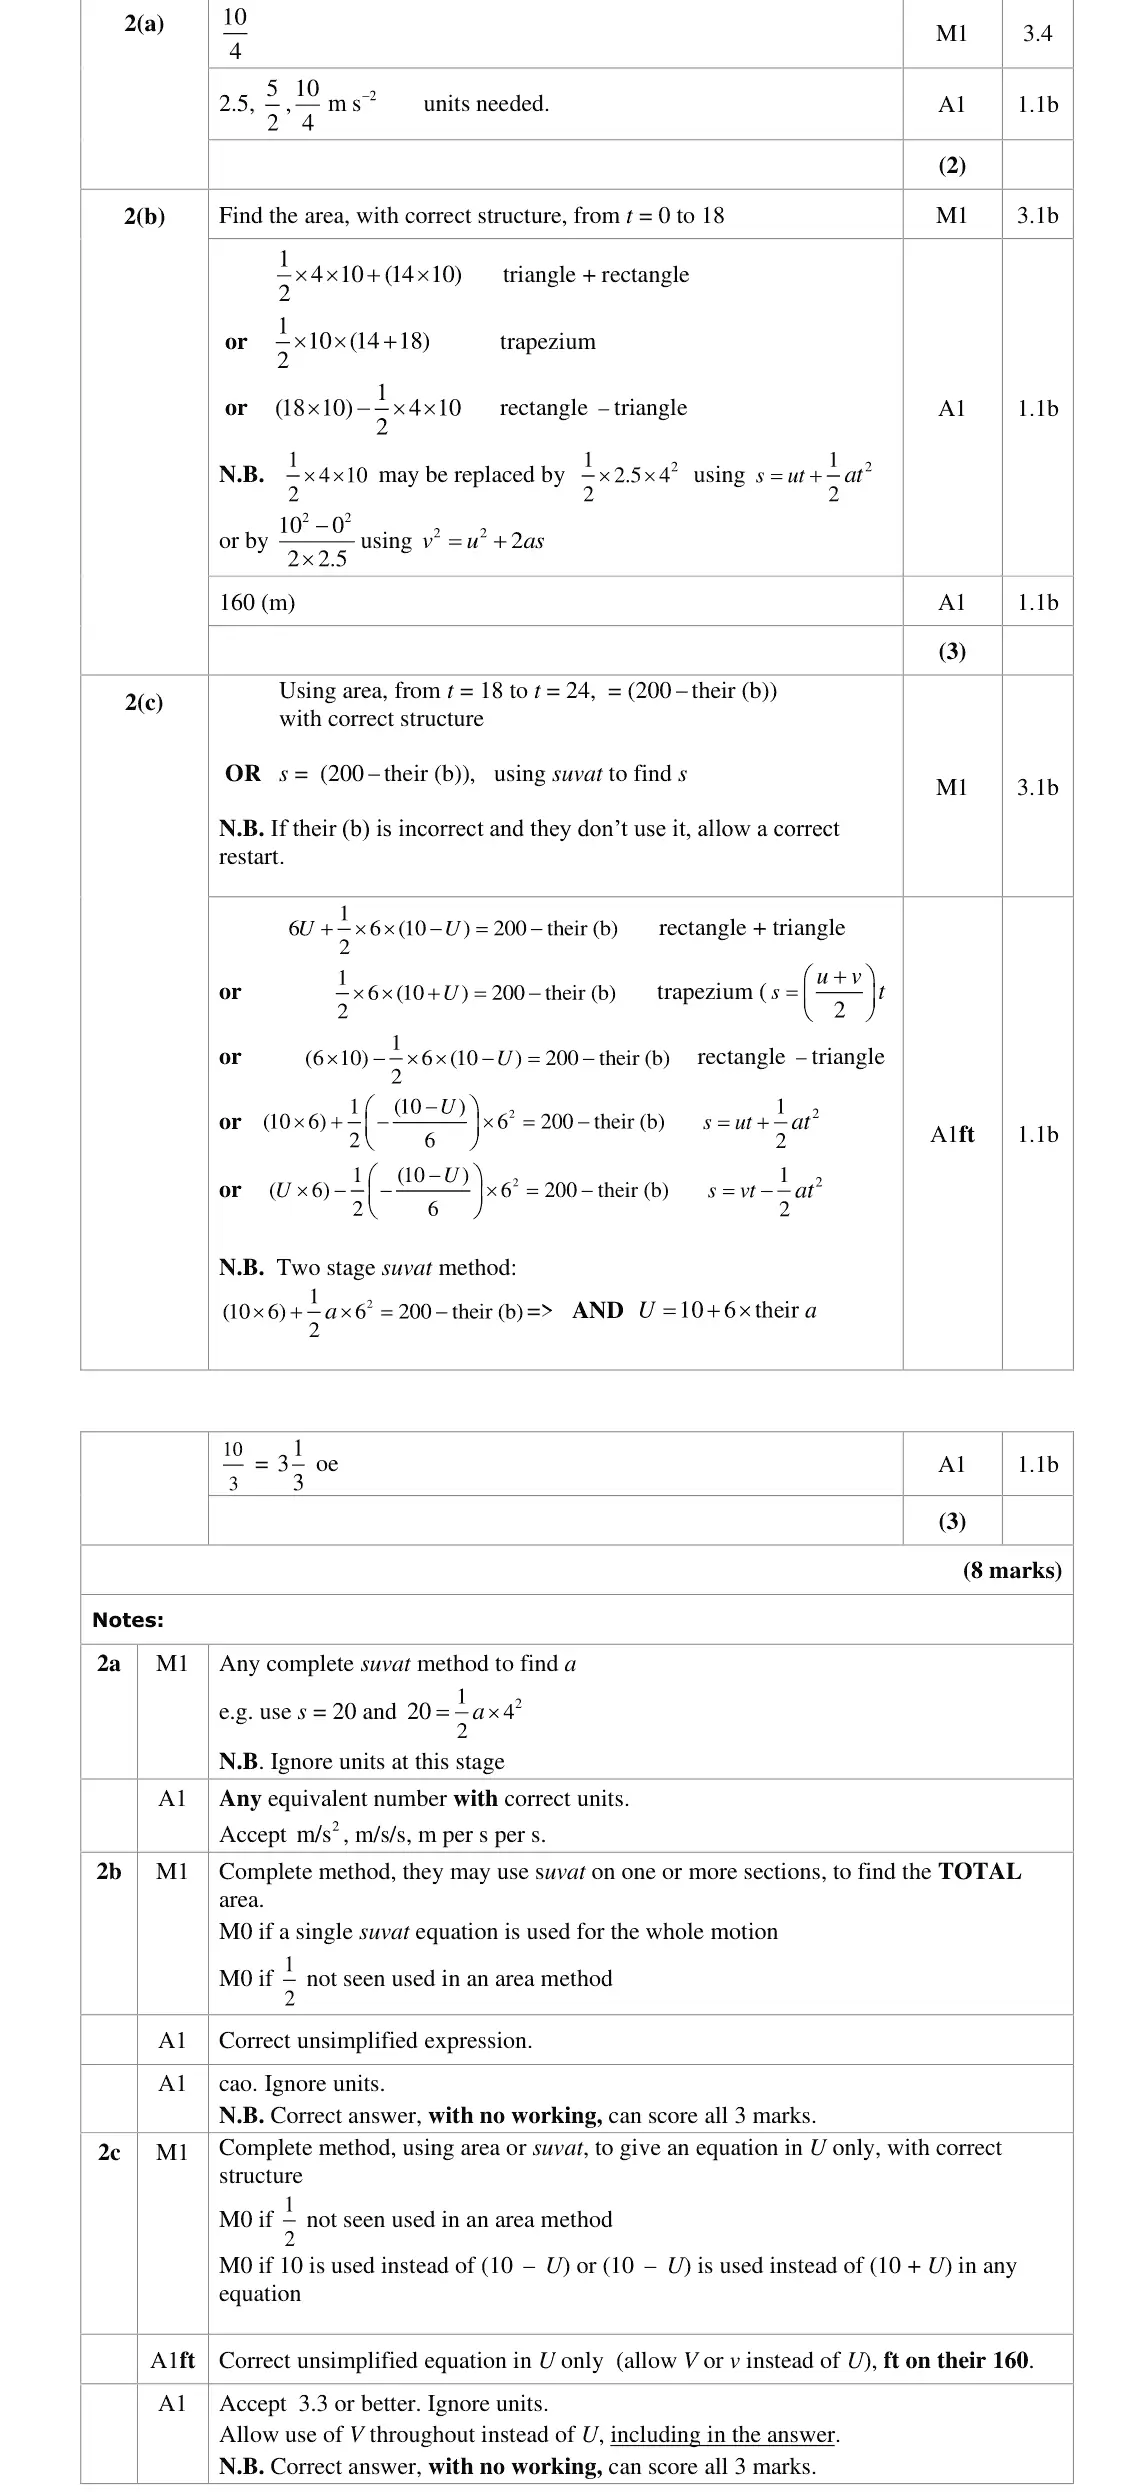
This question was accessible to all candidates, particularly parts (a) and (b). (a) This was generally answered very well either using a suvat equation or by finding the gradient of the first section of the graph. Some lost the second mark for writing incorrect m s- being the most common error 1 units or, occasionally, omitting the units altogether ( with the units). A few candidates confused acceleration with distance and found the area under the graph during the first six seconds.
Common mistakes
acceleration = gradient 10/4 = 2.5 m s⁻²
units needed (m s⁻¹ or none loses the A mark)
finding the area instead of the gradient
June 2024 · Paper 3 (Mechanics) · Q2(b)3 marks
Mark scheme (whole question; this part is marked with the orange bar)
Examiner's comment
This question was accessible to all candidates, particularly parts (a) and (b). (b) The vast majority scored all three marks here. The most popular approach was to sum the separate areas of the triangle and the rectangle or alternatively to find the area of the trapezium. Occasionally the ‘ 1 2 ’ was missing from either the area of the triangle or the trapezium. This error scored no marks for use of an incorrect formula. Those who used suvat methods tended to be less successful than those using an area approach.
Common mistakes
distance = area: triangle + rectangle or trapezium ½ × 10 × (14 + 18) = 160 m
missing the ½ scores nothing
a single suvat equation for the whole motion is M0
June 2024 · Paper 3 (Mechanics) · Q2(c)3 marks
Mark scheme (whole question; this part is marked with the orange bar)
Examiner's comment
(c) This part was more challenging. Most candidates recognised that they needed to subtract their answer to (b) from 200 to get the distance travelled from t = 18 to t = 24. 1 = + 2 ( ) s u v t Whilst some used , the most common successful approaches were to find an expression for the sum of the area of the triangle and rectangle or the area of the trapezium and equate that to 40. However, a significant number of candidates used the = ) 6 40 area of a triangle rather than a trapezium and wrote 1 - 2 (10 U leading to U = - 10 then ignored the sign and wrote it as a positive answer which coincidentally 3 was the correct answer but they scored no marks for an incorrect method. A small number of students attempted to find U by using suvat methods for the whole race, usually without success.
Common mistakes
distance from t = 18 to 24 is 200 − 160 = 40 m = trapezium ½ × 6 × (10 + U)
using a triangle ½ × 6 × (10 − U) gives −10/3 (no marks even if the sign is dropped)
U = 10/3
June 2023 · AS Paper 2 (Mechanics) · Q1(a)1 mark
Mark scheme (whole question; this part is marked with the orange bar)
Examiner's comment
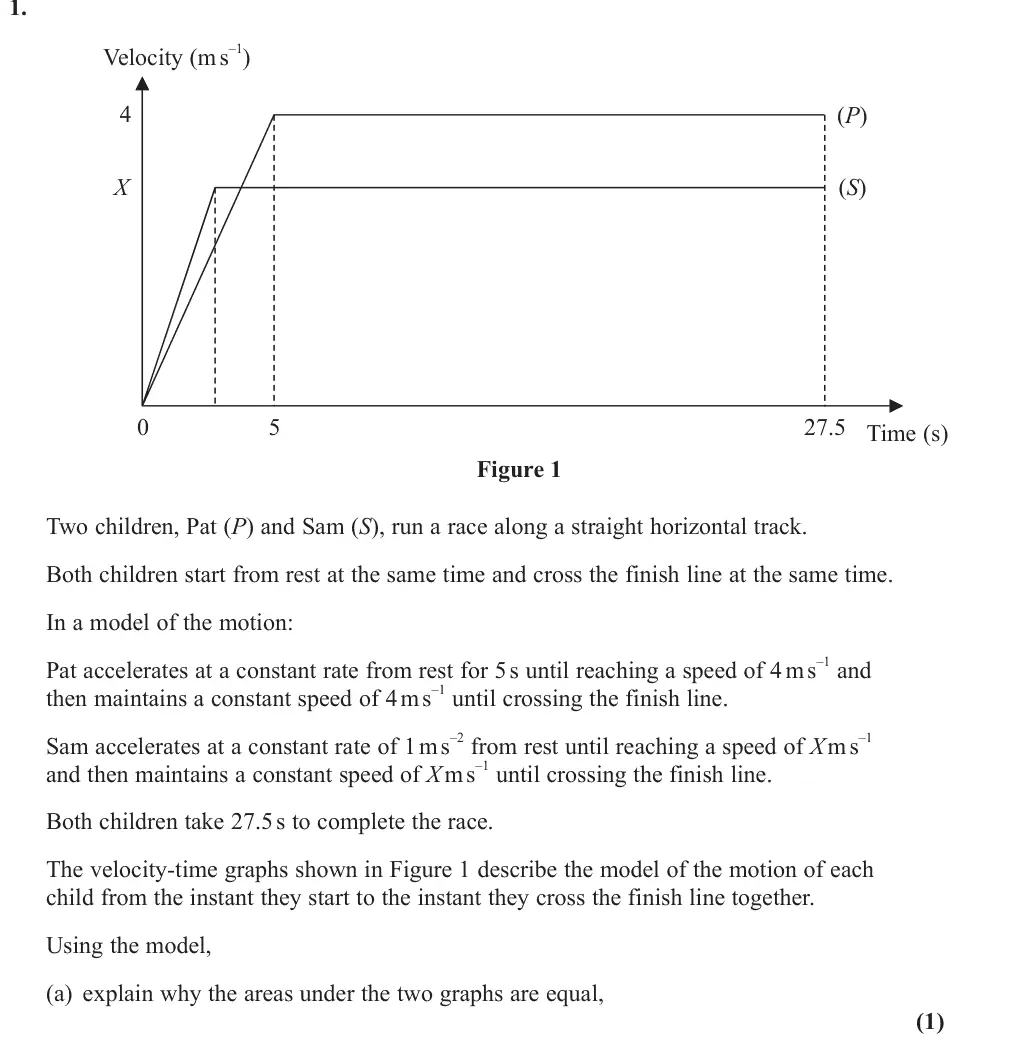
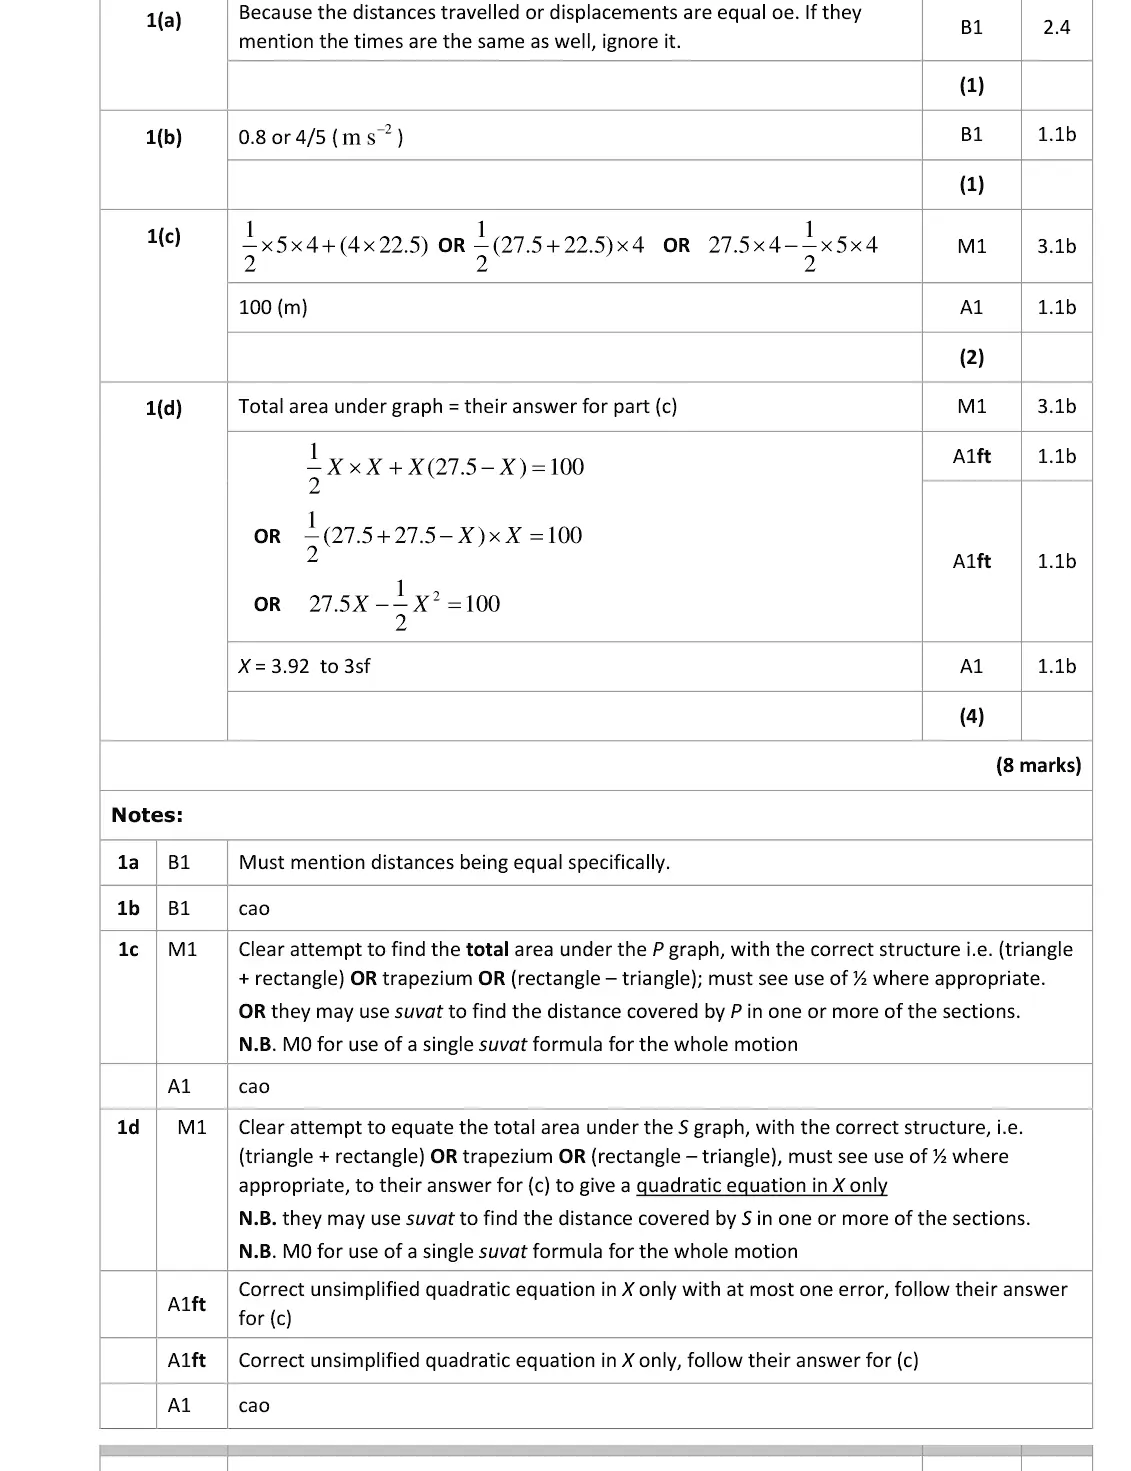
In part (a), common incorrect answers were “took the same time” or explanations about one accelerating faster but running at a slower speed with no reference to distance. However, most seemed to know that the area represented distance and realised that since it was a race, the children had covered the same distance. In the second part, a few used Pythagoras or found the
Common mistakes
area under a v-t graph is distance: both children cover the same distance (the length of the race)
"they took the same time" alone scores 0
June 2023 · AS Paper 2 (Mechanics) · Q1(b)1 mark
Mark scheme (whole question; this part is marked with the orange bar)
Examiner's comment
children had covered the same distance. In the second part, a few used Pythagoras or found the area but most either used the gradient or a suvat approach. A number went from 5a = 4 to 5 a = 4. Most candidates, in part (c), found the area correctly using Pat’s graph. Some made
Common mistakes
gradient of the first section = 4/5 = 0.8 m s⁻²
slips such as 5a = 4 giving a = 5/4
June 2023 · AS Paper 2 (Mechanics) · Q1(c)2 marks
Mark scheme (whole question; this part is marked with the orange bar)
Examiner's comment
5 a = 4. Most candidates, in part (c), found the area correctly using Pat’s graph. Some made 1 errors with lengths of sides or omitted the 2. Very few used suvat for the whole motion and a few left out the triangle thus getting either 90 or 110. There were many poor responses for the final part. Since the shape of the graph used in part (d) was the same shape as the graph used in part (c), it was surprising to see so many candidates using a different approach for finding this area even though they realised that the areas were the same. Many candidates either didn’t even attempt it or gave up after writing one equation in two variables. Of those who realised that the acceleration meant that X = t, or whatever variable they had used, a number were not able to use that to obtain an equation in X only and so scored no marks. There were a few suvat attempts and a common error was to use 22.5 instead of 27.5. Those who were able to get to a correct quadratic equation almost always selected the correct root as their final answer and usually gave it to 3sf although there were a few 3.91’s seen.
Common mistakes
total area under P's graph = ½ × 5 × 4 + 4 × 22.5 = 100 m (triangle + rectangle or trapezium)
omitting the ½ or the triangle (90 or 110)
one suvat formula for the whole motion scores 0
June 2023 · AS Paper 2 (Mechanics) · Q1(d)4 marks
Mark scheme (whole question; this part is marked with the orange bar)
Examiner's comment
final part. Since the shape of the graph used in part (d) was the same shape as the graph used
Common mistakes
acceleration 1 m s⁻² means Sam reaches X after X seconds
area ½X² + X(27.5 − X) = 100 gives a quadratic in X only
X = 3.92 (3 s.f., choose the root less than 27.5)
common errors 22.5 instead of 27.5, one equation in two unknowns
June 2022 · AS Paper 2 (Mechanics) · Q2(a)1 mark
Mark scheme (whole question; this part is marked with the orange bar)
Examiner's comment
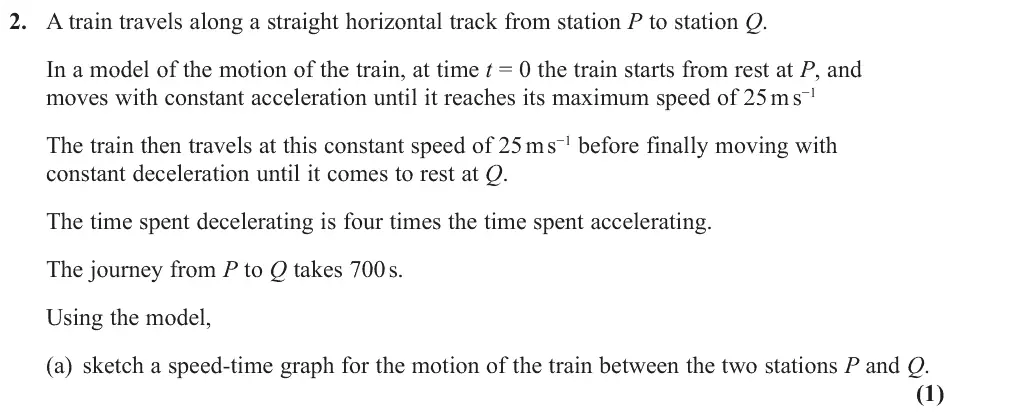
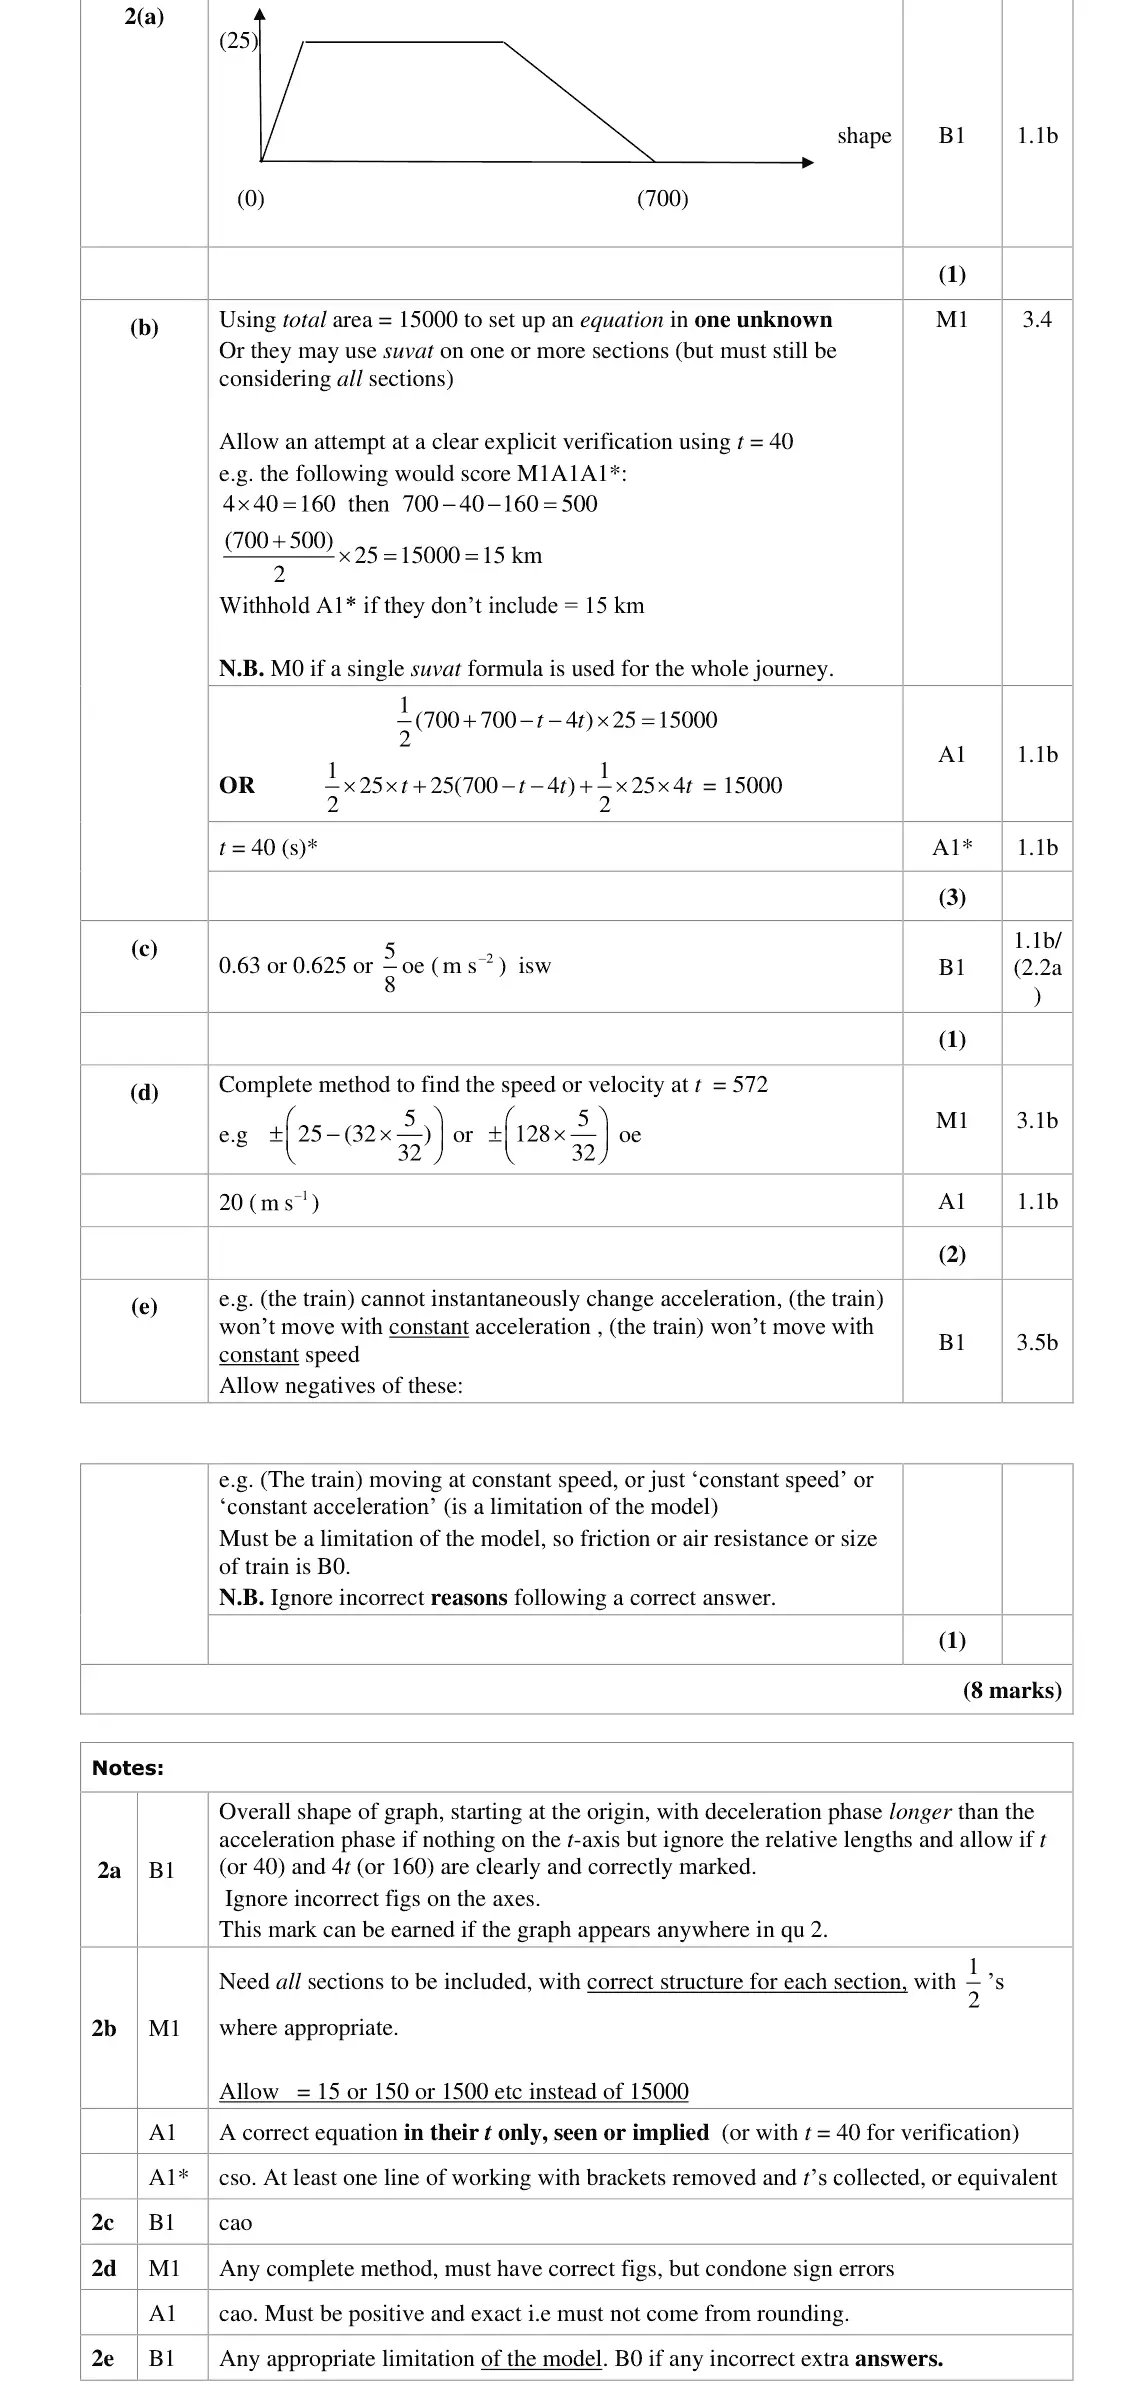
In part (a), most diagrams were drawn with the correct shape. The most common error was to not have the deceleration phase clearly longer than the acceleration phase. Also a few candidates didn't account for the time travelling at constant speed and drew a triangle which generally meant that they were unable to score many marks in the remainder of the question. In the second part, most candidates connected the area under the graph to the distance of 15
Common mistakes
trapezium from the origin to (700, 0) with maximum 25
deceleration phase must be longer than acceleration phase (4 times)
a triangle (no constant-speed phase) loses most later marks
June 2022 · AS Paper 2 (Mechanics) · Q2(b)3 marks
Mark scheme (whole question; this part is marked with the orange bar)
Examiner's comment
In the second part, most candidates connected the area under the graph to the distance of 15 km travelled, although some forgot to change km into m or converted it wrongly. Some chose to use the formula for the area of a trapezium directly, others divided the area into two triangles and a rectangle and a small number used a rectangle with two triangles subtracted. A significant number of candidates chose to solve the problem by using an explicit verification method, using t = 40 and the information given about the acceleration and deceleration times and the total time to show that the distance travelled was 15000 m but lost the final mark if they did not say that this was equal to 15 km. The vast majority of candidates scored the mark in part
Common mistakes
total area under the graph = 15000 m (convert km to m)
½(700 + 700 − 5t) × 25 = 15000 gives t = 40
a single suvat for the whole journey scores 0
verification must conclude = 15 km
June 2022 · AS Paper 2 (Mechanics) · Q2(c)1 mark
Mark scheme (whole question; this part is marked with the orange bar)
Examiner's comment
(c) for the acceleration. Part (d) was the most challenging part, with only better candidates able to come up with a method and of those, having worked out that the change in velocity was 5 ms-1, forgot that it was decelerating at this stage and added it on to 25 ms-1 instead of subtracting it.
Common mistakes
a = 25/40 = 0.625 m/s² (gradient of the first section)
June 2022 · AS Paper 2 (Mechanics) · Q2(d)2 marks
Mark scheme (whole question; this part is marked with the orange bar)
Examiner's comment
(c) for the acceleration. Part (d) was the most challenging part, with only better candidates able to come up with a method and of those, having worked out that the change in velocity was 5 ms-1, forgot that it was decelerating at this stage and added it on to 25 ms-1 instead of subtracting it.
Common mistakes
deceleration 25/160 = 5/32
t = 572 is 128 s before the end (or 32 s into deceleration): v = 25 − 32 × 5/32 = 20
common error adding the 5 m/s change to 25
June 2022 · AS Paper 2 (Mechanics) · Q2(e)1 mark
Mark scheme (whole question; this part is marked with the orange bar)
Examiner's comment
In part (a), most diagrams were drawn with the correct shape. The most common error was to not have the deceleration phase clearly longer than the acceleration phase. Also a few candidates didn't account for the time travelling at constant speed and drew a triangle which generally meant that they were unable to score many marks in the remainder of the question. In the second part, most candidates connected the area under the graph to the distance of 15 km travelled, although some forgot to change km into m or converted it wrongly. Some chose to use the formula for the area of a trapezium directly, others divided the area into two triangles and a rectangle and a small number used a rectangle with two triangles subtracted. A significant number of candidates chose to solve the problem by using an explicit verification method, using t = 40 and the information given about the acceleration and deceleration times and the total time to show that the distance travelled was 15000 m but lost the final mark if they did not say that this was equal to 15 km. The vast majority of candidates scored the mark in part (c) for the acceleration. Part (d) was the most challenging part, with only better candidates able to come up with a method and of those, having worked out that the change in velocity was 5 ms-1, forgot that it was decelerating at this stage and added it on to 25 ms-1 instead of subtracting it.
Common mistakes
the train cannot change acceleration instantaneously or will not have constant acceleration/speed
friction, air resistance or size of train are not limitations of this model
Oct 2021 · Paper 3 (Mechanics) · Q2(c)2 marks
Mark scheme (whole question; this part is marked with the orange bar)
Examiner's comment
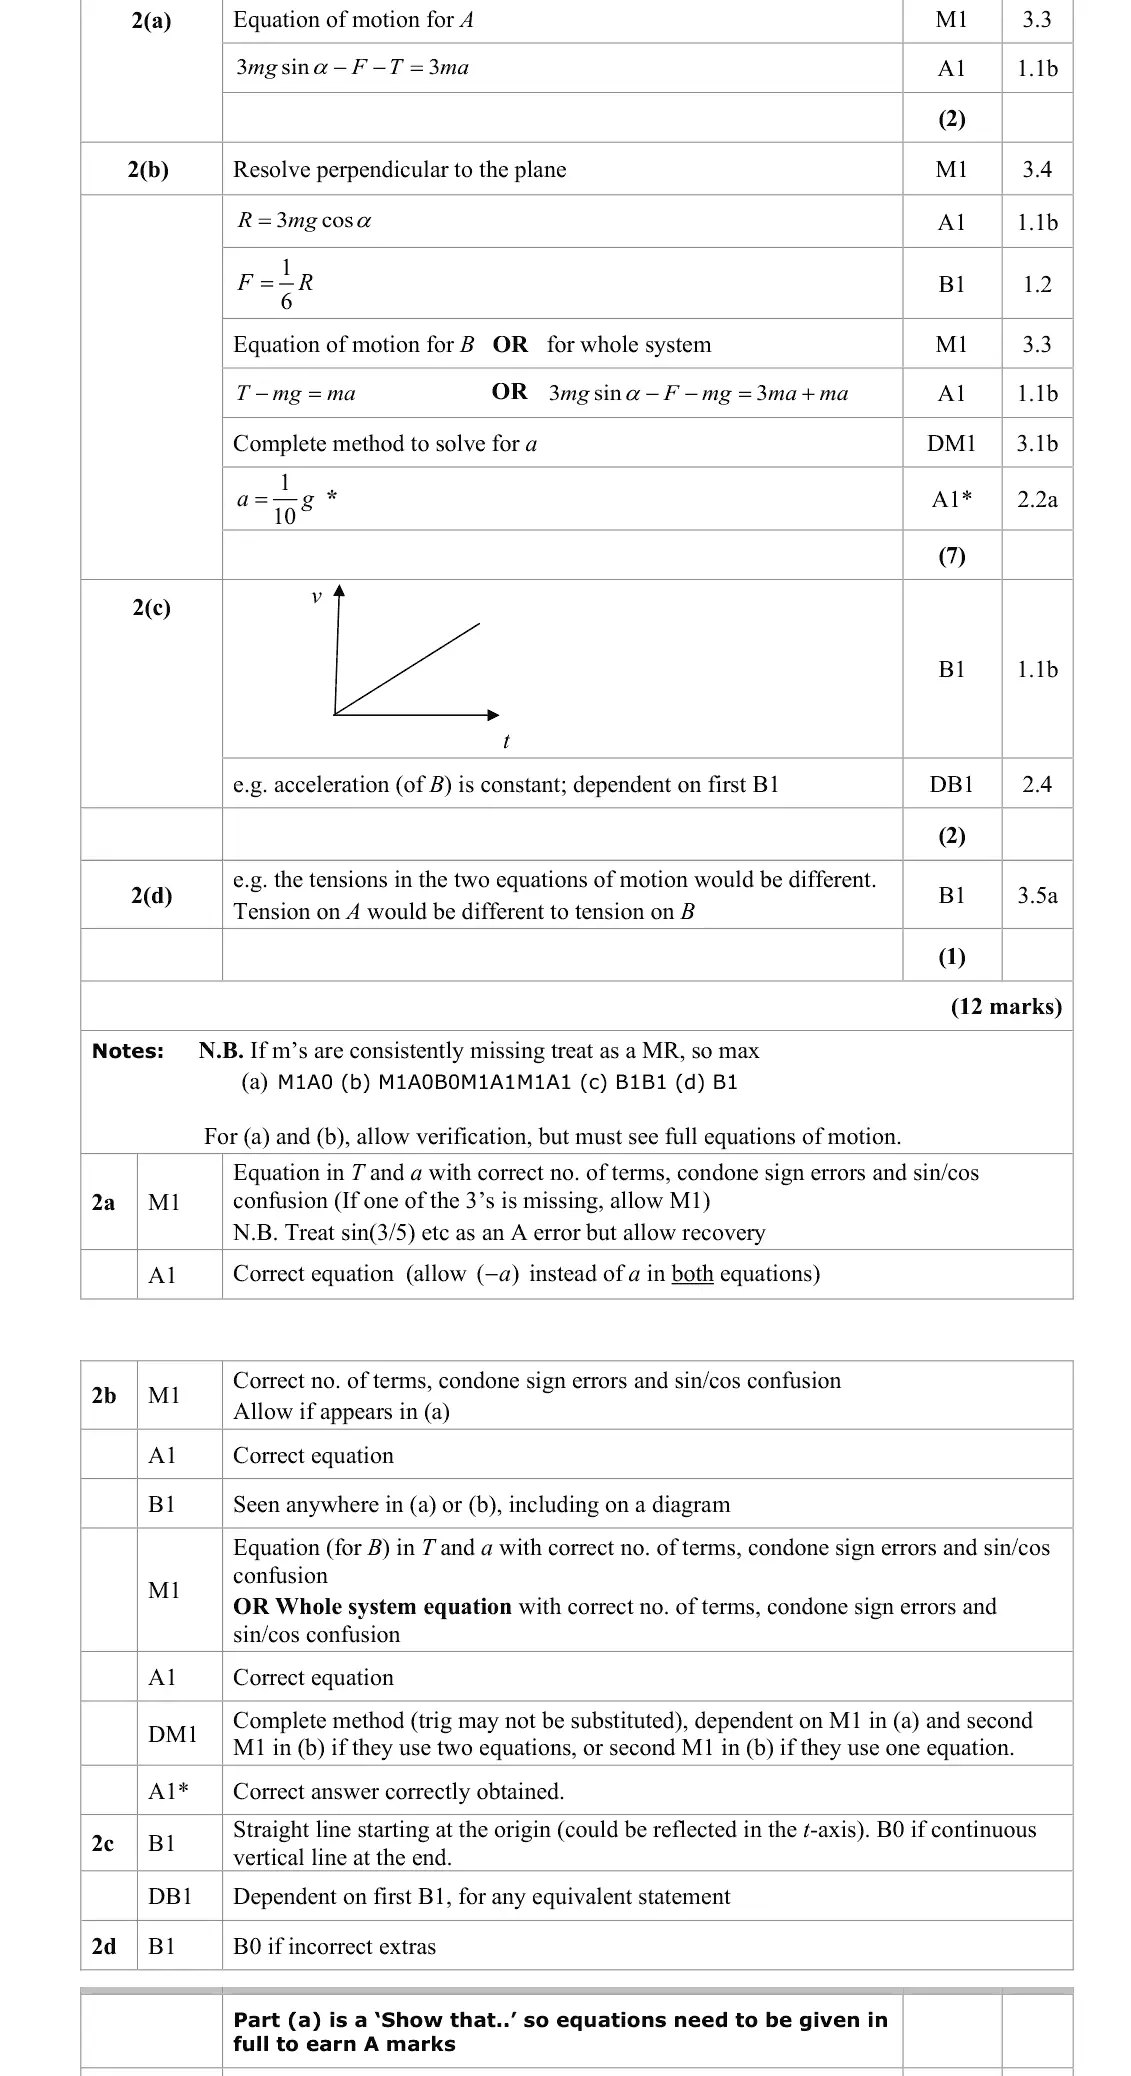
Candidates need to make sure that they read and then answer questions carefully. In part successful. In part (c), most of the graphs given were correct but there are still candidates who add a solid vertical line at the end of the graph and this lost the mark. However, the second mark here was frequently lost. All that was required was a comment that the acceleration was constant. For the final part, candidates needed to answer the question
Common mistakes
straight line from the origin
no vertical line at the end (loses the mark)
the explanation (acceleration is constant) was often omitted
Oct 2020 · AS Paper 2 (Mechanics) · Q1(d)2 marks
Mark scheme (whole question; this part is marked with the orange bar)
Examiner's comment
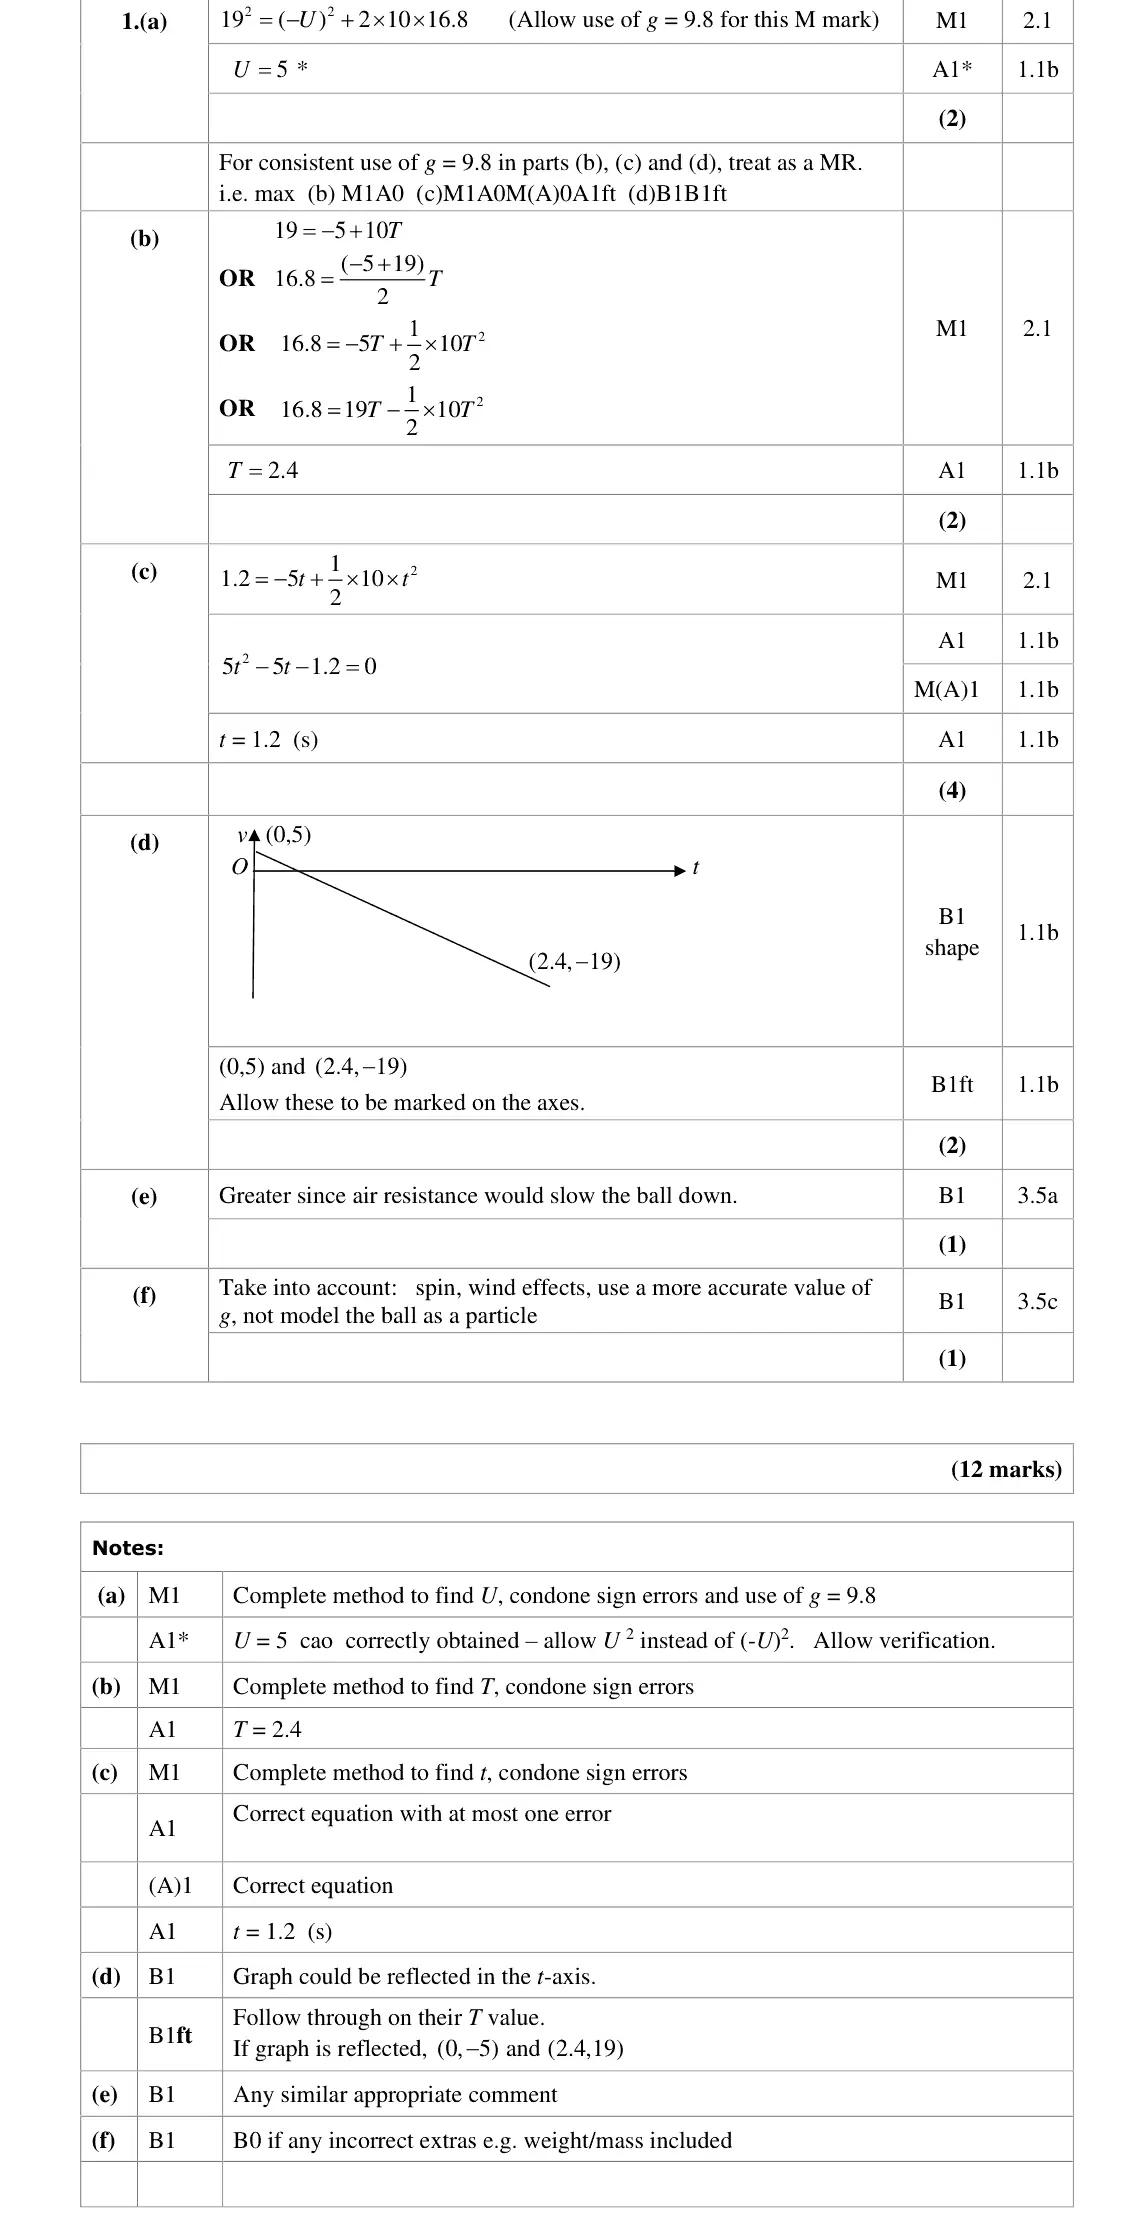
the time down and then add. In part (d), very few correct graphs seen. Many started from the origin to produce an upside down V-shape or a trapezium. In
Common mistakes
straight line from (0, 5) to (2.4, −19) crossing the t-axis (or its reflection)
common errors starting at the origin, inverted V or trapezium
June 2019 · AS Paper 2 (Mechanics) · Q1(b)2 marks
Mark scheme (whole question; this part is marked with the orange bar)
Examiner's comment
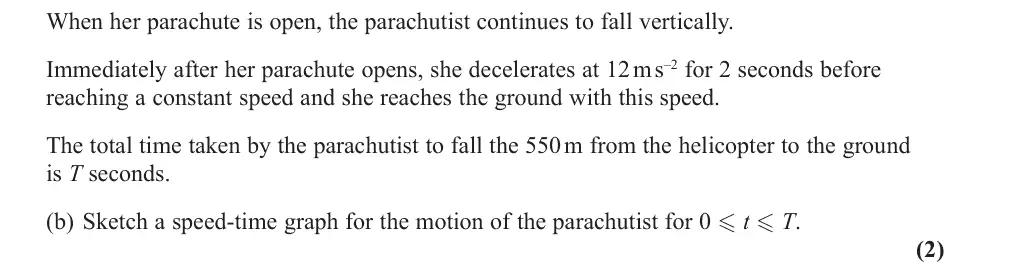
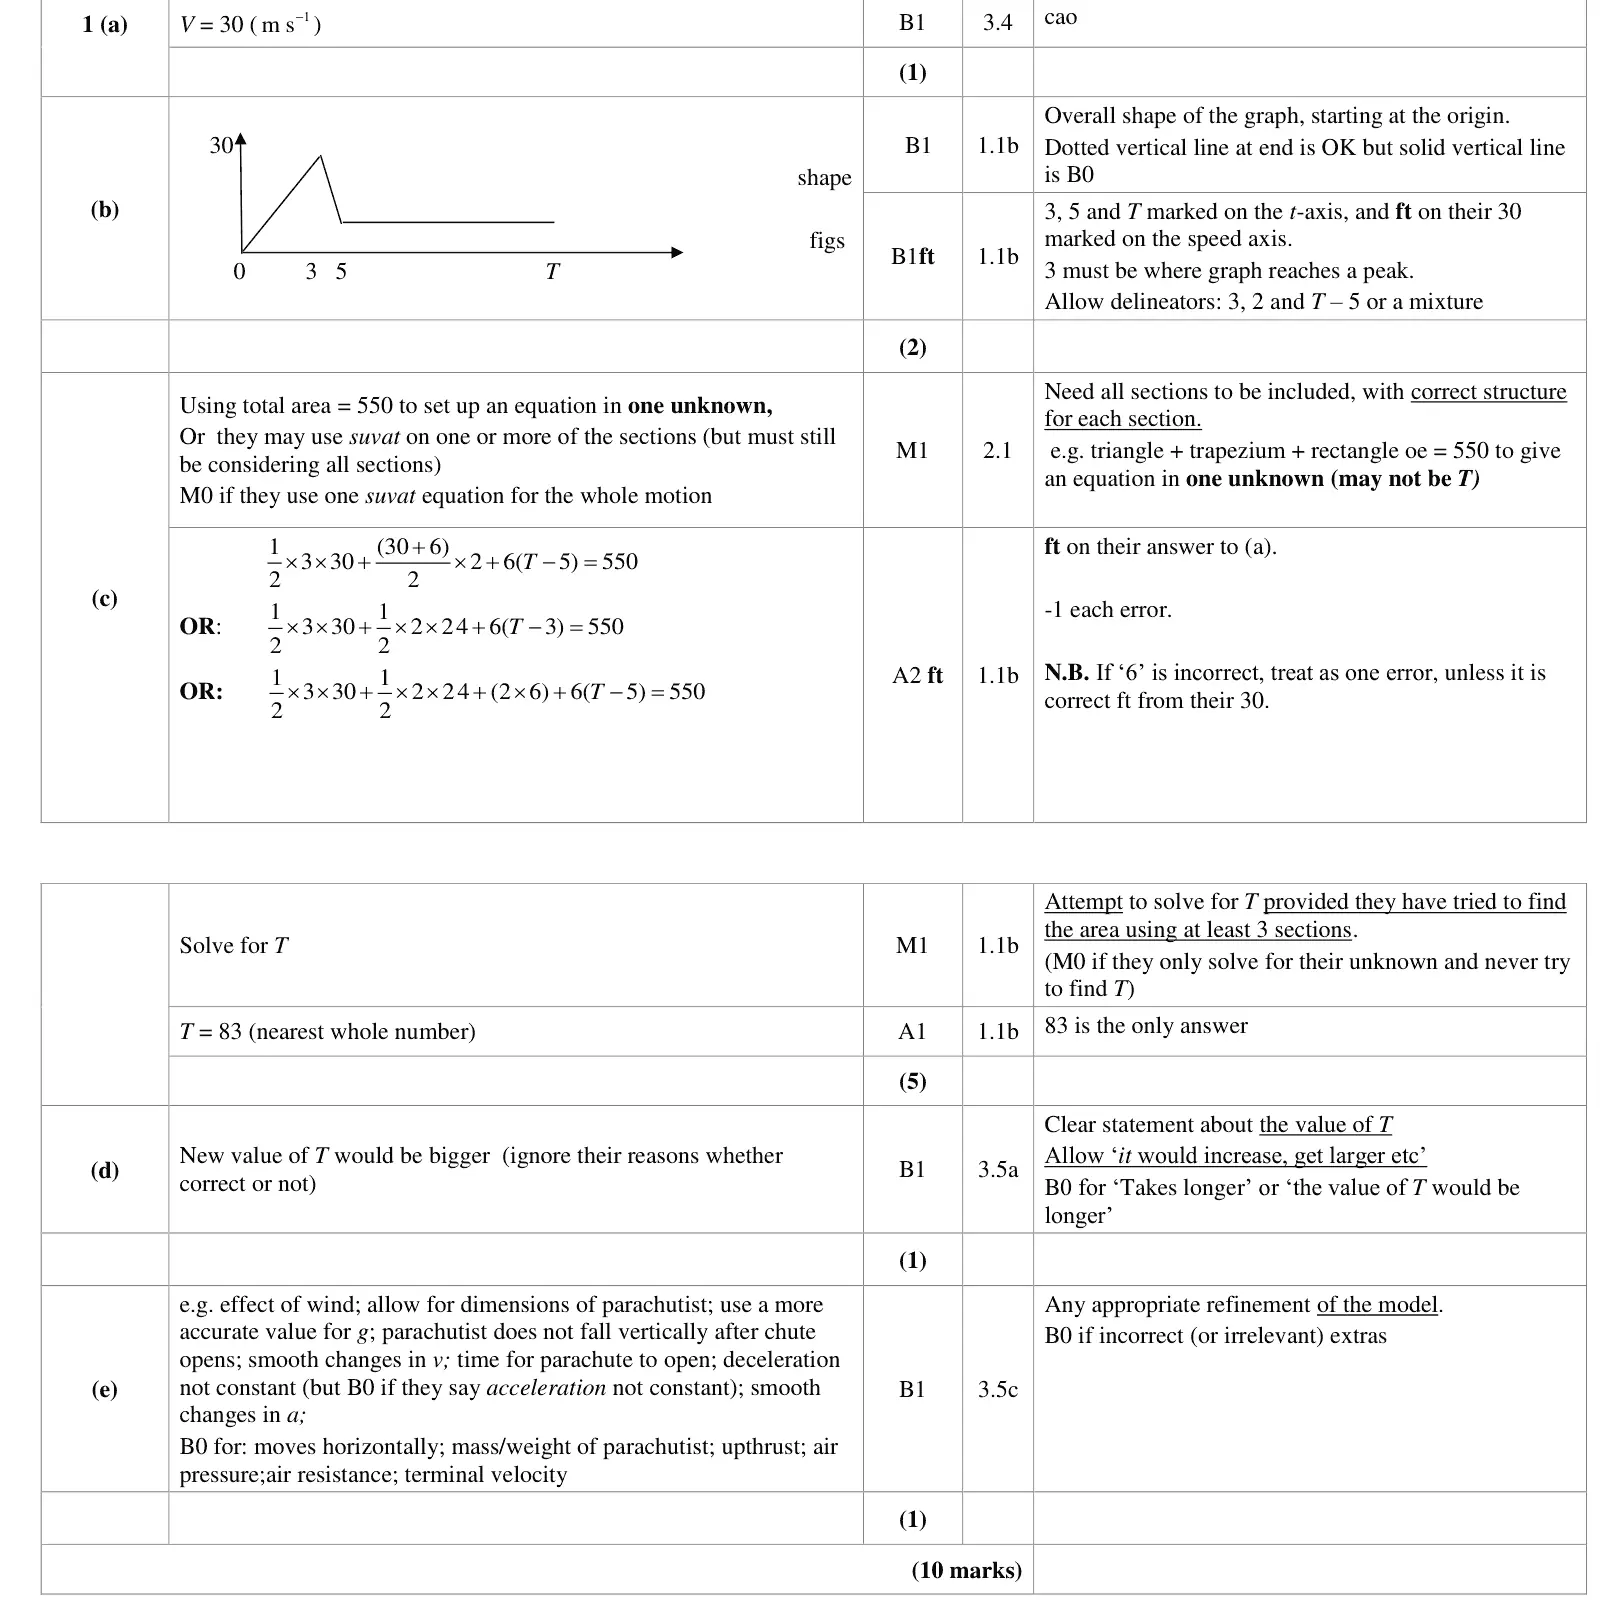
Part (b) involved drawing a speed-time graph for the motion of the parachutist. Many correct shapes were seen for the first mark but those who included a solid vertical line at t = T were penalised. Other less common errors included not starting the graph at the origin, not using a straight line for each section and having a sloping line for the final section (when the parachutist is moving with constant speed). The given figures (‘30’, 3, 5, T) were required to be correctly placed for the second mark; occasionally one or two were omitted but many did achieve this mark. In the third part the majority of the candidates
Common mistakes
start at the origin
straight line up to 30 at t = 3, straight line down to 6 at t = 5, then horizontal to T
mark 3, 5, T and 30
no solid vertical line at t = T
final section not sloping
June 2019 · AS Paper 2 (Mechanics) · Q1(c)5 marks
Mark scheme (whole question; this part is marked with the orange bar)
Examiner's comment
one or two were omitted but many did achieve this mark. In the third part the majority of the candidates realised that the area under the graph represented the distance travelled. However, not all used the correct structure, namely a triangle, rhombus and rectangle (or equivalent) and the relevant correct formulae for their areas. There was often confusion in the use of T (which was defined in the question) so that effectively the final stated answer was 5 less than the actual value. Some used suvat equations for each stage of the motion, often more or less successfully, although a fairly common error was to use a final velocity of zero in the third section. Attempts to use a single suvat equation to cover the entire distance were seen on occasion; these showed a lack of understanding of the situation and achieved no credit. Those with correct working did not always round the final answer to the nearest whole number as required.
Common mistakes
total area under the speed-time graph = 550: ½ × 3 × 30 + ½(30 + 6) × 2 + 6(T − 5) = 550
constant speed after t = 5 is 6 m s⁻¹
use T − 5 (not T) for the last section
one suvat equation for the whole motion scores nothing
T = 83 to the nearest whole number
June 2019 · AS Paper 2 (Mechanics) · Q1(d)1 mark
Mark scheme (whole question; this part is marked with the orange bar)
Examiner's comment
Part (d) required recognition of the fact that including the effect of air resistance would lead to an increased value of T. Although this was widely understood, some candidates commented that ‘it would take longer’ which did not answer the question as stated.
Common mistakes
air resistance reduces the speed before the parachute opens, so the new value of T is bigger
must refer to T ("takes longer" alone is B0)
June 2018 · AS Paper 2 · Q7(a)3 marks
Mark scheme (whole question; this part is marked with the orange bar)
Examiner's comment
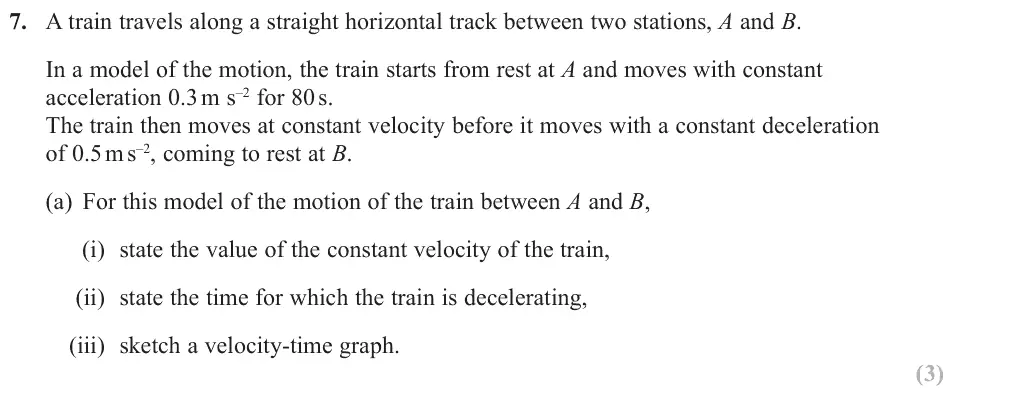
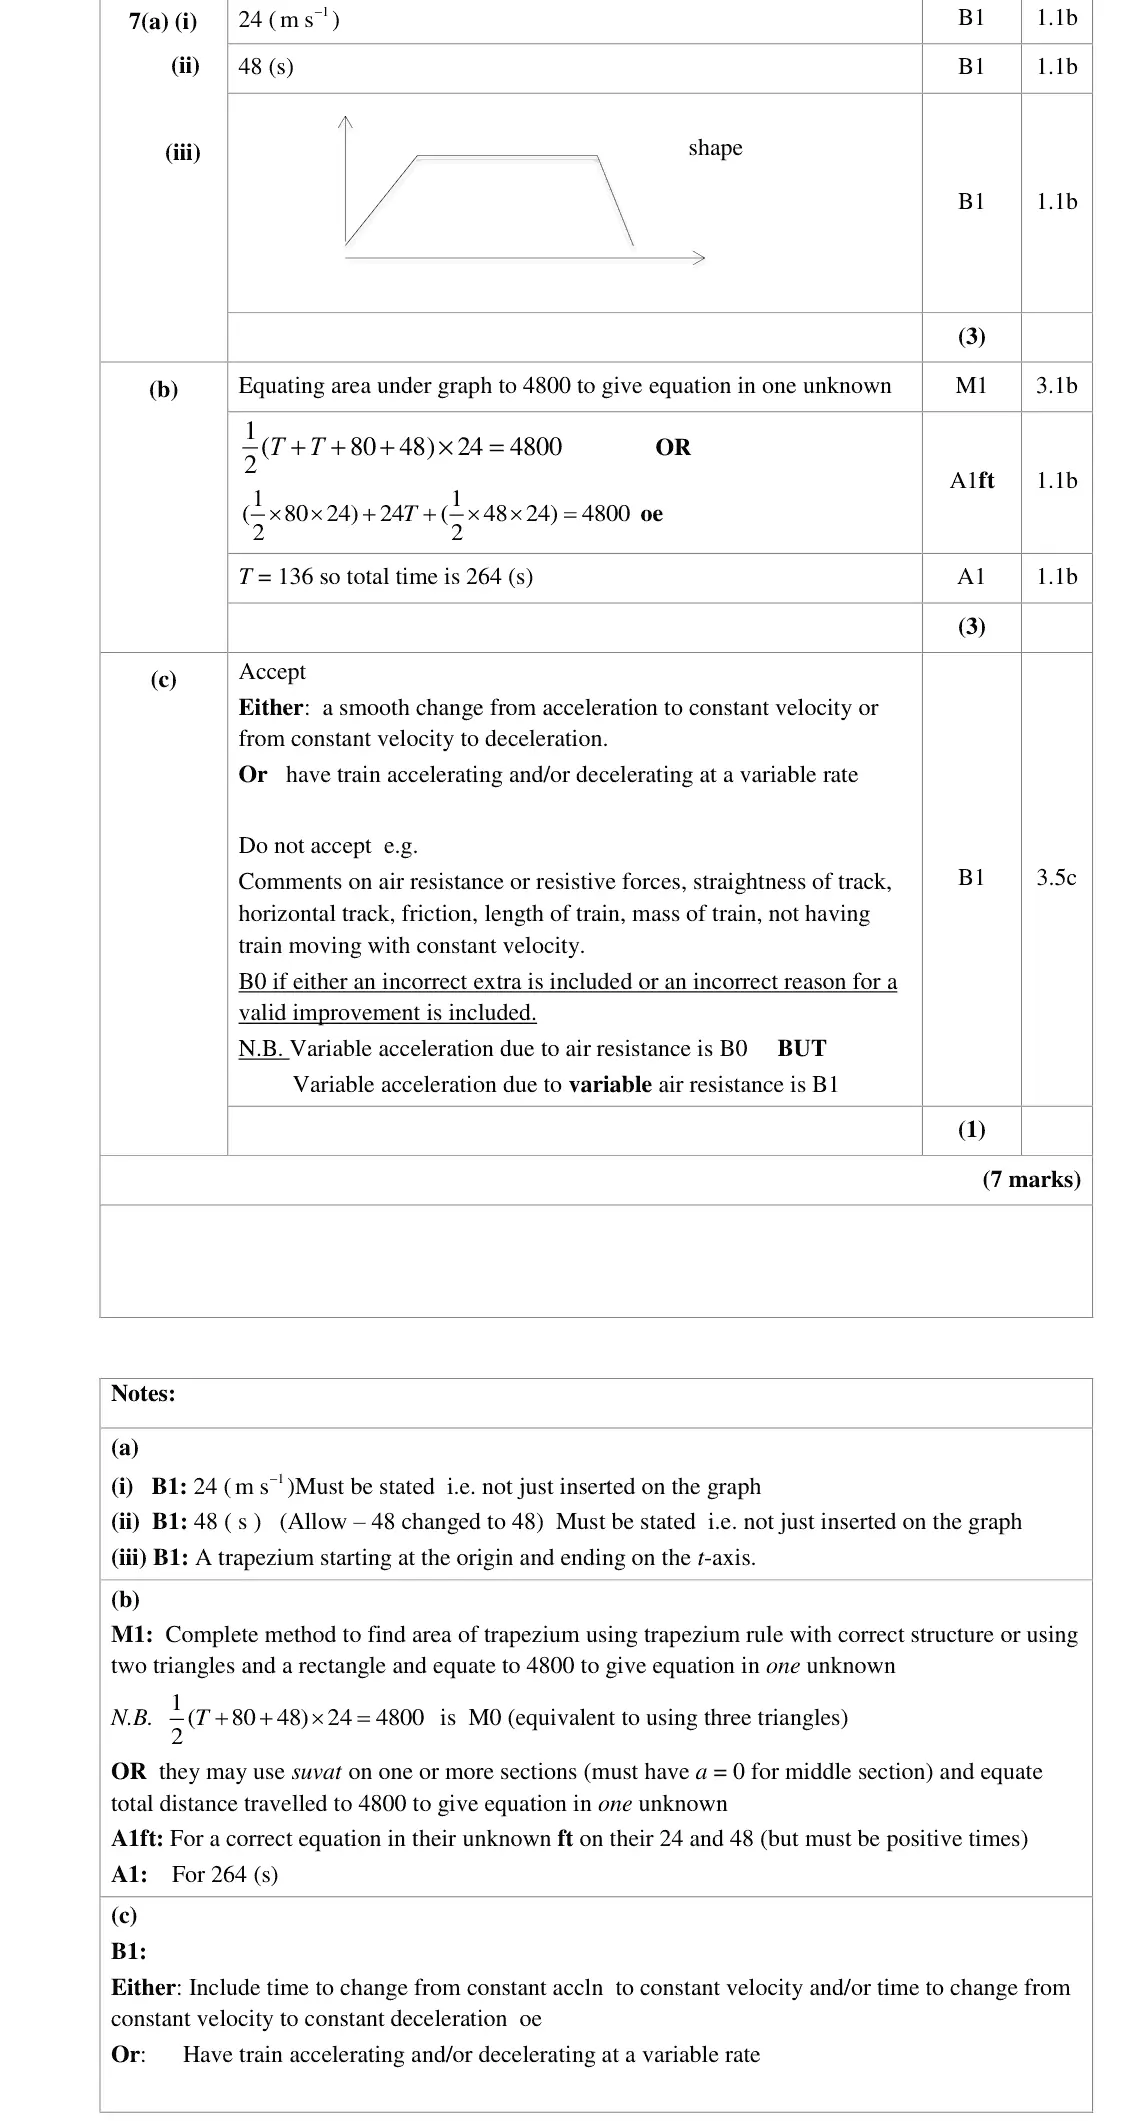
The majority of students identified a correct value for the required constant speed (24 m s-1) and then for the time of deceleration (48 s) although ‘24÷0.5=12’ was a surprisingly common error. Most, but not all, produced a velocity-time graph in the shape of a trapezium starting at the origin and finishing on the t axis.
Common mistakes
constant velocity 0.3 × 80 = 24 m/s
deceleration time 24 ÷ 0.5 = 48 s (24 × 0.5 = 12 is a common error)
values must be stated, not only marked on the graph
v–t graph a trapezium from the origin ending on the t-axis
June 2018 · AS Paper 2 · Q7(b)3 marks
Mark scheme (whole question; this part is marked with the orange bar)
Examiner's comment
In part (b), those who tried to equate the area under the graph to the distance travelled sometimes did so successfully, although an unknown ‘T’ value was often used inconsistently in the 3 sections of the motion. Some failed to use the correct structure (a trapezium or two triangles and a rectangle) or attempted a single suvat equation for the whole journey; such attempts gained no credit. Having found a correct relevant ‘T’ value, a number of students forgot that the question required the time for the complete journey.
Common mistakes
area under the v–t graph = 4800: ½(T + T + 128) × 24 = 4800 gives T = 136, so total time 264 s (not 136)
½(T + 128) × 24 is wrong
a single suvat for the whole journey scores 0
June 2018 · AS Paper 2 · Q7(c)1 mark
Mark scheme (whole question; this part is marked with the orange bar)
Examiner's comment
Part (c) required the identification of a possible improvement to the model. The model assumed periods of constant acceleration and instantaneous changes between constant acceleration and constant velocity. Therefore possible improvements to the model would be to allow variable acceleration and smooth changes between acceleration and constant velocity. However, valid responses were relatively rare; examples of the various comments seen included reference to the mass or length of the train, traffic lights, number of passengers and even the weather.
Common mistakes
allow a smooth change between acceleration and constant velocity, or variable acceleration/deceleration
air resistance, mass or length of the train, traffic lights or weather score 0
Find an Edexcel maths tutor
Stuck on this? Book a trial session with an Edexcel specialist.