Oct 2021: AS AS Paper 2 Section A: Statistics

30 marks · 14 question parts · Question paper, mark scheme and examiner's report on Pearson's site

Question by question

QTopicMarksDifficulty
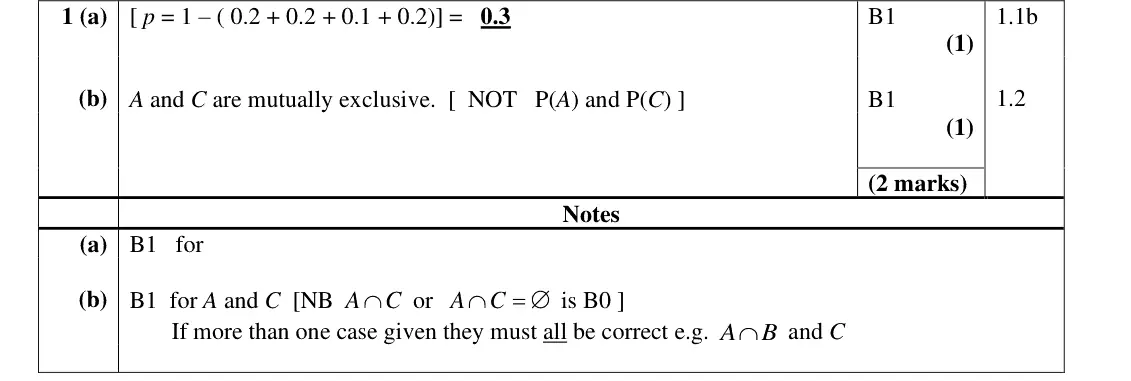
1(a) Probability, including conditional probability 1 —
1(b) Probability, including conditional probability 1 —
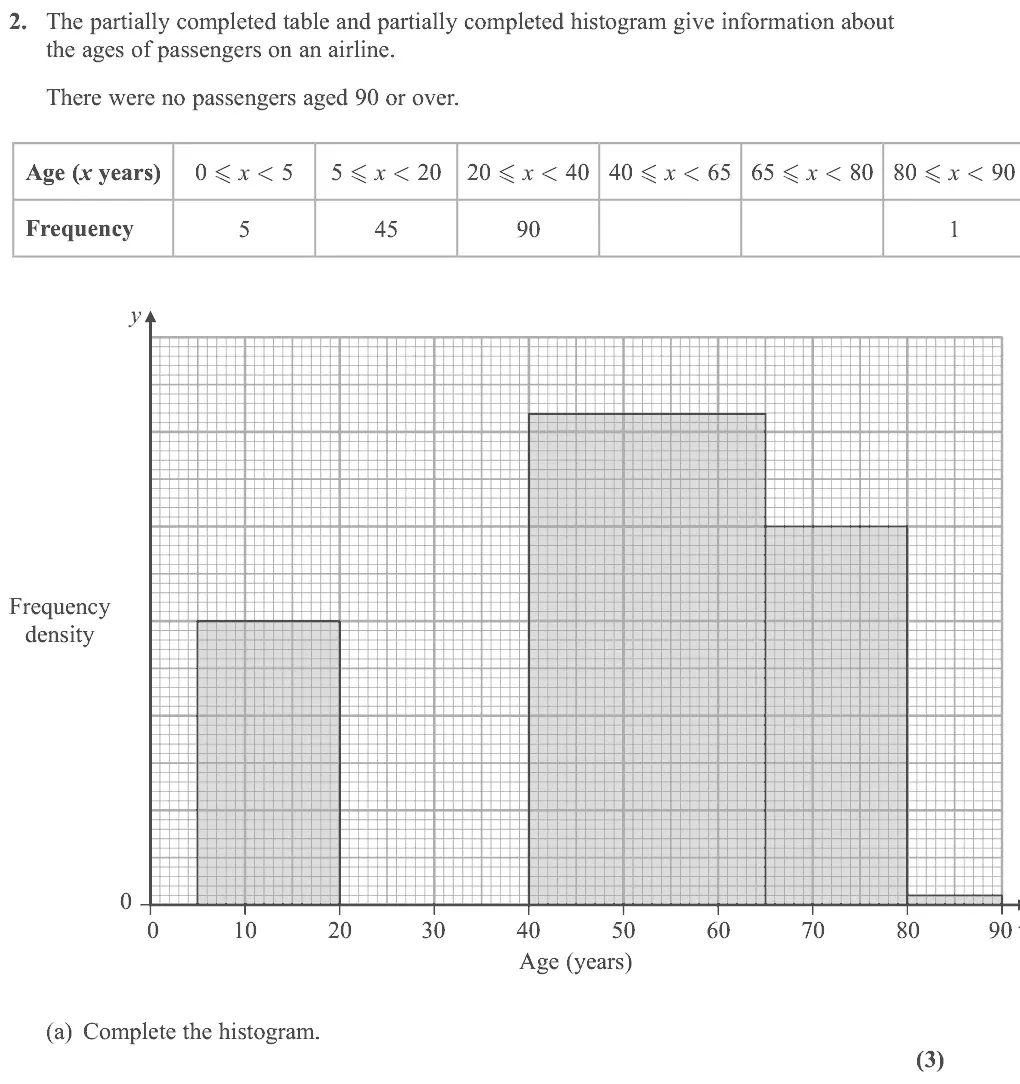
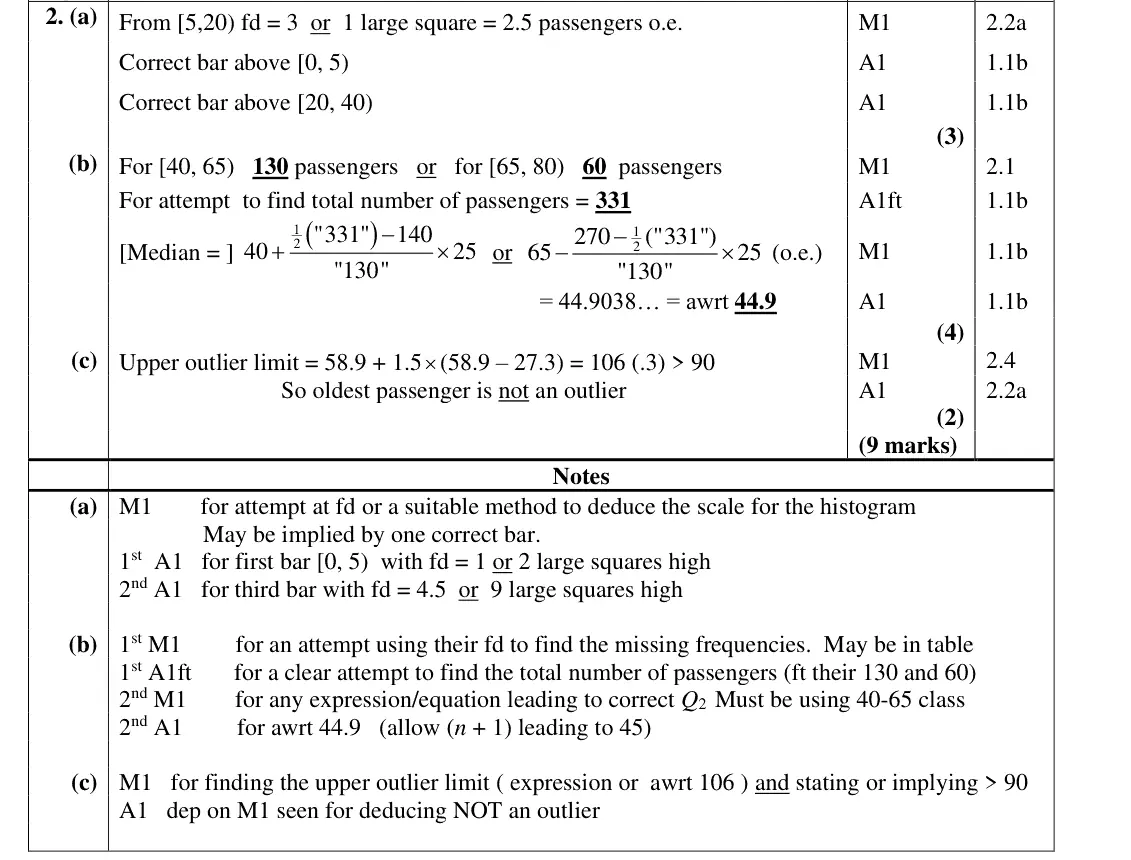
2(a) Data presentation: histograms, box plots, measures and outliers 3 Easy
2(b) Data presentation: histograms, box plots, measures and outliers 4 Easy
2(c) Data presentation: histograms, box plots, measures and outliers 2 Easy
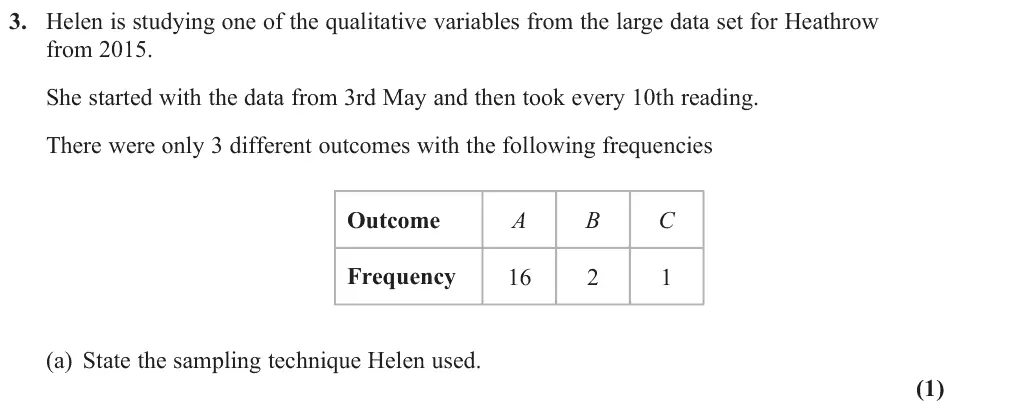
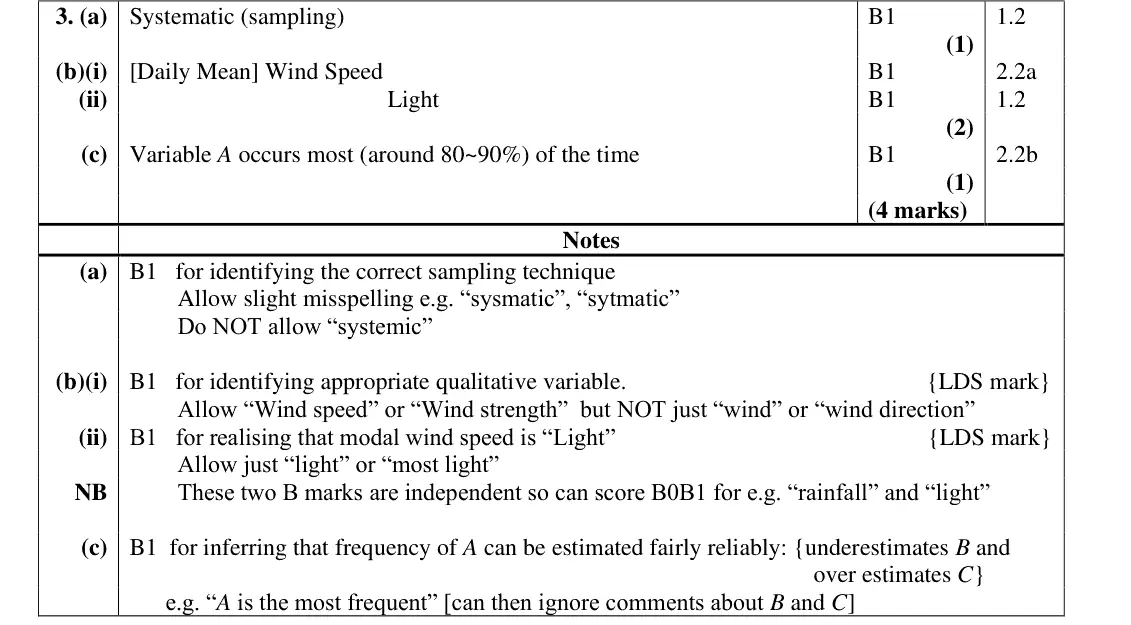
3(a) Sampling 1 —
3(b) Sampling, The large data set 2 —
3(c) Sampling 1 —
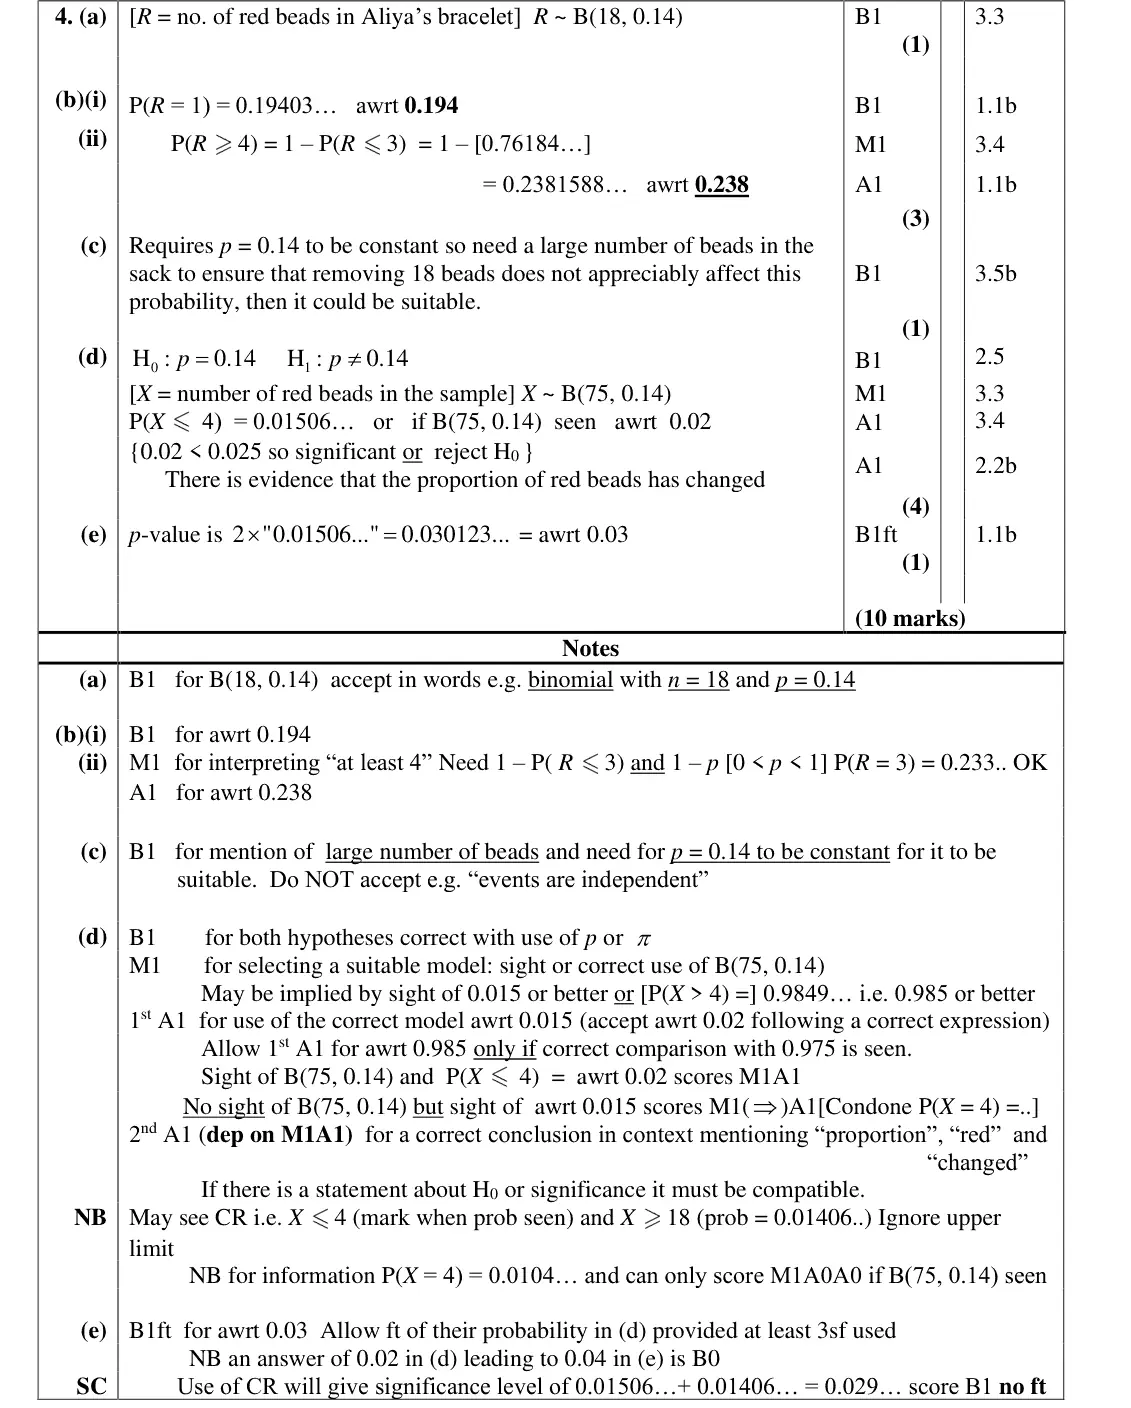
4(a) Discrete distributions and the binomial distribution 1 Easy
4(b) Discrete distributions and the binomial distribution 3 Medium
4(c) Discrete distributions and the binomial distribution 1 —
4(d) Hypothesis testing 4 —
4(e) Hypothesis testing 1 —
5 Probability, including conditional probability 5 —

The questions

1(a)1(b)2(a)2(b)2(c)3(a)3(b)3(c)4(a)4(b)4(c)4(d)4(e)5
Oct 2021 · AS Paper 2 (Statistics) · Q1(a) 1 mark probability
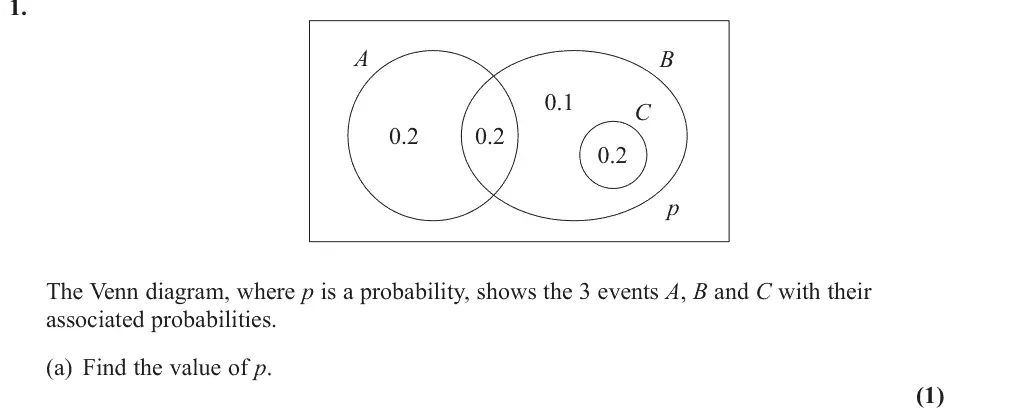
1. A B 0.1 C 0.2 0.2 0.2 p The Venn diagram, where p is a probability, shows the 3 events A, B and C with their associated probabilities. (a) Find the value of p. (1)
Oct 2021 · AS Paper 2 (Statistics) · Q1(b) 1 mark probability
(b) Write down a pair of mutually exclusive events from A, B and C. (1)
Oct 2021 · AS Paper 2 (Statistics) · Q2(a) 3 marks Easy data presentation
2. The partially completed table and partially completed histogram give information about the ages of passengers on an airline. There were no passengers aged 90 or over. Age (x years) 0 x < 5 5 x < 20 20 x < 40 40 x < 65 65 x < 80 80 x < 90 Frequency y Frequency density 90 x Age (years) (a) Complete the histogram. (3)
Oct 2021 · AS Paper 2 (Statistics) · Q2(b) 4 marks Easy data presentation
(b) Use linear interpolation to estimate the median age. (4)
Oct 2021 · AS Paper 2 (Statistics) · Q2(c) 2 marks Easy data presentation
An outlier is defined as a value greater than Q3 + 1.5 x interquartile range. Given that Q1 = 27.3 and Q3 = 58.9 (c) determine, giving a reason, whether or not the oldest passenger could be considered as an outlier. (2)
Oct 2021 · AS Paper 2 (Statistics) · Q3(a) 1 mark sampling
3. Helen is studying one of the qualitative variables from the large data set for Heathrow from 2015. She started with the data from 3rd May and then took every 10th reading. There were only 3 different outcomes with the following frequencies Outcome A B C Frequency (a) State the sampling technique Helen used. (1)
Oct 2021 · AS Paper 2 (Statistics) · Q3(b) 2 marks samplinglarge data set
(b) From your knowledge of the large data set (i) suggest which variable was being studied, (ii) state the name of outcome A. (2)
Oct 2021 · AS Paper 2 (Statistics) · Q3(c) 1 mark sampling
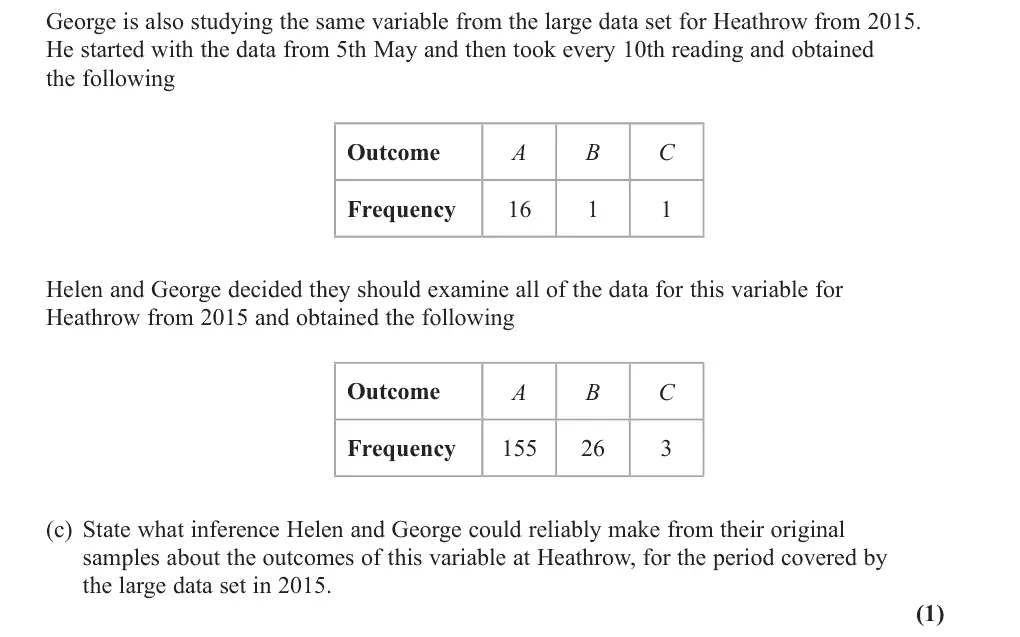
George is also studying the same variable from the large data set for Heathrow from 2015. He started with the data from 5th May and then took every 10th reading and obtained the following Outcome A B C Frequency Helen and George decided they should examine all of the data for this variable for Heathrow from 2015 and obtained the following Outcome A B C Frequency (c) State what inference Helen and George could reliably make from their original samples about the outcomes of this variable at Heathrow, for the period covered by the large data set in 2015. (1)
Oct 2021 · AS Paper 2 (Statistics) · Q4(a) 1 mark Easy binomial distribution
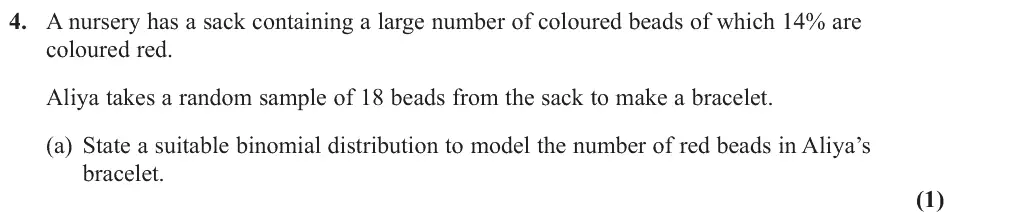
4. A nursery has a sack containing a large number of coloured beads of which 14% are coloured red. Aliya takes a random sample of 18 beads from the sack to make a bracelet. (a) State a suitable binomial distribution to model the number of red beads in Aliya’s bracelet. (1)
Oct 2021 · AS Paper 2 (Statistics) · Q4(b) 3 marks Medium binomial distribution
(b) Use this binomial distribution to find the probability that (i) Aliya has just 1 red bead in her bracelet, (ii) there are at least 4 red beads in Aliya’s bracelet. (3)
Oct 2021 · AS Paper 2 (Statistics) · Q4(c) 1 mark binomial distribution
(c) Comment on the suitability of a binomial distribution to model this situation. (1)
Oct 2021 · AS Paper 2 (Statistics) · Q4(d) 4 marks hypothesis testing
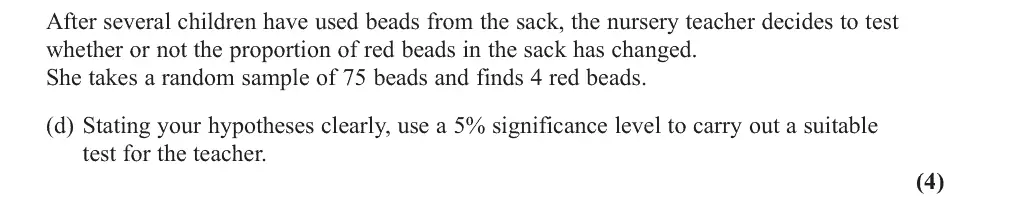
After several children have used beads from the sack, the nursery teacher decides to test whether or not the proportion of red beads in the sack has changed. She takes a random sample of 75 beads and finds 4 red beads. (d) Stating your hypotheses clearly, use a 5% significance level to carry out a suitable test for the teacher. (4)
Oct 2021 · AS Paper 2 (Statistics) · Q4(e) 1 mark hypothesis testing
(e) Find the p‑value in this case. (1)
Oct 2021 · AS Paper 2 (Statistics) · Q5 5 marks probability
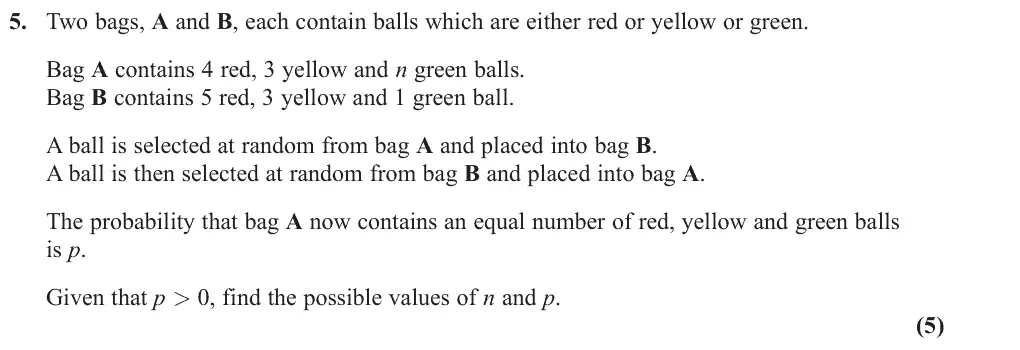
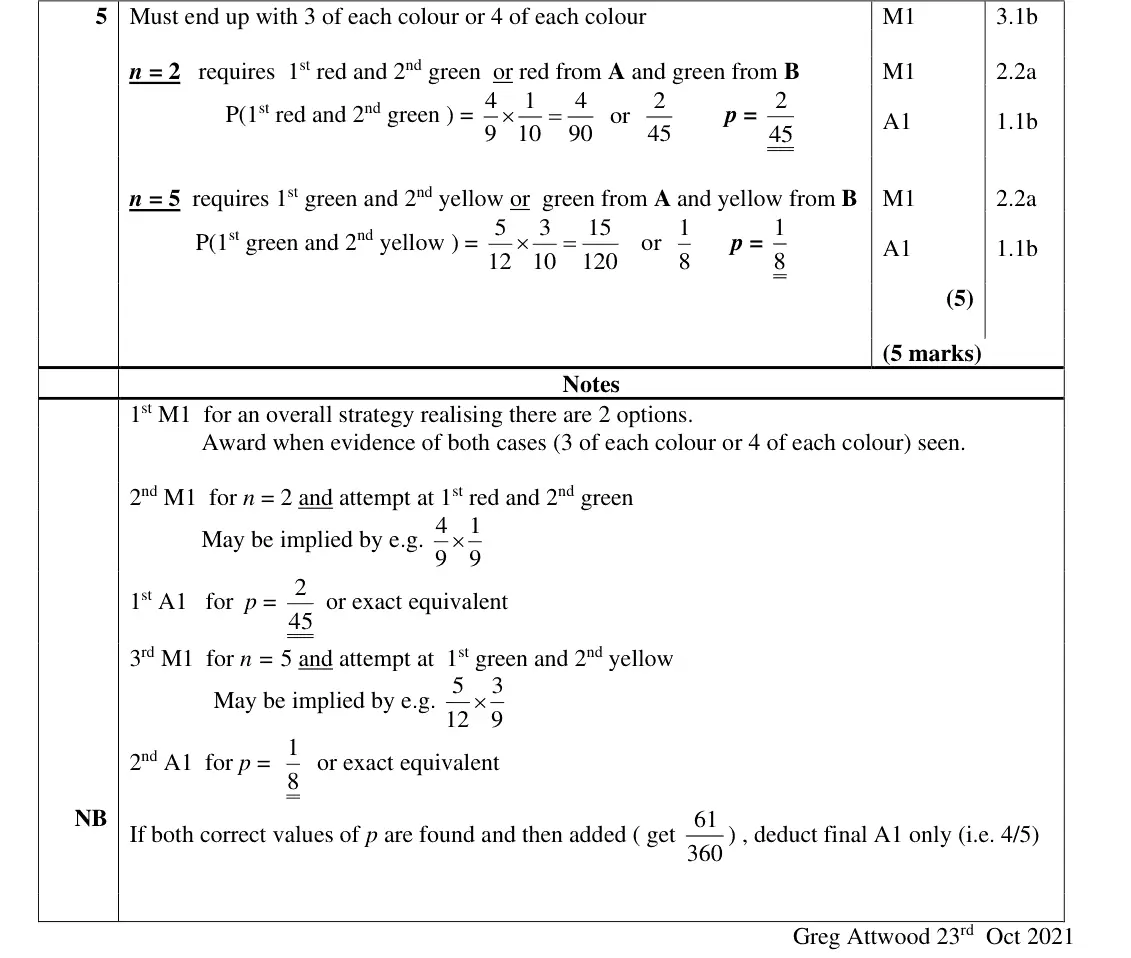
5. Two bags, A and B, each contain balls which are either red or yellow or green. Bag A contains 4 red, 3 yellow and n green balls. Bag B contains 5 red, 3 yellow and 1 green ball. A ball is selected at random from bag A and placed into bag B. A ball is then selected at random from bag B and placed into bag A. The probability that bag A now contains an equal number of red, yellow and green balls is p. Given that p > 0, find the possible values of n and p. (5)

Find an Edexcel maths tutor

Want this paper marked and gone through with you? Message us.

Prefer email? Send an enquiry

If you are under 18, please include a parent's contact details. Enquiries go to enquiries@mathsaleveltutor.com and are deleted once handled.