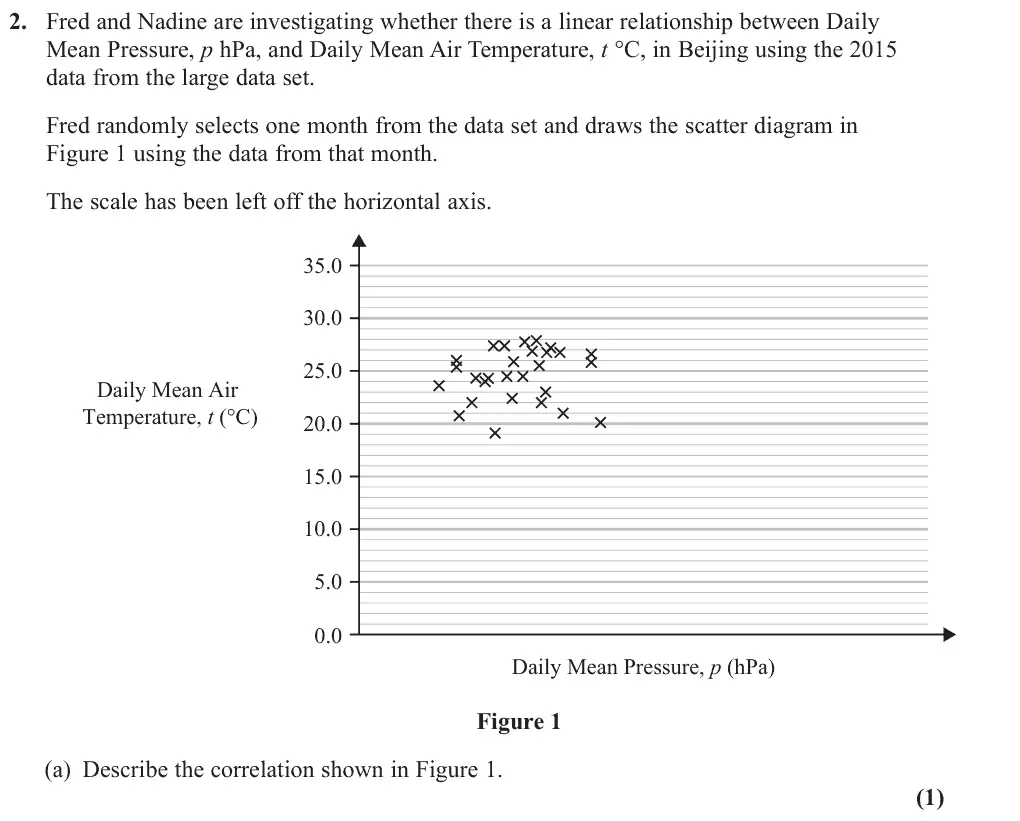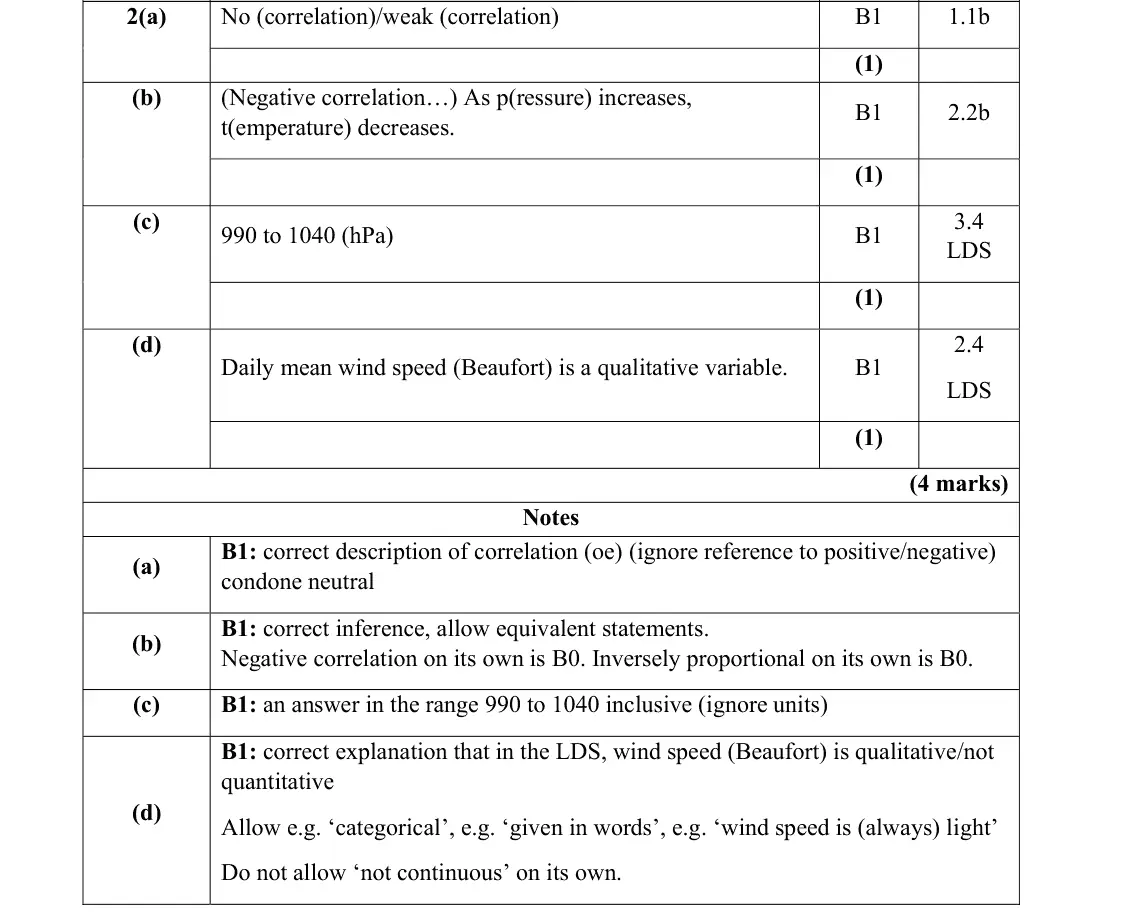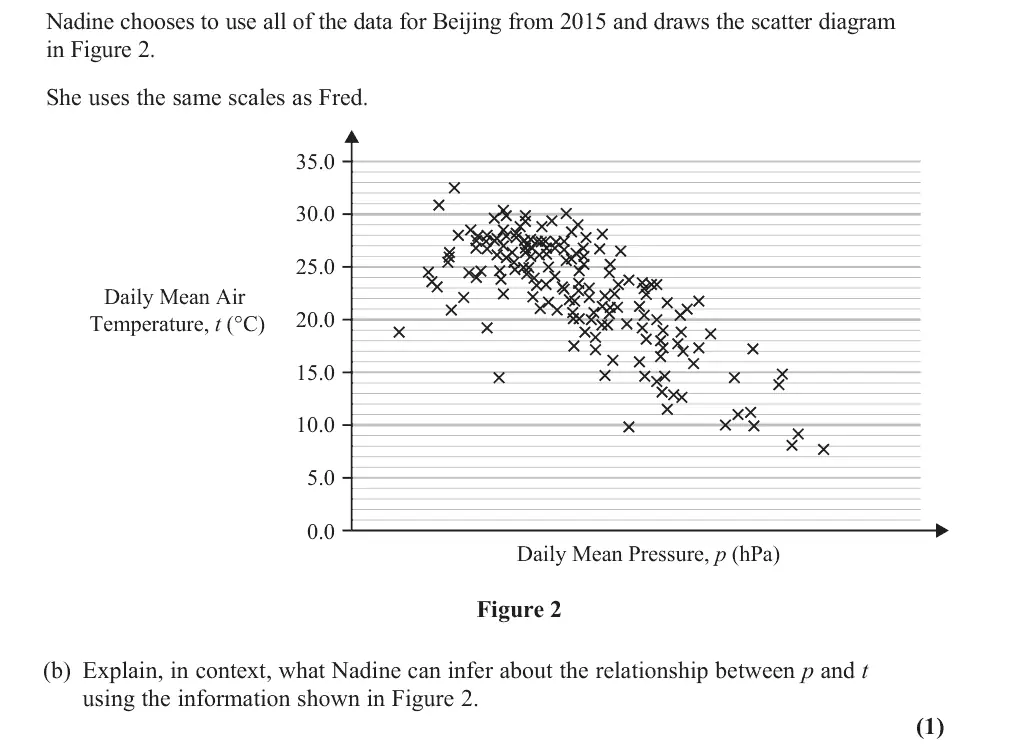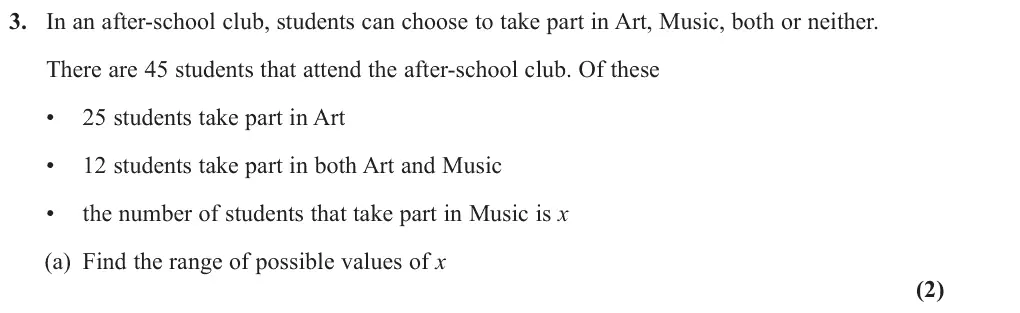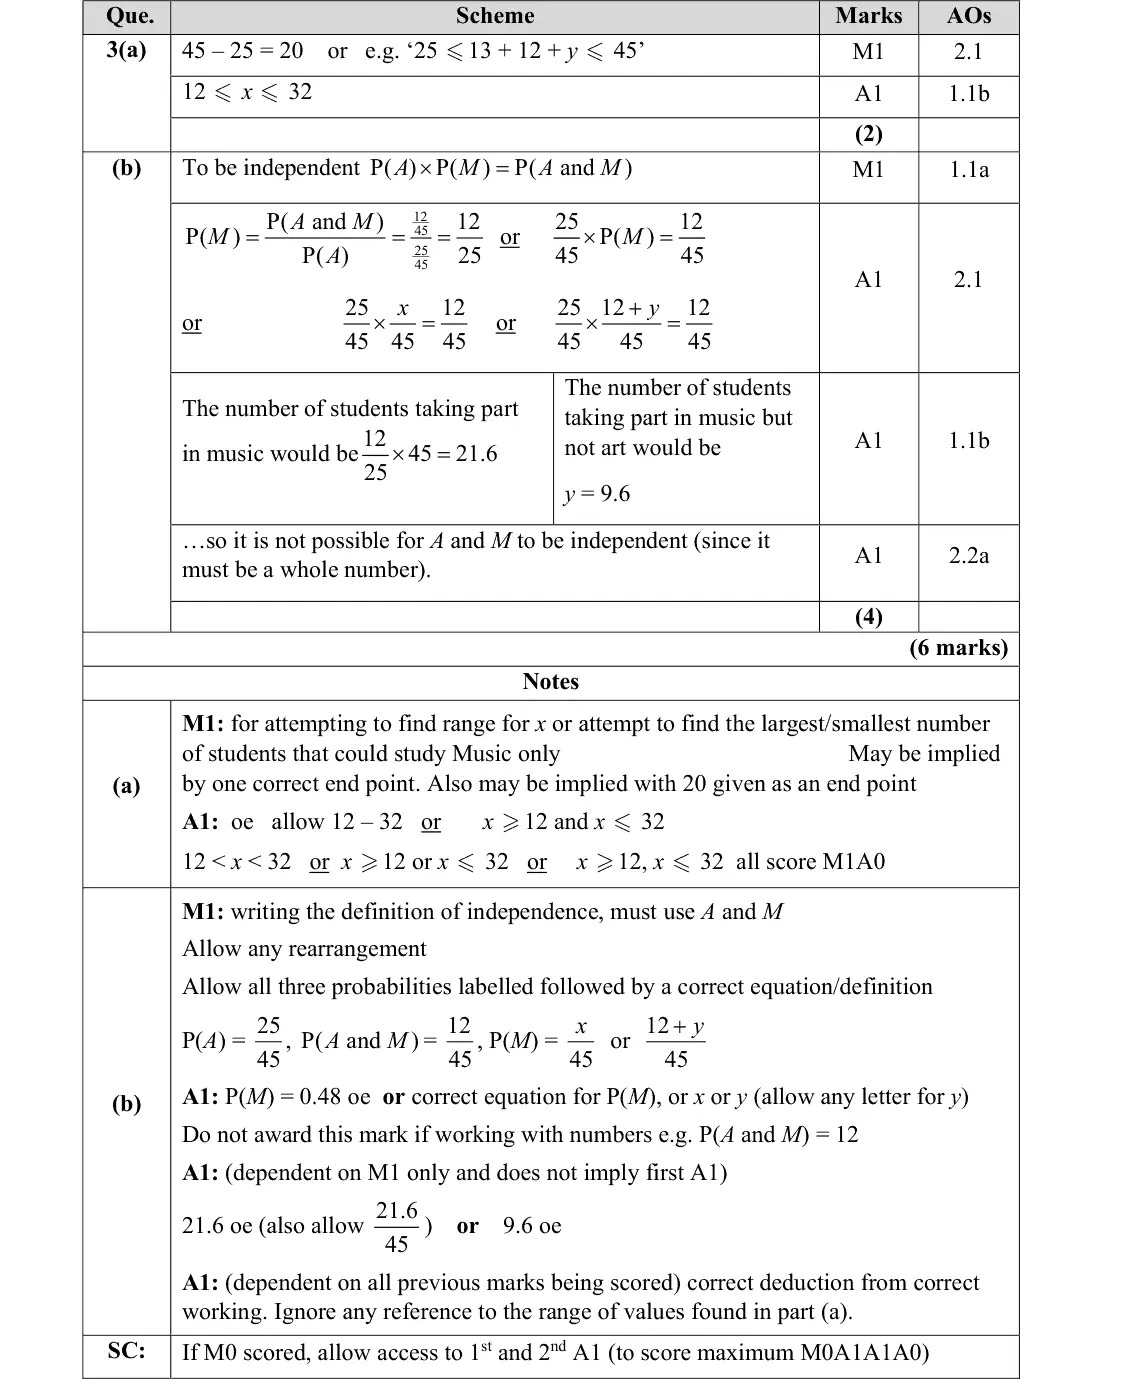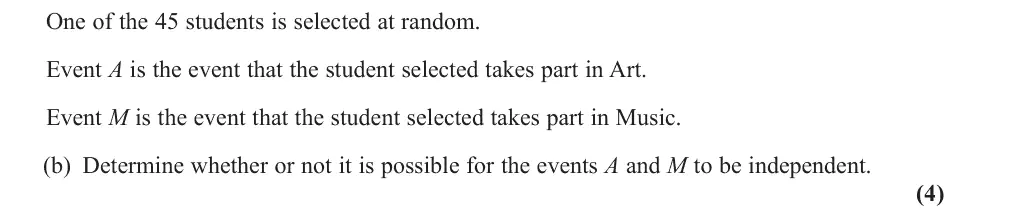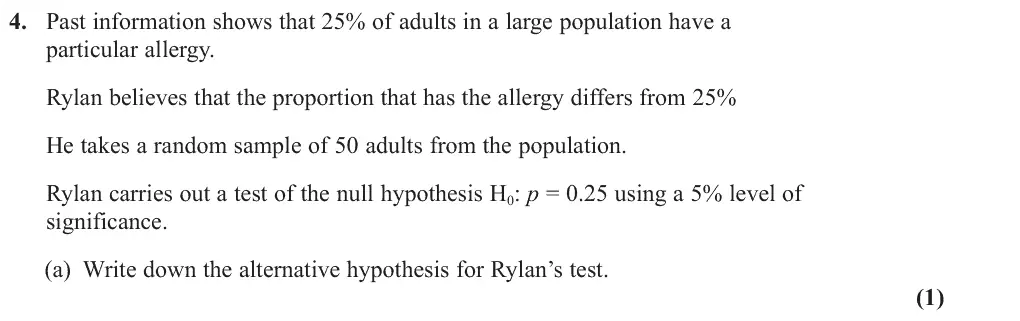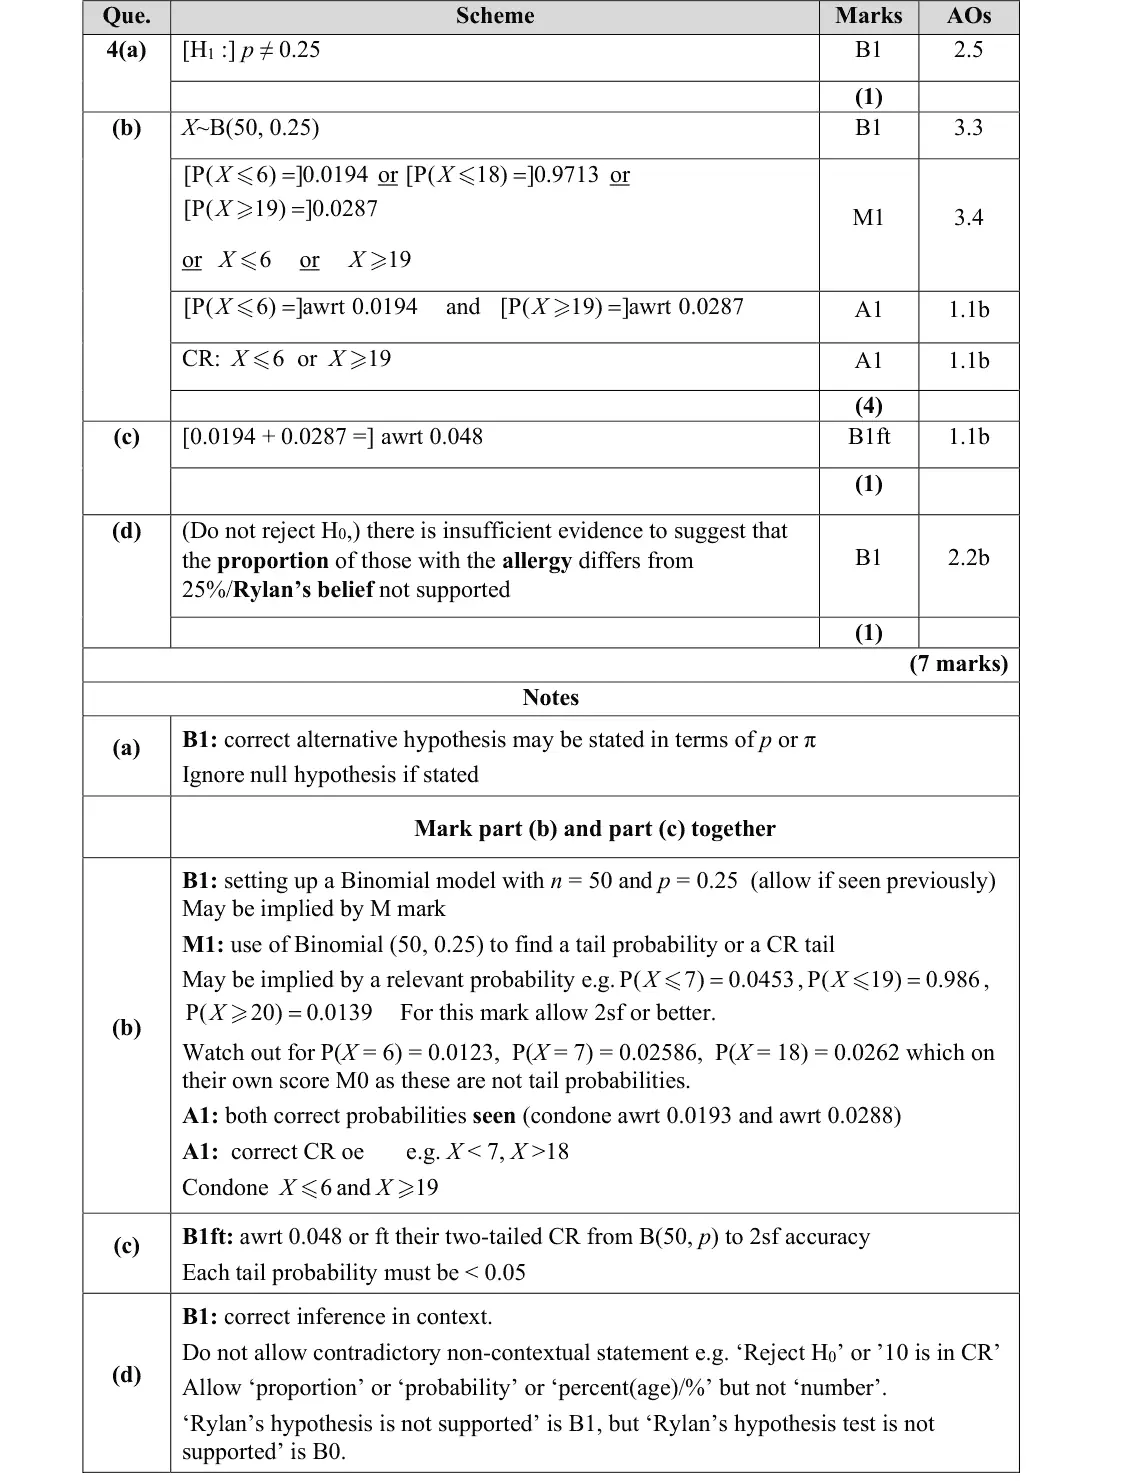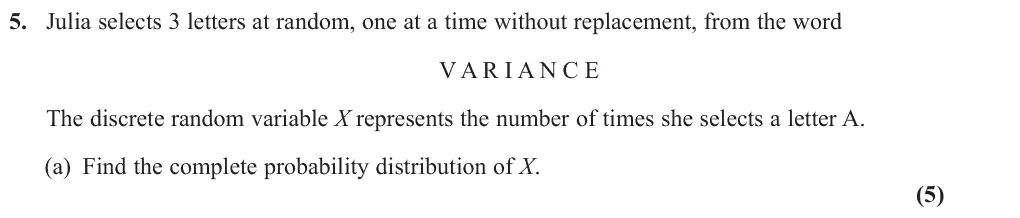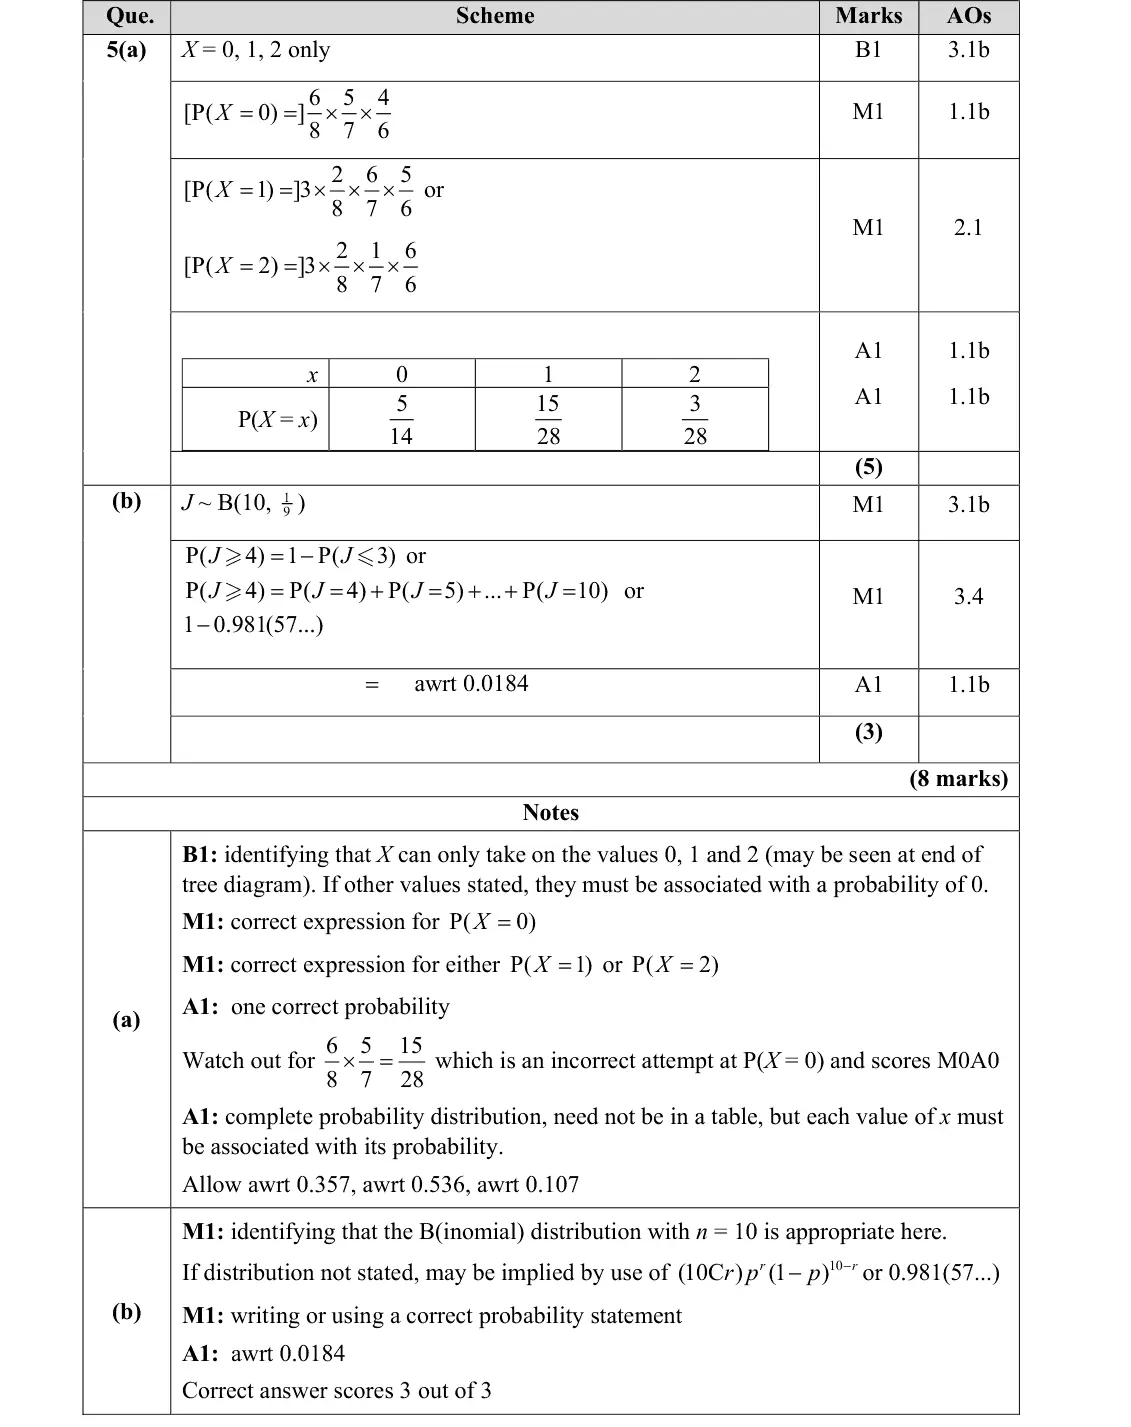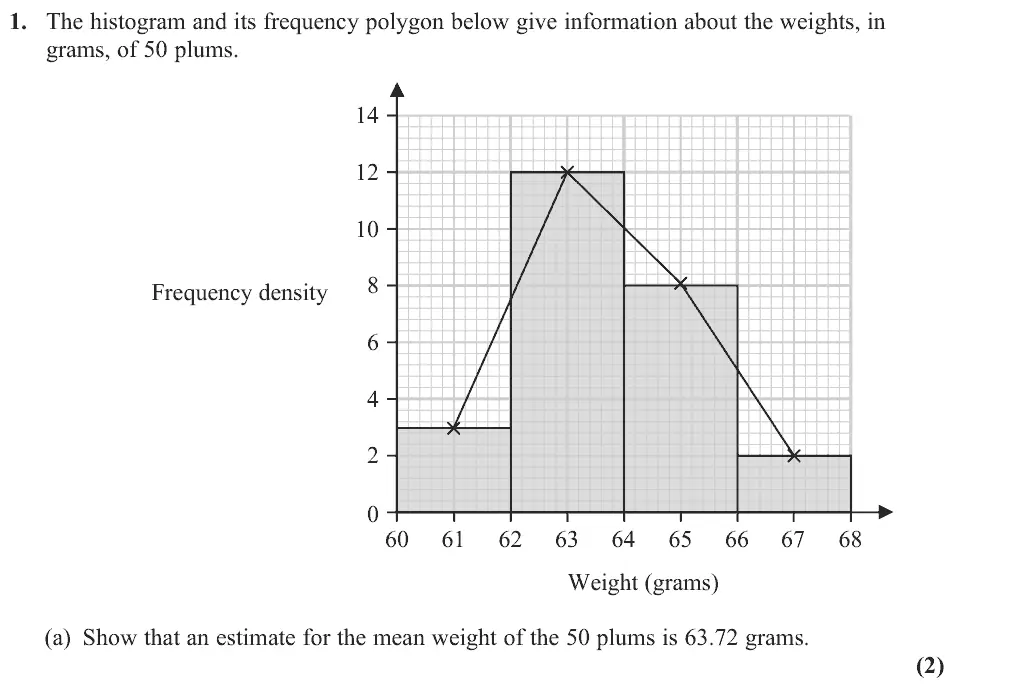
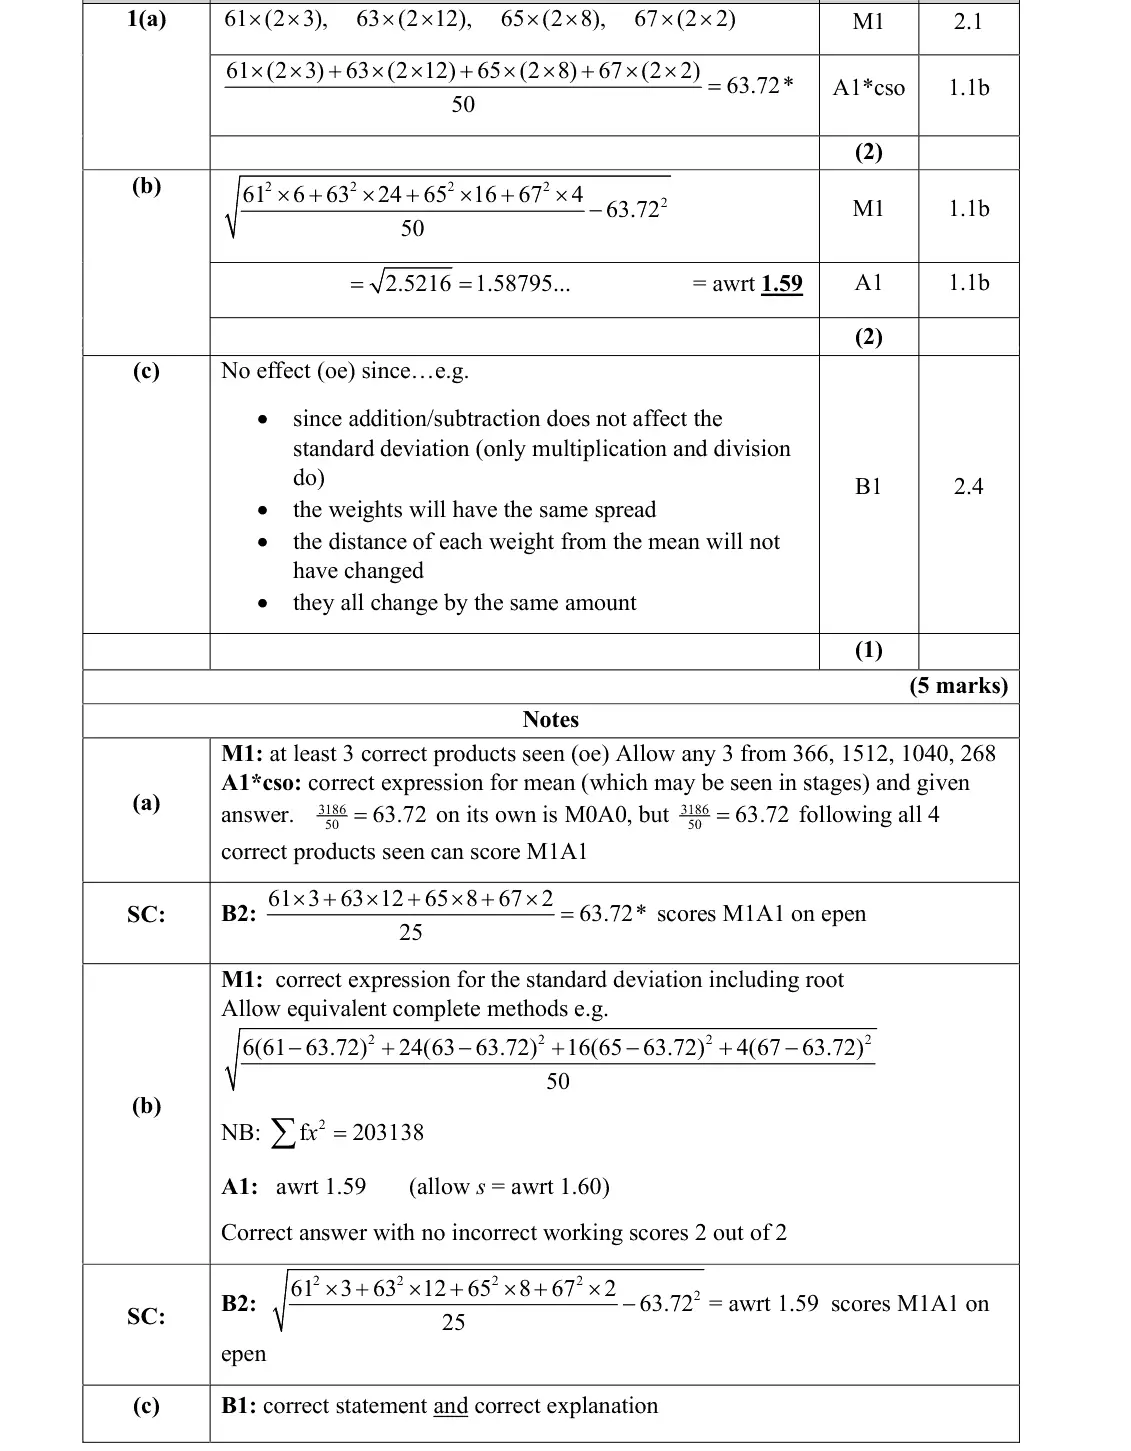
Mark scheme (whole question; this part is marked with the orange bar)
Examiner's comment
Part (a) was a generally successful start to the paper with the vast majority of students able to show sufficient calculations to arrive at the given mean. A few students opted to use the upper class boundary in their calculation. On some occasions 3186 50 was written with no supporting evidence. Some students misunderstood the demand and attempted to use interpolation to find the median instead of the mean.
Common mistakes
- read the histogram: frequency = frequency density × class width 2 (3, 12, 8, 2 doubled to 6, 24, 16, 4)
- use midpoints 61, 63, 65, 67, not upper boundaries
- 3186/50 alone with no products scores 0
- some found the median instead