Understand and use conditional probability, including the use of tree diagrams, Venn diagrams, two-way tables. Understand and use the conditional probability formula P(A|B) = P(A∩B) / P(B).
Guidance
Understanding and use of P(A′) = 1 − P(A), P(A∪B) = P(A) + P(B) − P(A∩B), P(A∩B) = P(A) P(B|A).
Mark scheme (whole question; this part is marked with the orange bar)
Examiner's comment
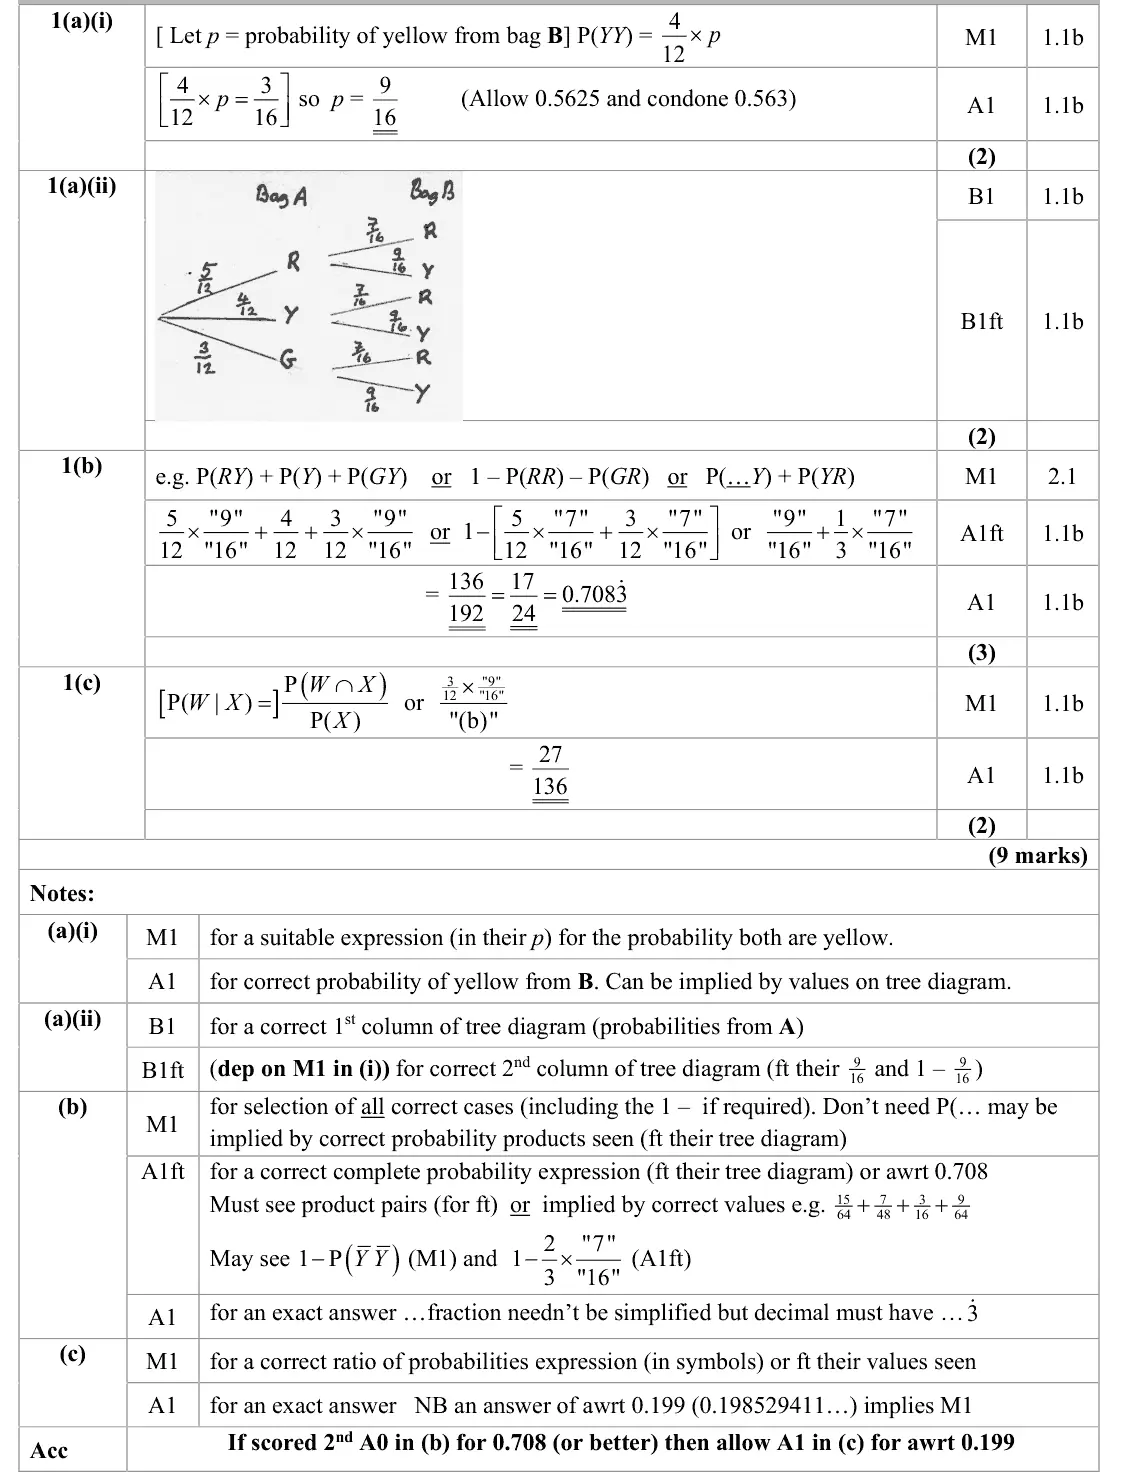
( ) ( ) 1 P P RR GR - - . Few responses did not present their answers in (b) and (c) as exact fractions as required. ( ) P W X ∩ but appreciating that W X meant that the In part (c) many could write down ∩ ( ) P X case GY was required defeated a large number. It was fairly common to see the answer to part
Common mistakes
W ∩ X is the single case GY = (3/12)(9/16)
divide by P(X) from (b)
27/136 exact
June 2024 · Paper 3 (Statistics) · Q6(c)3 marks
Mark scheme (whole question; this part is marked with the orange bar)
Examiner's comment
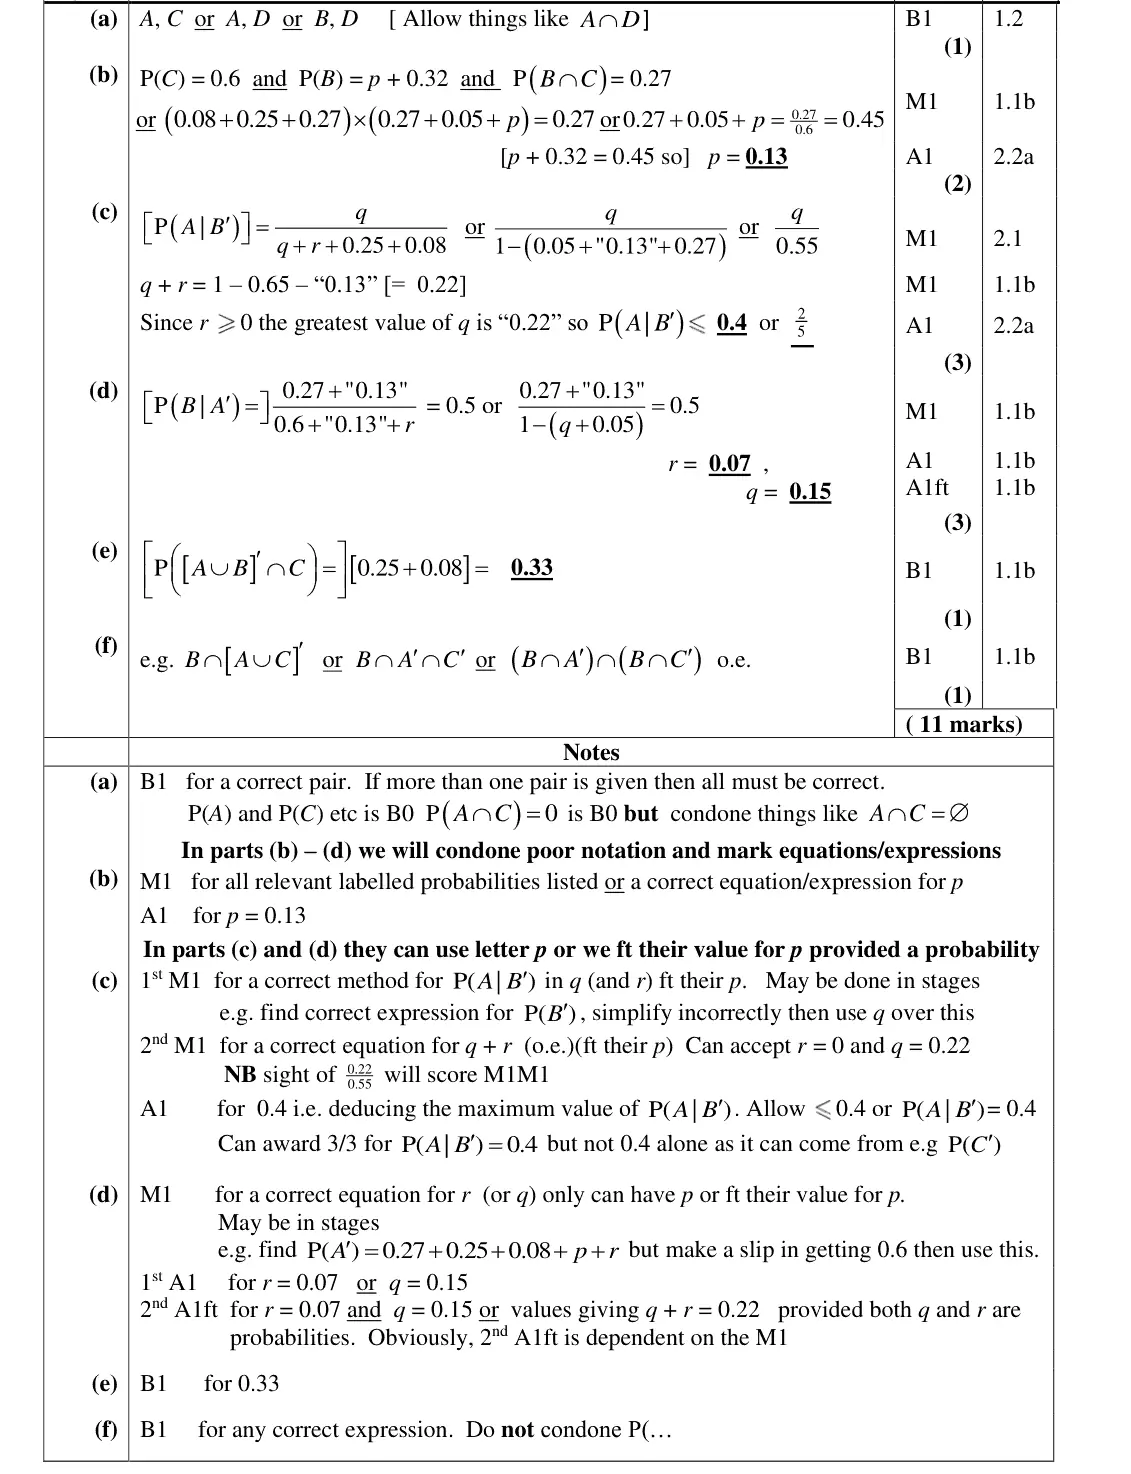
few students omitted the 0.08 from P(C). Part (c) proved more discriminating. Whilst many ( ) P A B students knew ( ) = P | A B they were not able to find the relevant values from the ( ) P B Venn diagram. Some thought ( ) ( ) ( ) = P P P A B A B and quite a few were unable to establish the relationship q + r = 0.22 and some of those who did get this far believed that r couldn’t be 0 and gave an answer of 0.21 . A common error was to write 0.55 ( ) P A + 0.05 q ( ) = = P | A B . In part (d), having been given an equation with ( ) + + + P 0.25 0.08 B q r
Common mistakes
P(A given B′) = q/0.55
q + r = 0.22 and r ≥ 0 so greatest q = 0.22 giving 0.4
r can be 0 (not 0.21)
P(A ∩ B′) is not P(A)P(B′)
June 2024 · Paper 3 (Statistics) · Q6(d)3 marks
Mark scheme (whole question; this part is marked with the orange bar)
Examiner's comment
( ) P A + 0.05 q ( ) = = P | A B . In part (d), having been given an equation with ( ) + + + P 0.25 0.08 B q r which to work, students were much more successful with many gaining all 3 marks. There were errors with the conditional probability again and many slips in adding probabilities, but it was 0.4 r = 0.5 common to see leading to the correct values for r and q. When part (e) was + 0.73
Common mistakes
P(B given A′) = (0.27 + 0.13)/(0.6 + 0.13 + r) = 0.5 gives r = 0.07, q = 0.15
slips adding probabilities
June 2023 · Paper 3 (Statistics) · Q1(c)2 marks
Mark scheme (whole question; this part is marked with the orange bar)
Examiner's comment
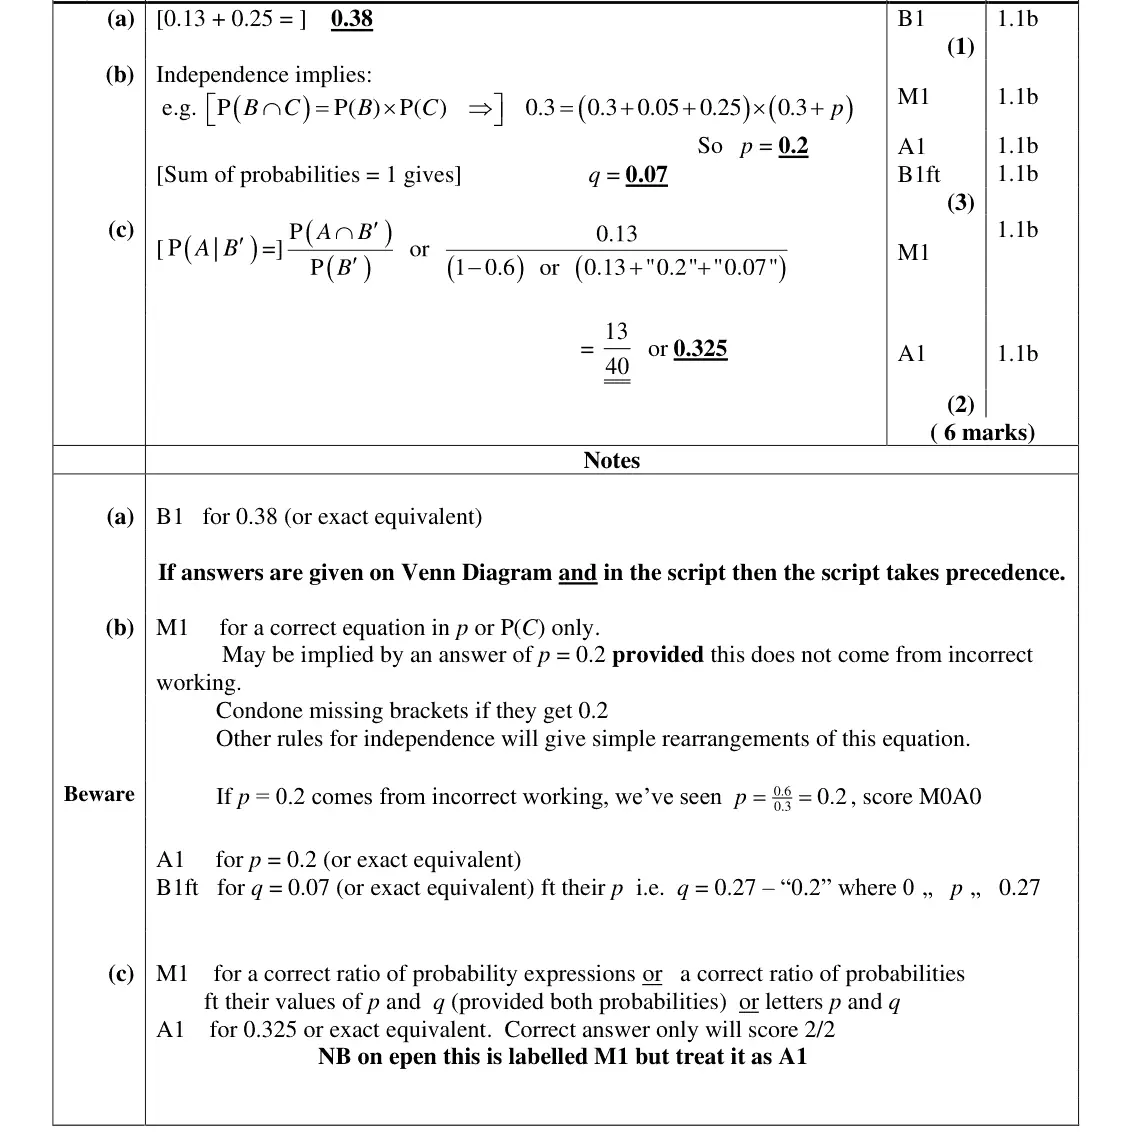
This proved to be a positive and accessible start to the paper. In part (c), some used the simple conditional probability formula = [ P( ] in the formula booklet to get started whereas others just wrote A ) P( )P( | ) B A A B down a correct ratio of probabilities from their Venn diagram. A fairly common error was to have P(B) = 0.6 as the denominator and a few misinterpreted the formula and used ( ) P A B . Those using the more complicated formula for P(A|B) in the formula booklet ( ) P B rarely managed to complete part (c) and students should be encouraged to know how to use the formulae in the formula booklet efficiently.
Common mistakes
P(A ∩ B′) / P(B′) = 0.13/0.4 = 0.325
common error using P(B) = 0.6 as the denominator
the long formula-booklet version for P(A given B′) rarely succeeds
June 2023 · Paper 3 (Statistics) · Q5(a)2 marks
Mark scheme (whole question; this part is marked with the orange bar)
Examiner's comment
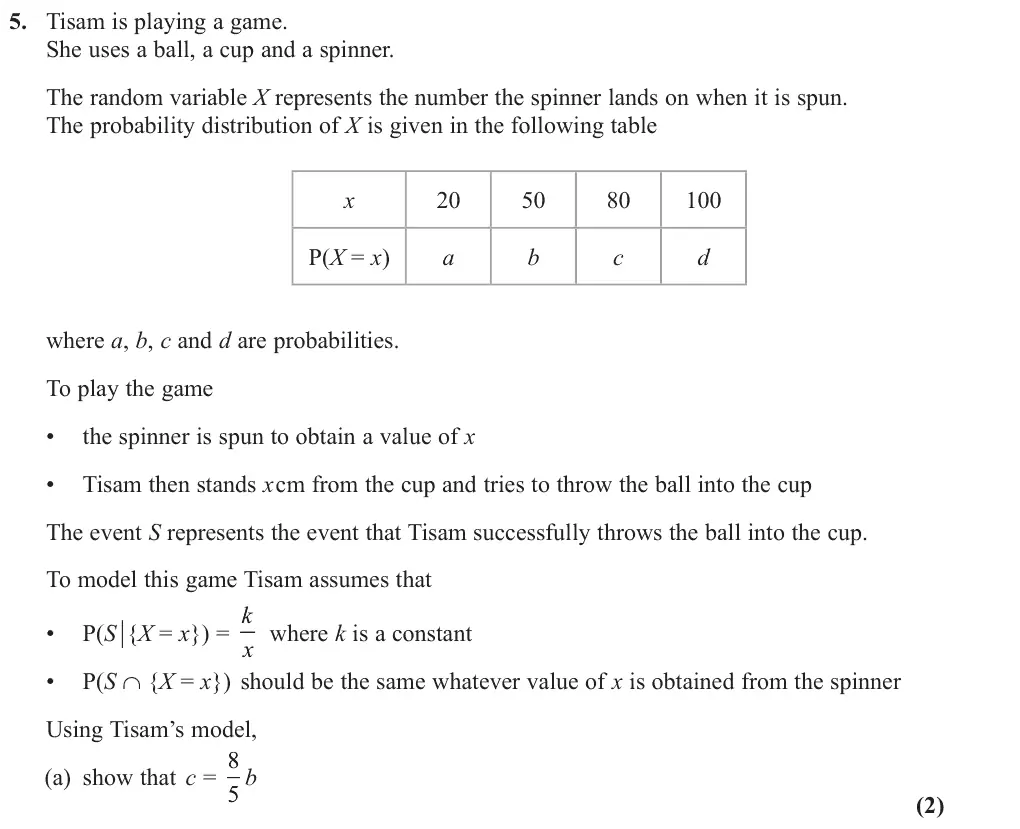
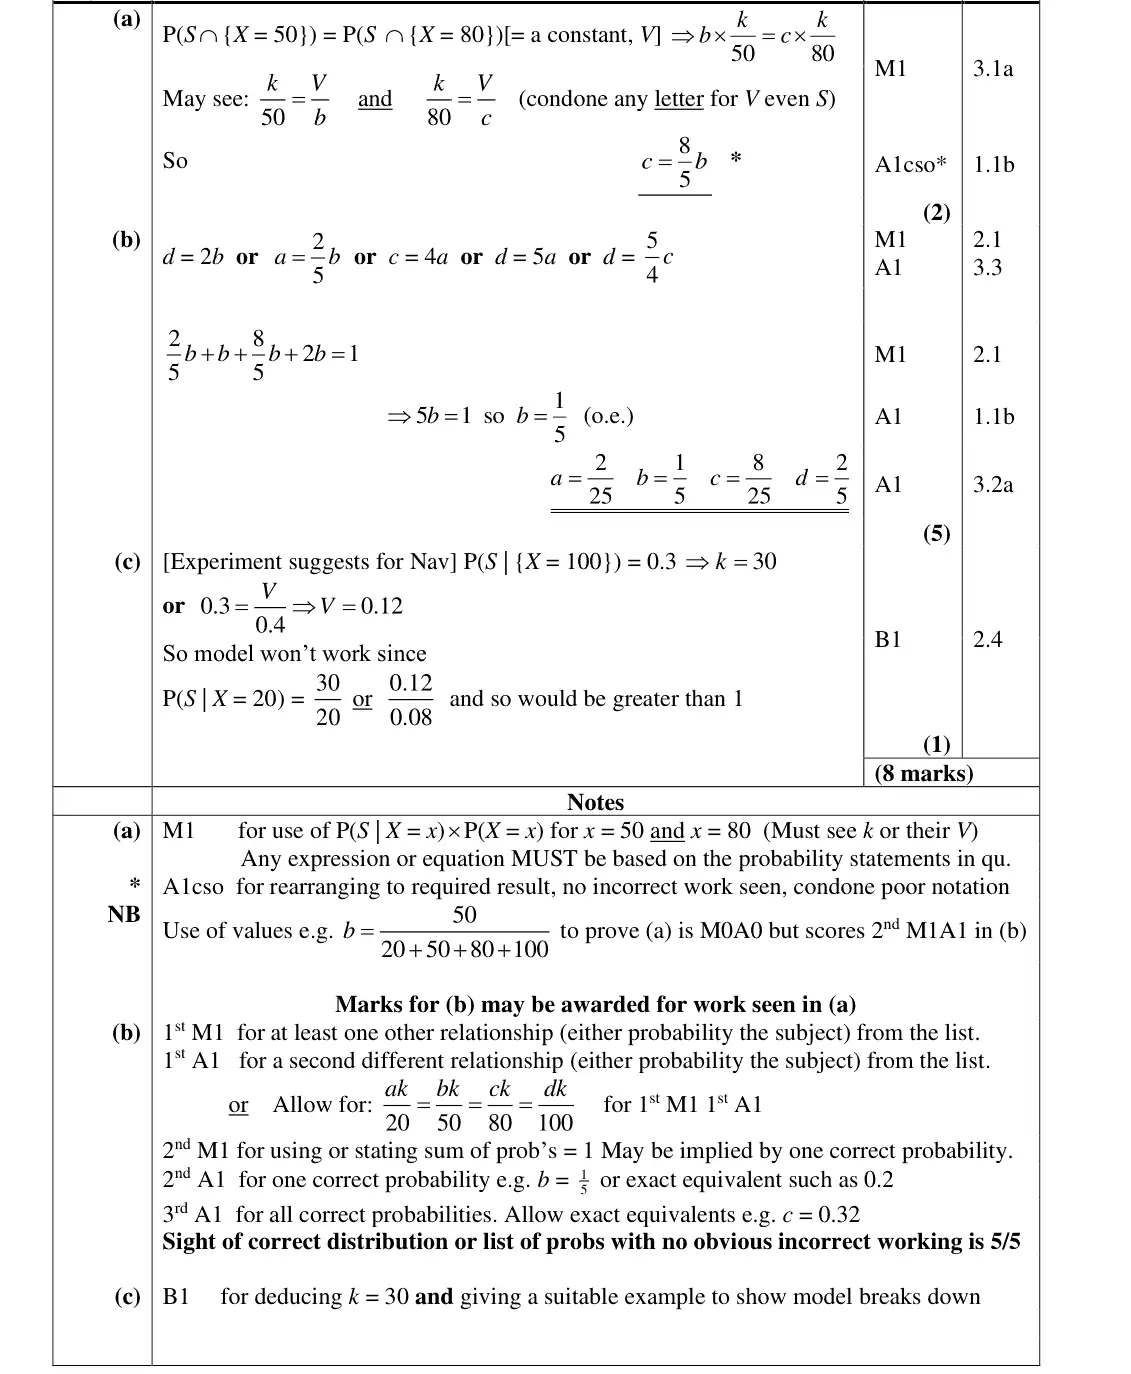
This question proved to be the most challenging on the paper for students. In part (a) few could see how to use the two bullet points to reach the required result. A k good number realised that P(S |{X = x}) = x but couldn’t always use the conditional k probability formula to reach ( ) = = . Those that did get this far were P 50 S X b 50 often able to give a convincing proof of the given result. A common misconception was k k = = believing that and then using the sum of the probabilities equalling 1 , etc a b 20 50 but this scored no marks. It was good to see a number of students using the result from part (a) to form similar relationships between the probabilities, such as d = 2b and going on to solve their equations to find the probability distribution. The final part was particularly challenging with many misinterpreting the 30% probability
Common mistakes
P(S ∩ X = x) = P(S given X = x) × P(X = x), so b × k/50 = c × k/80
assuming k/50 = b (and summing to 1) scores nothing
June 2023 · Paper 3 (Statistics) · Q5(b)5 marks
Mark scheme (whole question; this part is marked with the orange bar)
Examiner's comment
This question proved to be the most challenging on the paper for students.
Common mistakes
form further relations (d = 2b, a = 2b/5) from the same idea, then sum of probabilities = 1: b = 1/5, a = 2/25, c = 8/25, d = 2/5
June 2023 · Paper 3 (Statistics) · Q5(c)1 mark
Mark scheme (whole question; this part is marked with the orange bar)
Examiner's comment
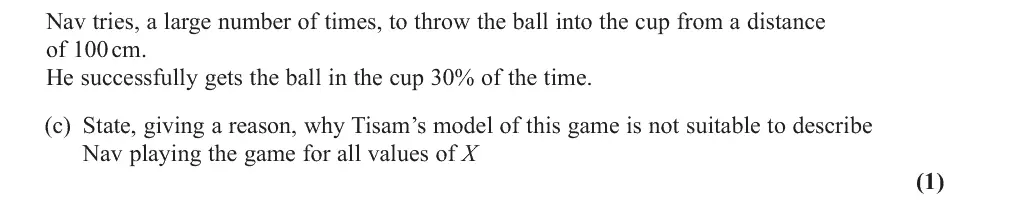
This question proved to be the most challenging on the paper for students. The final part was particularly challenging with many misinterpreting the 30% probability given in the stem to part (c). Many confused this 0.3 [= P(S | X = 100) ] with the 0.4 [= P(X = 100)] from the probability distribution and simply compared these two values. Those that did realise that Nav’s 30% meant that k = 30 often went on to show that when x = 20 this would give a probability [P(S | X = 20)] > 1 and so the model was not suitable.
Common mistakes
0.3 is P(S given X = 100), so k = 30
then P(S given X = 20) = 1.5 > 1, impossible
common error comparing 0.3 with P(X = 100) = 0.4
June 2022 · Paper 3 (Statistics) · Q5(c)4 marks
Mark scheme (whole question; this part is marked with the orange bar)
Examiner's comment
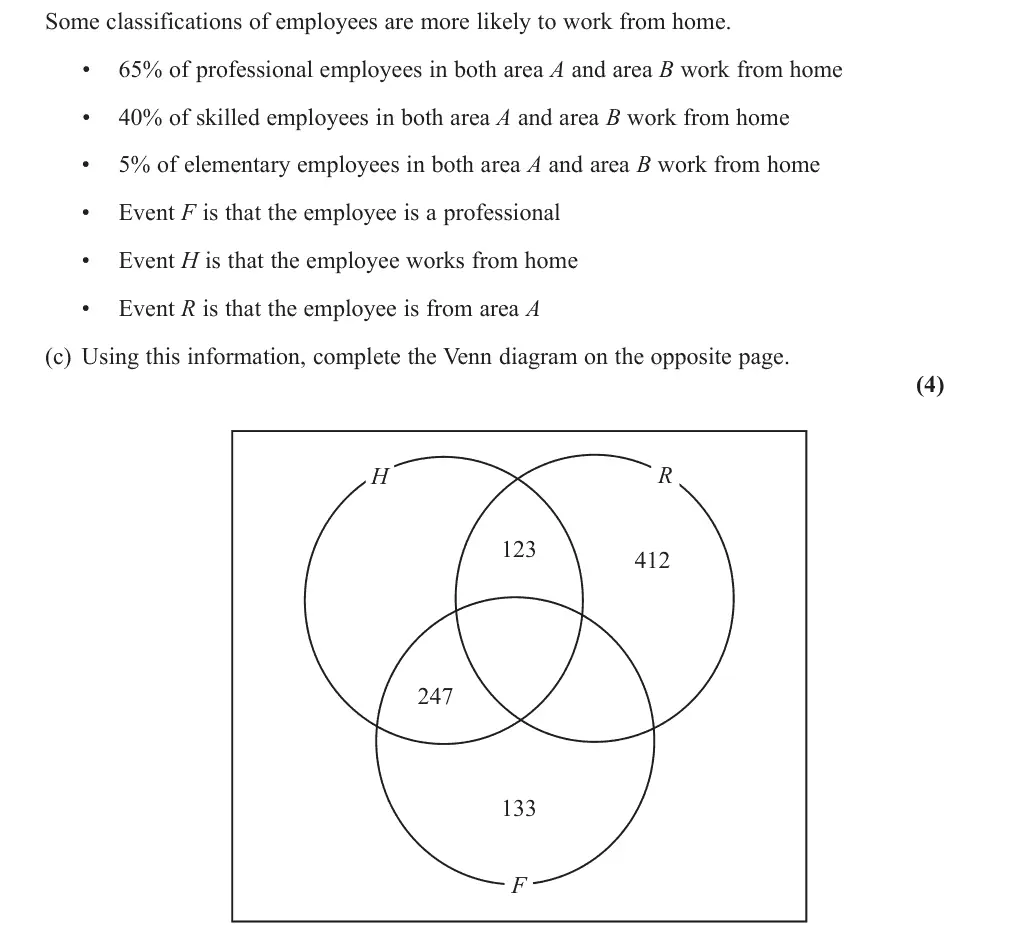
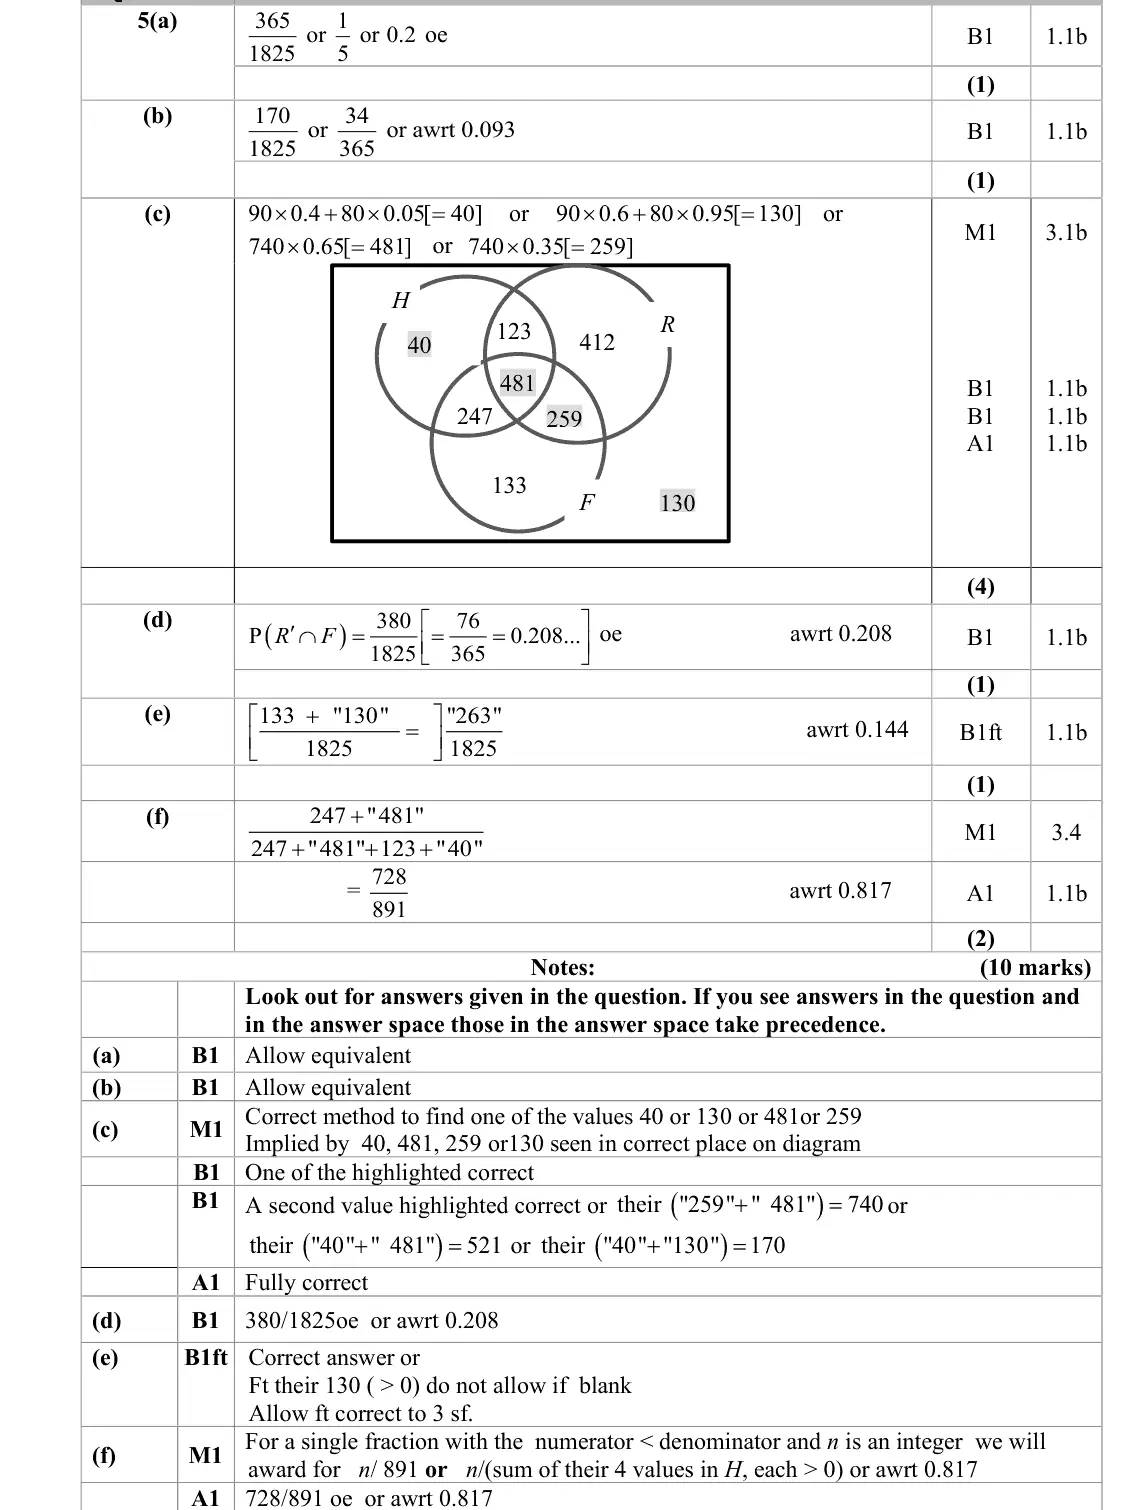
In part (c) there was mixed success in the interpretation of the information given in the question with only about half of students getting the Venn diagram completely correct. Some correct diagrams followed minimal working whilst others filled at least a page. A ′∩′∩ ′ blank. The method mark was common omission was to leave the region H R F most commonly given when implied by one correct value in the Venn diagram, rather than for the student’s working, which was commonly unclear. Some working indicated incorrect use of the given percentages. Where only one value was correct in the Venn diagram it was usually the 481 or 259, for ‘professionals from area A’. When none or only one of the four correct values was seen many students benefited from being able to achieve 1 mark for the sums of certain pairs of values in their diagram. There were a number of students who simply abandoned the Venn diagram which often resulted in no attempts being made at the remaining parts of the question.
Common mistakes
40 = 90 × 0.4 + 80 × 0.05 (skilled and elementary from B at home), 481 = 740 × 0.65, 259 = 740 × 0.35, 130 outside all circles
do not leave a region blank
June 2022 · Paper 3 (Statistics) · Q5(f)2 marks
Mark scheme (whole question; this part is marked with the orange bar)
Examiner's comment
Part (a) was well answered with most students able to gain the mark for a correct answer. A simplified fraction or the correct decimal value was often seen. Whilst the majority of students continued to score well in part (b) the most common incorrect answer came from students who thought the question was conditional, giving 170 550 , i.e. the probability of not being a professional given they live in area B. Some students attempted a product of probabilities assuming independence, which was not given and not correct. In part (c) there was mixed success in the interpretation of the information given in the question with only about half of students getting the Venn diagram completely correct. Some correct diagrams followed minimal working whilst others filled at least a page. A ′∩′∩ ′ blank. The method mark was common omission was to leave the region H R F most commonly given when implied by one correct value in the Venn diagram, rather than for the student’s working, which was commonly unclear. Some working indicated incorrect use of the given percentages. Where only one value was correct in the Venn diagram it was usually the 481 or 259, for ‘professionals from area A’. When none or only one of the four correct values was seen many students benefited from being able to achieve 1 mark for the sums of certain pairs of values in their diagram. There were a number of students who simply abandoned the Venn diagram which often resulted in no attempts being made at the remaining parts of the question. Part (d) had a mixed response with many correct answers. This part could be answered independently of whether or not (c) had been attempted and it was good to see most students doing so successfully through mark could only be scored by students who had some value in the region 𝐻𝐻′ ∩ 𝑅𝑅′ ∩𝐹𝐹′ so that this value could be added to the 133 in their calculation. A common Whilst many realised the 133 given in the Venn diagram was required, the follow- non-scoring answer of 133 1825 was often seen. Most students realised that part (d) was a conditional probability question with many taking the simpler approach of using numbers rather than probabilities in their ratio. Those with a correct Venn diagram usually scored both marks here. As is often the case, a noticeable number of students had the incorrect event, namely F, as the denominator in their probability expression rather than H.
Mark scheme (whole question; this part is marked with the orange bar)
Examiner's comment
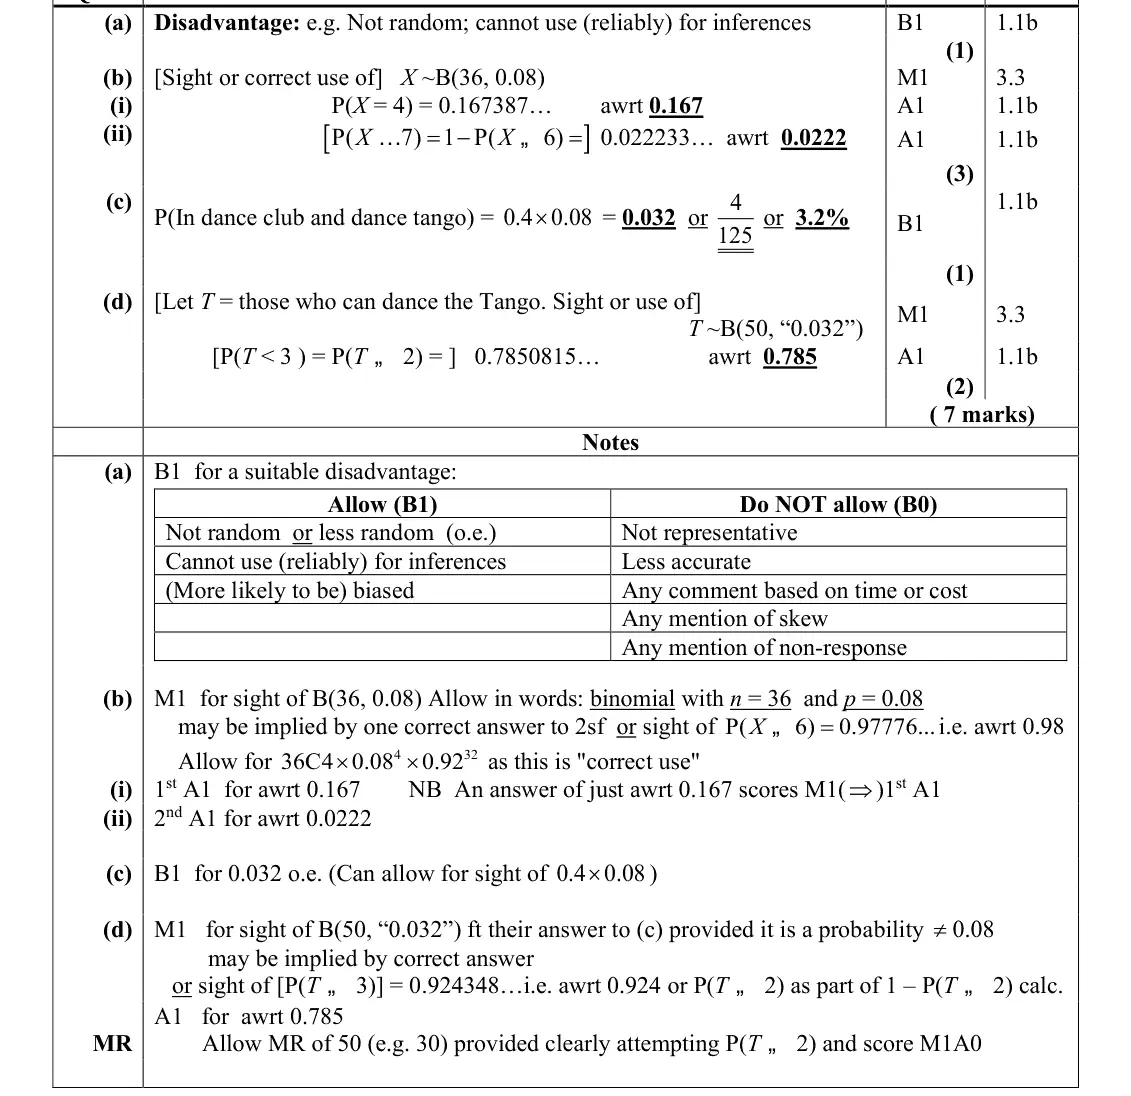
of 0.022 here and lost this mark. Part (c) was usually answered correctly and many went on to use the correct binomial distribution in part (d) though some found interpreting “fewer than 3” a problem and a
Common mistakes
40% of club members, so P(club and tango) = 0.4 × 0.08 = 0.032
Oct 2021 · Paper 3 (Statistics) · Q1(d)2 marksMedium
Mark scheme (whole question; this part is marked with the orange bar)
Examiner's comment
correct binomial distribution in part (d) though some found interpreting “fewer than 3” a problem and a ). Overall though this proved a good start to the paper common incorrect answer was 0.924 (from P( X 3 and over 40% scored 6 or 7 marks here.
Common mistakes
new model B(50, 0.032) using (c)
fewer than 3 means P(T ≤ 2) = 0.785, not P(T ≤ 3) = 0.924
Oct 2021 · Paper 3 (Statistics) · Q4(c)4 marksEasy
Mark scheme (whole question; this part is marked with the orange bar)
Examiner's comment
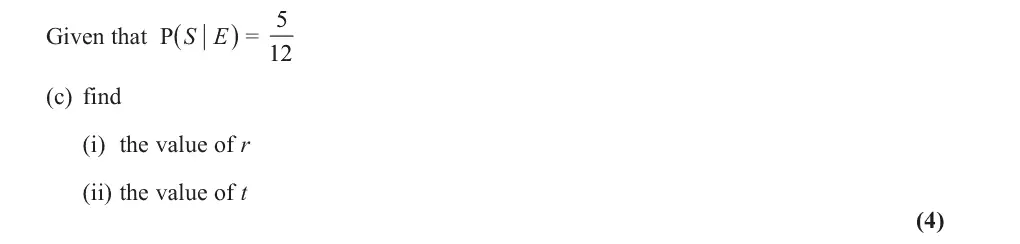
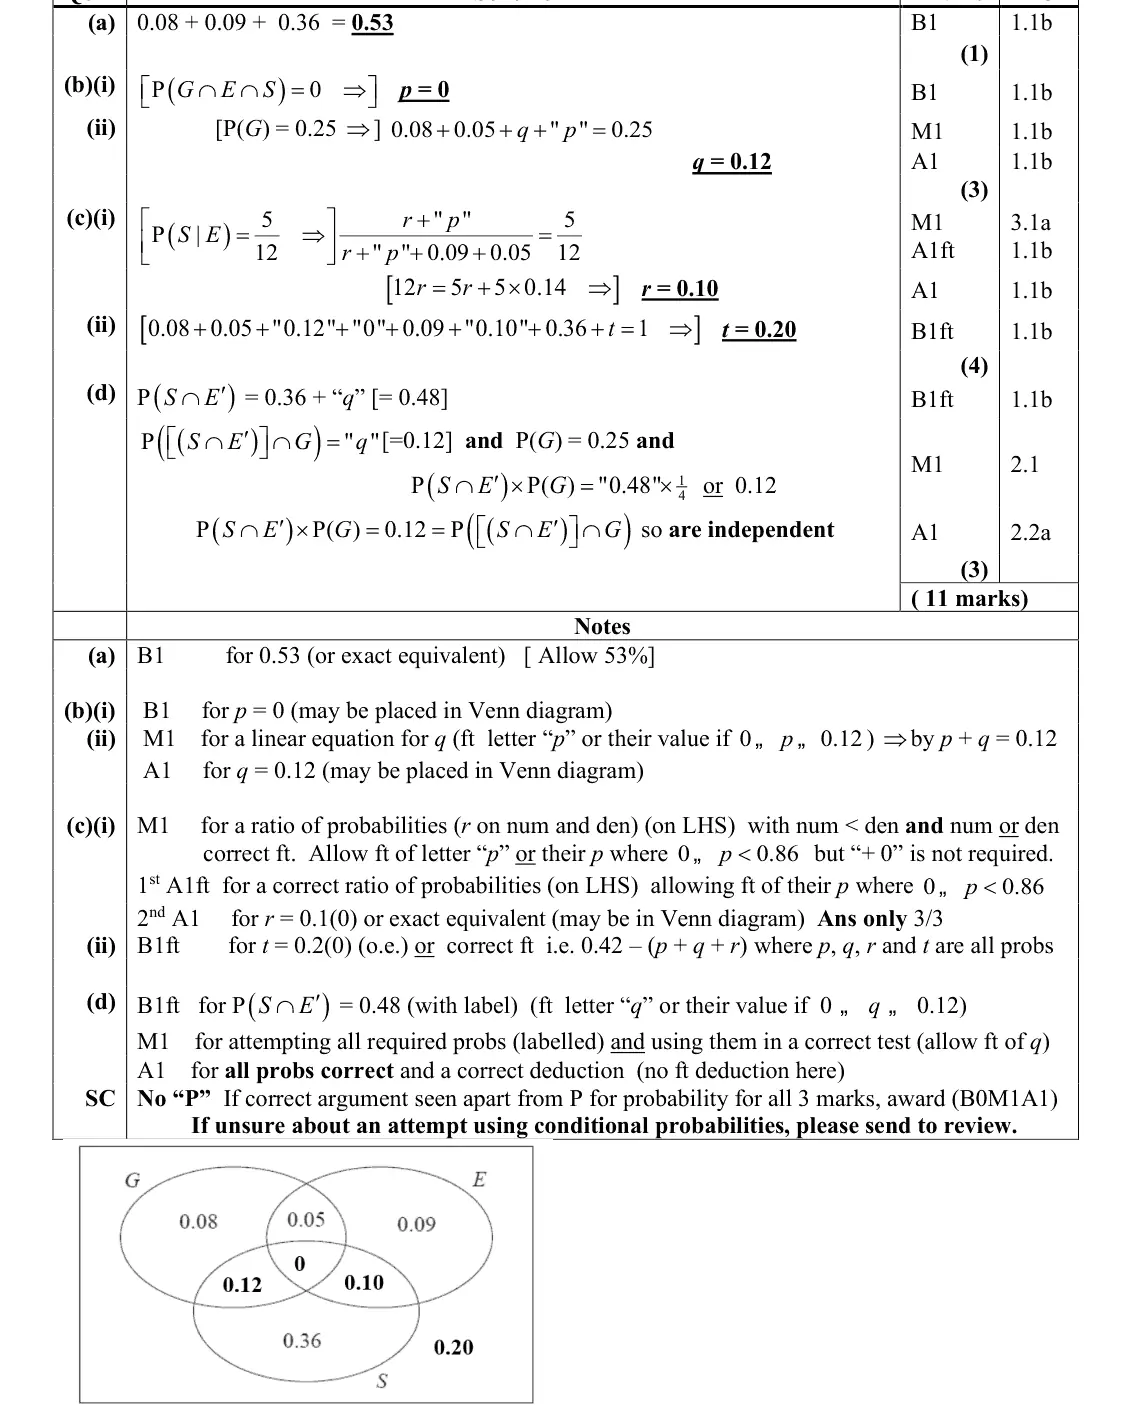
This proved to be a good source of marks for most candidates with only 2% failing to score and over 18% The conditional probability in part (c) proved to be a challenge for some; there were those who effectively used P(E | S) and others were miscopying values from their Venn diagram. Those who failed to make any progress in (i) were often able to pick up a mark for a correct follow through when finding the value of t.
Common mistakes
P(S given E) = (r + p)/(r + p + 0.09 + 0.05) = 5/12 gives r = 0.10
not P(E given S)
total probability 1 gives t = 0.20
Oct 2021 · Paper 3 (Statistics) · Q5(c)4 marks
Mark scheme (whole question; this part is marked with the orange bar)
Examiner's comment
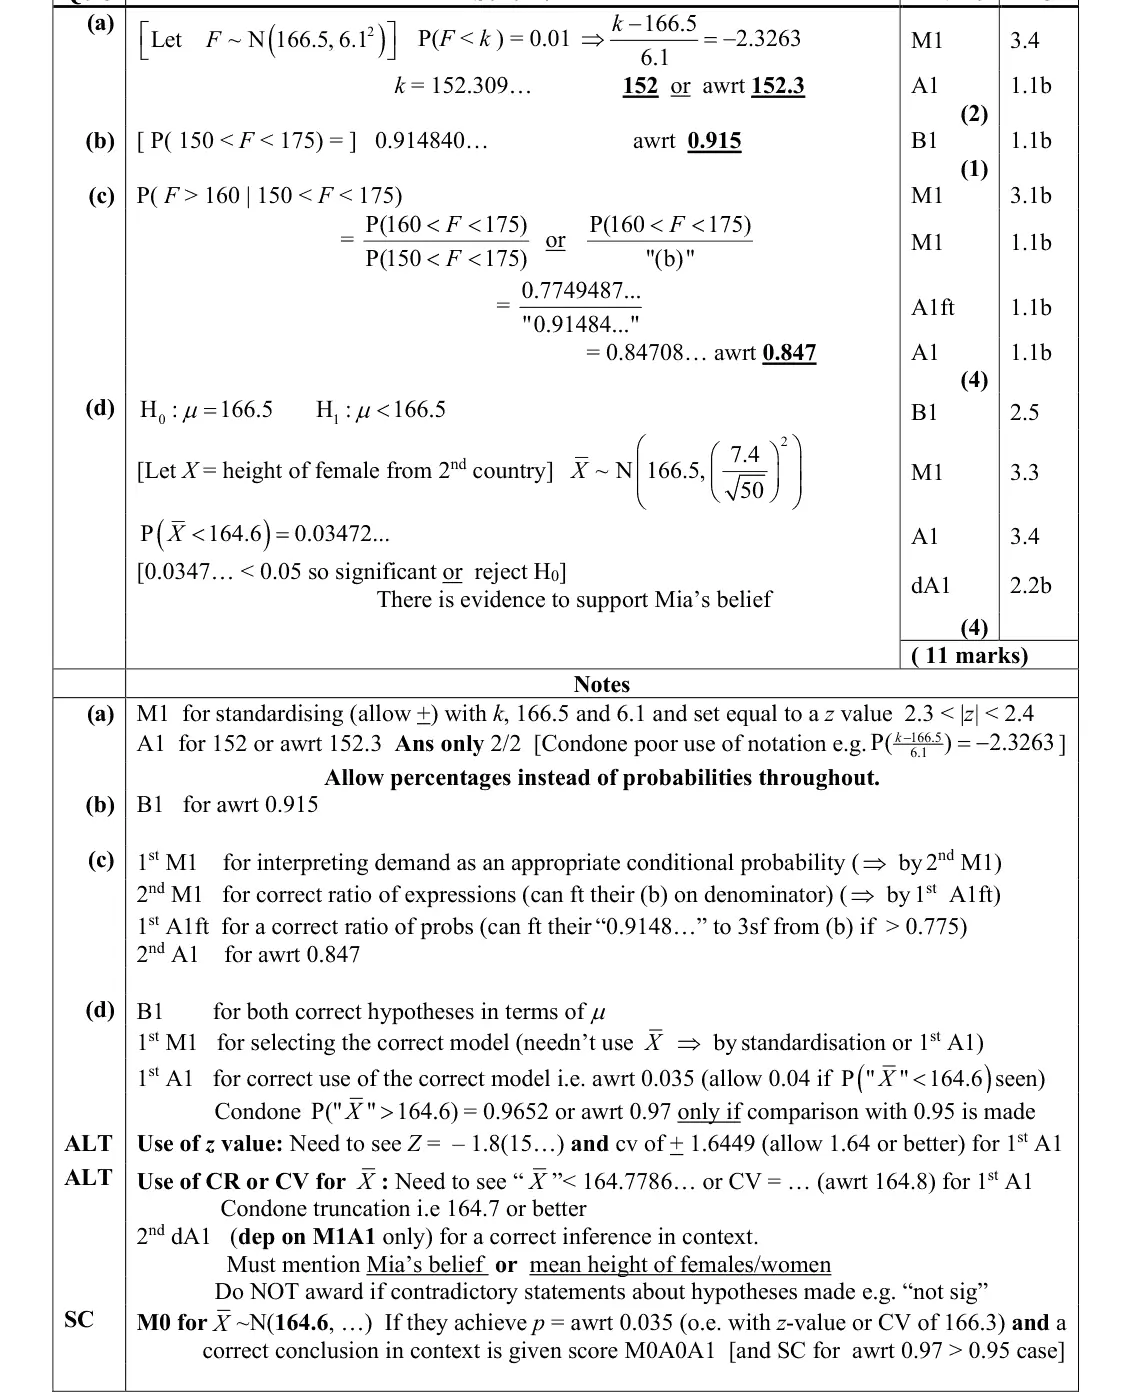
this question. Identifying the conditional probability in part (c) defeated many students and some of those who seemed to be attempting to use a conditional probability were unable to use the correct notation to write their expression. Those who did start with a correct conditional probability and moved onto a ratio of probabilities often had a correct denominator but a common error was to have P(F > 160) as the numerator rather than P(160 < F < 175). Part (d) was a familiar hypothesis test and many students scored something
Common mistakes
conditional: P(F > 160 given 150 < F < 175) = P(160 < F < 175)/P(150 < F < 175)
numerator is not P(F > 160)
0.847
Oct 2020 · Paper 3 (Statistics) · Q1(d)4 marks
Mark scheme (whole question; this part is marked with the orange bar)
Examiner's comment
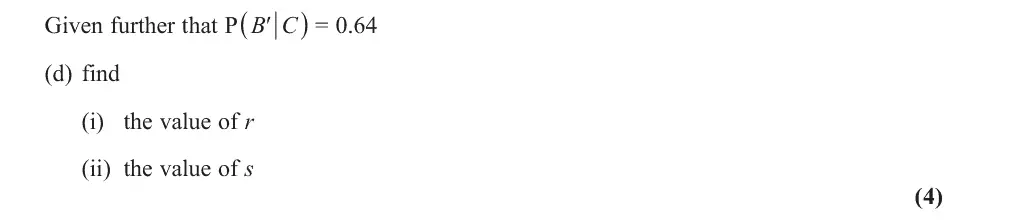
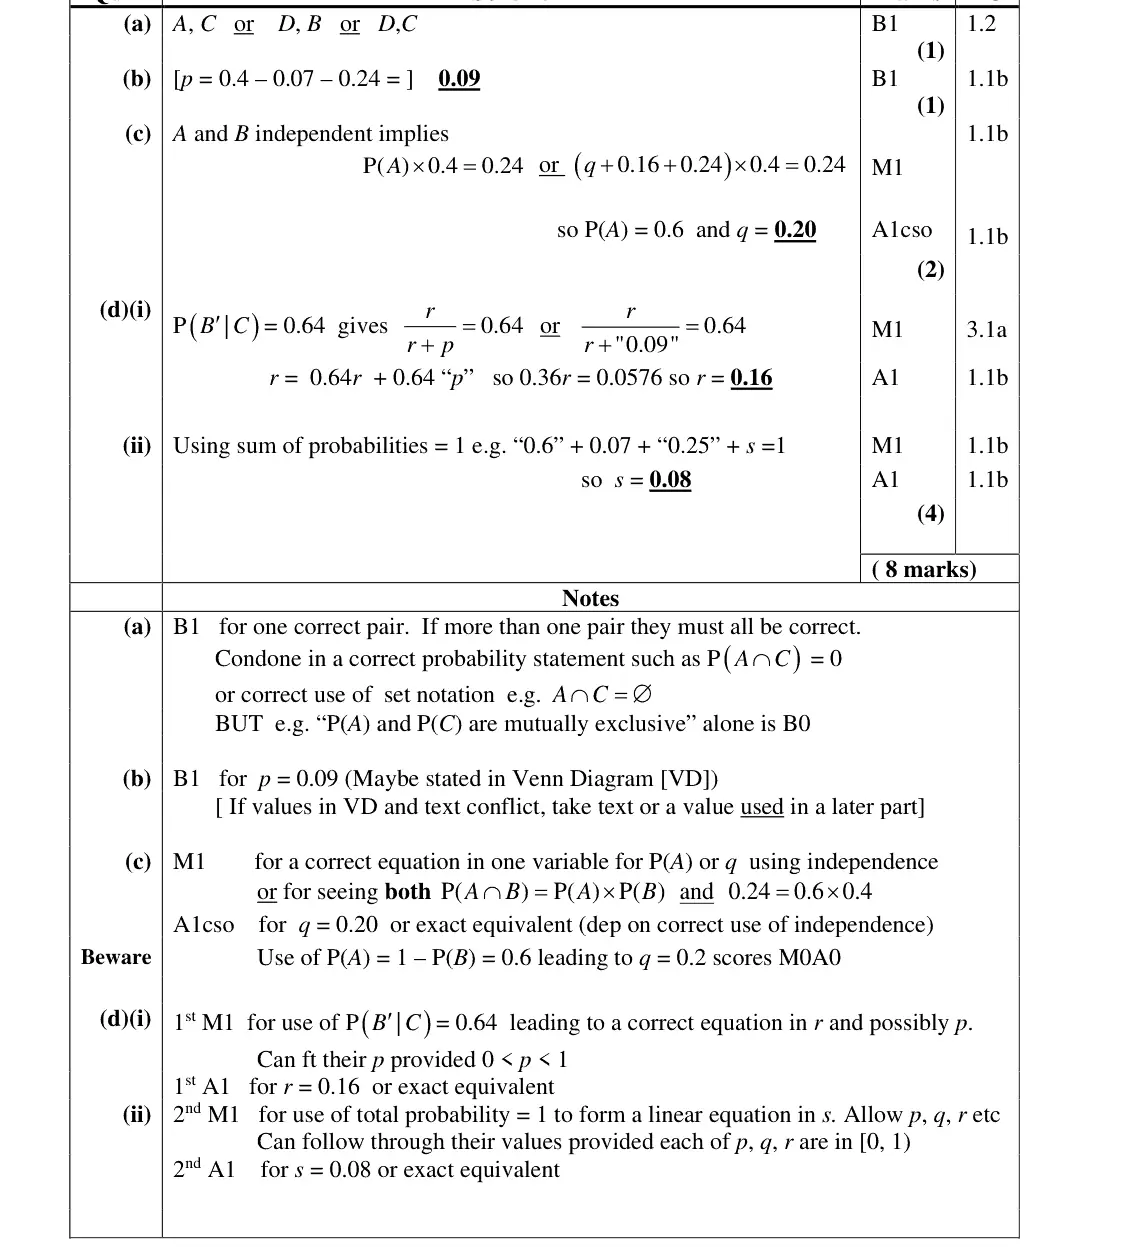
This proved to be a popular start to the paper with over 35% of students scoring full 0.6 or write down a suitable equation for q which was then solved correctly. Part (d) was more challenging as many could not use the given conditional probability correctly to obtain an equation for r but most knew how to use this answer to find s and were able to gain at least one mark in this part.
Common mistakes
P(B′ given C) = r/(r + p) = 0.64 gives r = 0.16 (many could not form this equation)
total probability 1 gives s = 0.08
Oct 2020 · Paper 3 (Statistics) · Q5(c)(ii)3 marksMedium
Mark scheme (whole question; this part is marked with the orange bar)
Examiner's comment
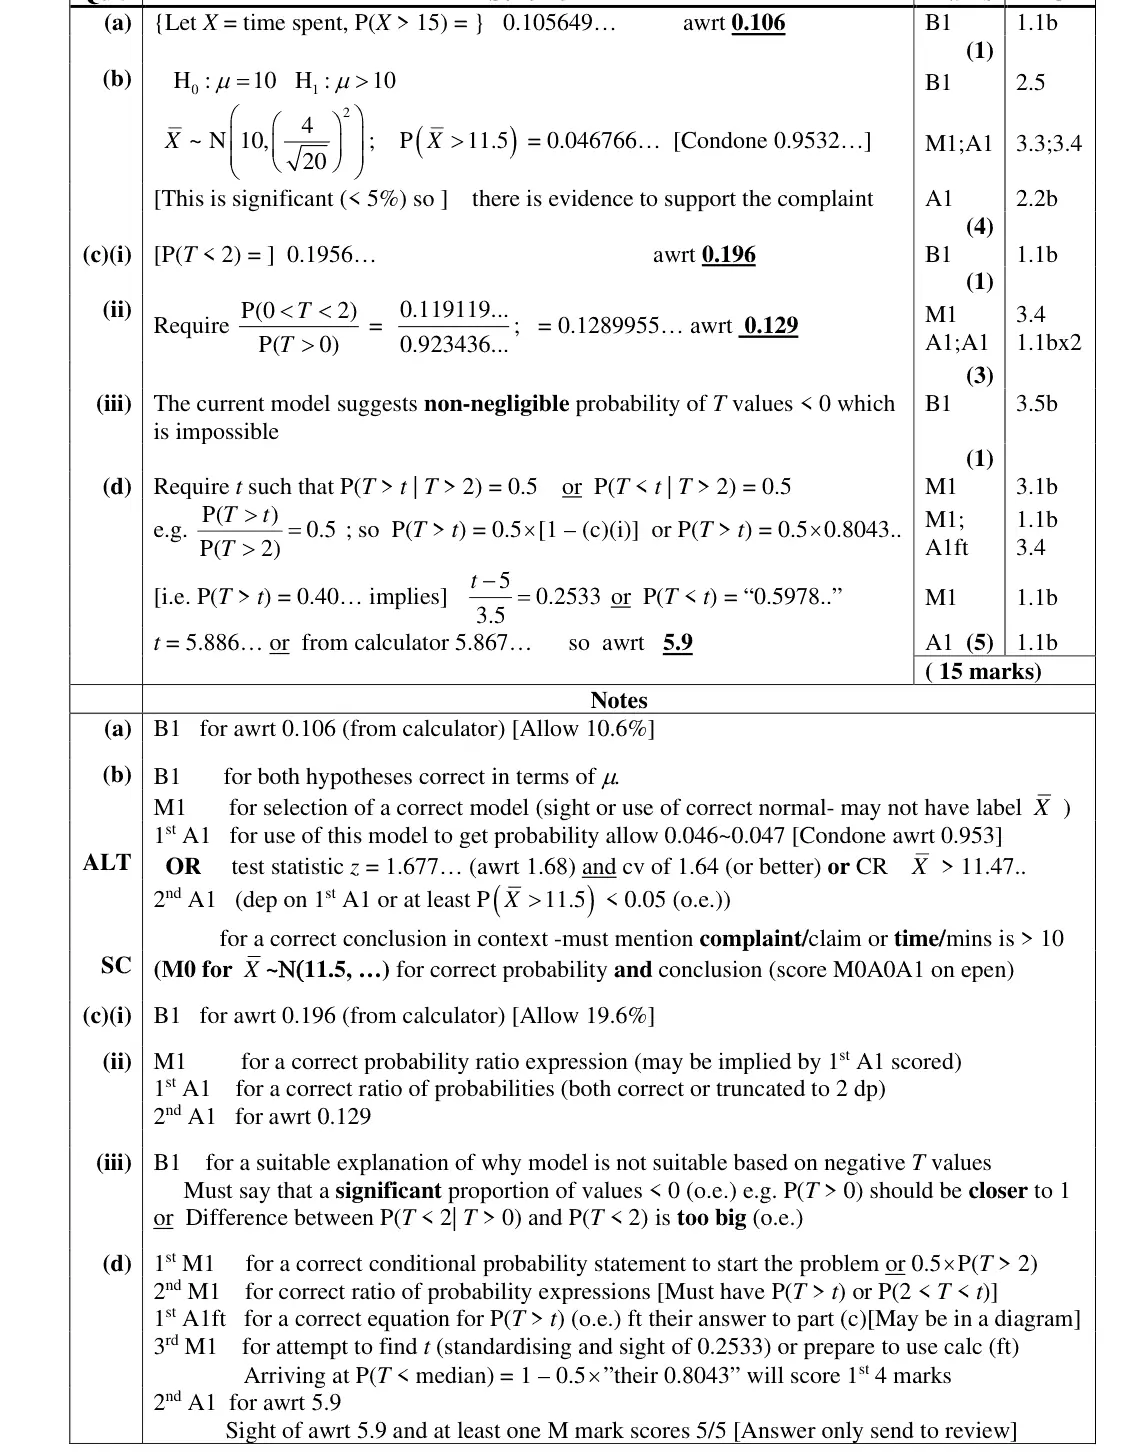
It was disappointing that over 20% of candidates scored no marks here as there were some straightforward marks available to those who had studied this part of the In (c)(ii) although a good number of students recognised that a conditional probability was required, few could find a correct expression for the numerator and a common error (c)(i) was to see used rather than a correct numerator of P(0 < T < 2). In part (iii) P( 0) T > many realised that the model would assign some probability to negative values of T but this will always be true when a normal distribution is used as a model. The point here was that a significant proportion of the values for T were negative and so this means that the normal model is not very good. Most responses seemed to believe that a model must match reality exactly but a few did comment that P(T > 0) should be closer to 1 or that the difference between (i) and (ii) was too big and therefore the model was not a good one to use. Fully correct answers to part (d) were rare and this part gave the A* students an
Common mistakes
numerator is P(0 < T < 2), not P(T < 2)
divide by P(T > 0) = 0.923
0.129
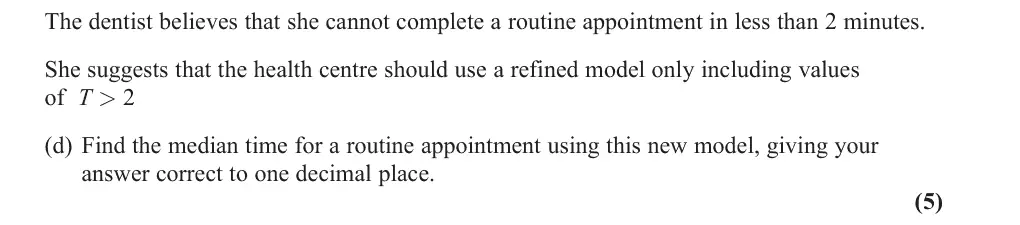
Oct 2020 · Paper 3 (Statistics) · Q5(d)5 marksMedium
Mark scheme (whole question; this part is marked with the orange bar)
Examiner's comment
It was disappointing that over 20% of candidates scored no marks here as there were some straightforward marks available to those who had studied this part of the Fully correct answers to part (d) were rare and this part gave the A* students an opportunity to shine. Successful students realised that they needed to look at P(T > 2) and often found this by taking 1 – (c)(i) but they rarely realised that the median splits this probability into 2 so they were seeking the value of t such that P(T > t) = 0.40…Some who reached this stage tried, incorrectly to use their calculator, failing to realise that their calculator gave t for probabilities of the form P(T < t), a few used the tables provided to find z = 0.2533 and some did prepare correctly to use their calculator and found P(T < t ) = 0.5978… (the 0.402… + (c)(i)) from whence the correct value of t = 5.9 could be found. It was encouraging to see some good use of diagrams in this question being used to help students identify which probabilities they needed.
Common mistakes
need P(T > t given T > 2) = 0.5, so P(T > t) = 0.5 × 0.8043 = 0.402
the calculator gives P(T < t), so use P(T < t) = 0.598 or z = 0.2533
median 5.9
June 2019 · AS Paper 2 (Statistics) · Q25 marksMedium
Mark scheme (whole question; this part is marked with the orange bar)
Examiner's comment
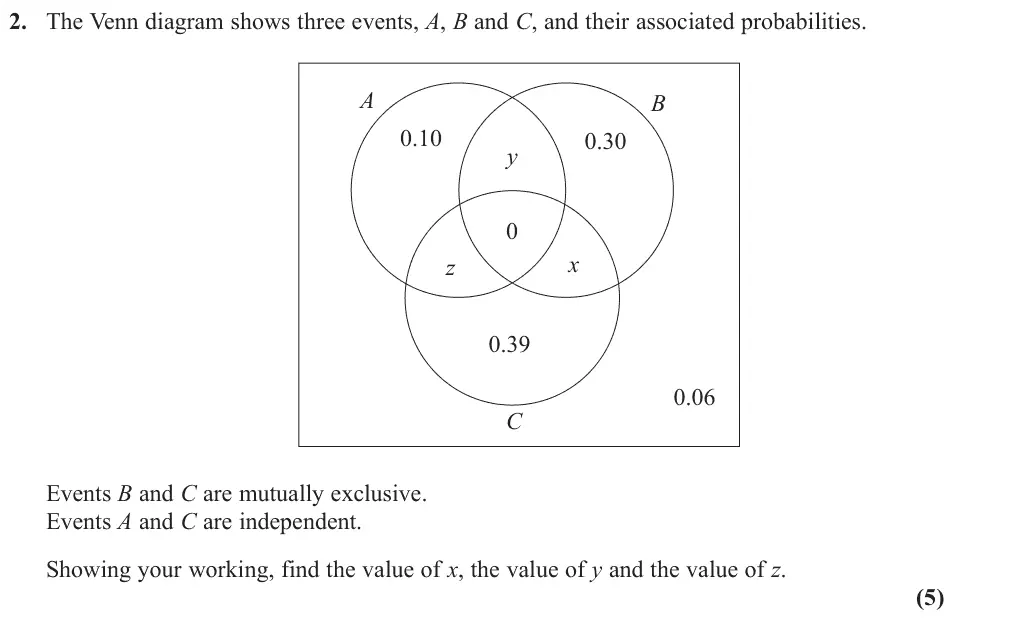
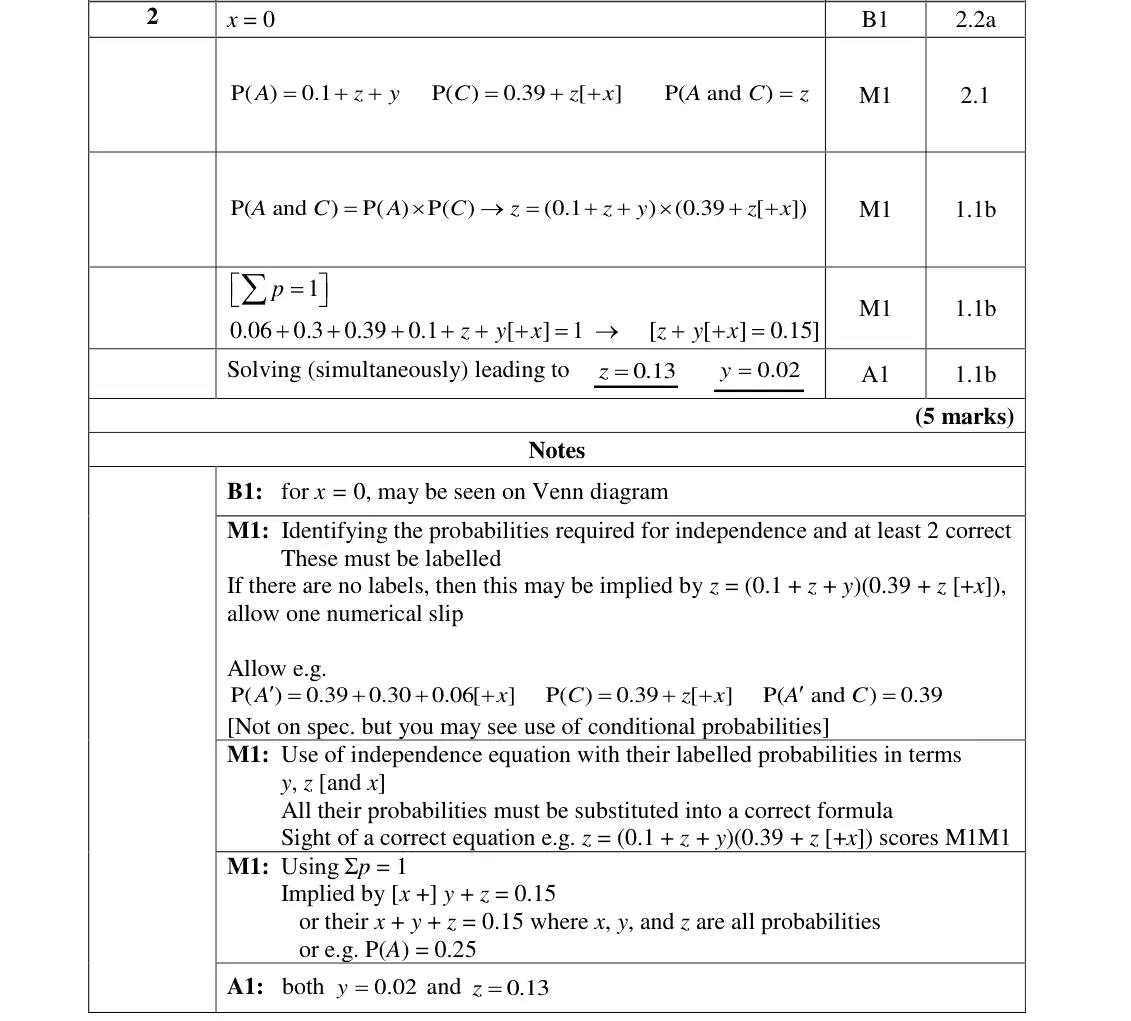
Only around 10% of candidates achieved full marks on this question, but there were many strong attempts made. Most scored the first mark for identifying that x = 0. The most common error across the question was to ignore the intersections and calculate P(A) x P(C) as 0.1 x 0.39. The majority of candidates scored the final method mark for a correct equation in y and z, demonstrating knowledge of probabilities summing to 1. Surprisingly, of candidates who did set up all of the equations required, many were unable to manipulate the algebra to solve them. Those who confused independent and mutually exclusive events tended to make no progress.
Common mistakes
B and C mutually exclusive so x = 0
independence: P(A ∩ C) = P(A) × P(C) with P(A) = 0.1 + y + z and P(C) = 0.39 + z (not 0.1 × 0.39 using only the outer regions)
probabilities sum to 1 gives y + z = 0.15
z = 0.13, y = 0.02
June 2019 · Paper 3 (Statistics) · Q1(a)2 marksMedium
Mark scheme (whole question; this part is marked with the orange bar)
Examiner's comment
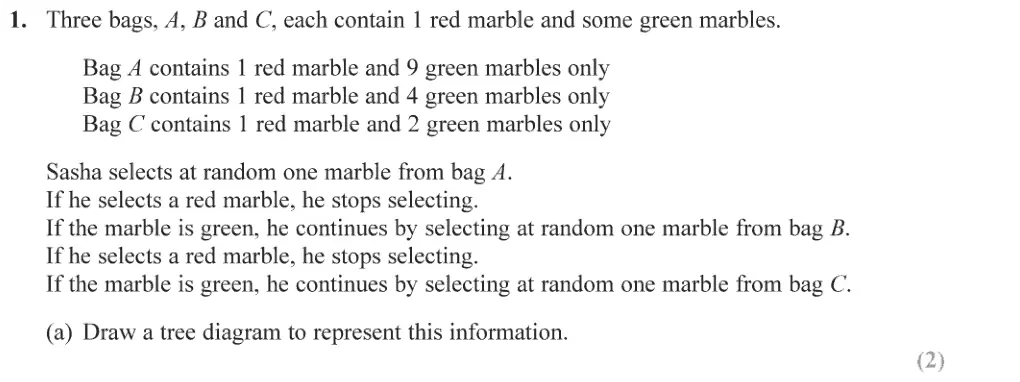
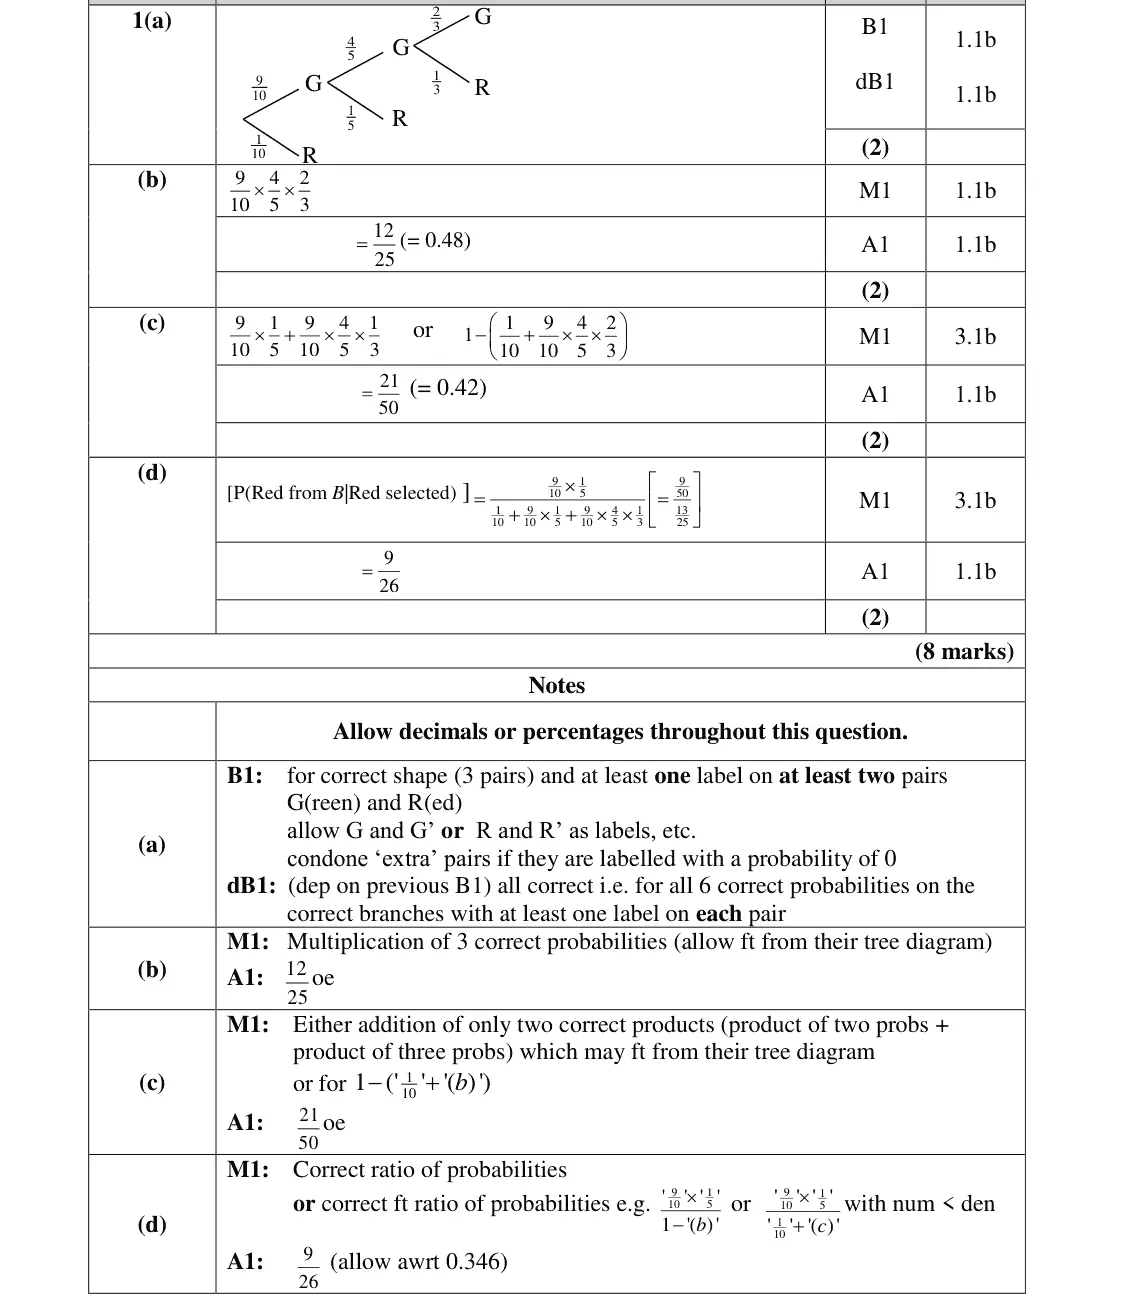
On the whole, this accessible question was answered very well by majority of candidates with nearly 40% going on to achieve full marks. Most were able to draw the correct tree diagram in part (a) and label both outcomes and probabilities clearly. However, a number of candidates made mistakes due to deciding Bag A contained only 9 marbles, B contained 4 marbles and C contained 2 marbles. Some candidates attempted a 3 branch tree diagram and made little progress. Others thought that the successive draws from Bag C could take place. All branches must be labelled as blank branches are not assumed to represent a probability of 0.
Common mistakes
3 pairs of branches only (stop after red), probabilities 1/10, 9/10
1/5, 4/5
1/3, 2/3
bags hold 10, 5 and 3 marbles (not 9, 4, 2)
every branch labelled
June 2019 · Paper 3 (Statistics) · Q1(b)2 marksMedium
Mark scheme (whole question; this part is marked with the orange bar)
Examiner's comment
On the whole, this accessible question was answered very well by majority of candidates with nearly 40% going on to achieve full marks. Most were able to draw the correct tree diagram in Part (b) was almost universally answered correctly, even if the tree diagram was incorrect, with the majority of candidates gaining full marks or at least follow through marks, although occasionally the three probabilities were added rather than multiplied together. Many correct responses were seen in part (c) with the majority of candidates gaining full marks
Common mistakes
9/10 × 4/5 × 2/3 = 12/25
multiply, do not add
June 2019 · Paper 3 (Statistics) · Q1(c)2 marksMedium
Mark scheme (whole question; this part is marked with the orange bar)
Examiner's comment
On the whole, this accessible question was answered very well by majority of candidates with nearly 40% going on to achieve full marks. Most were able to draw the correct tree diagram in Many correct responses were seen in part (c) with the majority of candidates gaining full marks or at least follow through marks for the method. The most common error was the inclusion of 0.1 for P(red) in addition to the two correct products, perhaps indicating that the candidates failed to interpret ‘at least’ correctly.
including 1/10 (red only) is wrong – misreading "at least"
June 2019 · Paper 3 (Statistics) · Q1(d)2 marksMedium
Mark scheme (whole question; this part is marked with the orange bar)
Examiner's comment
On the whole, this accessible question was answered very well by majority of candidates with nearly 40% going on to achieve full marks. Most were able to draw the correct tree diagram in Part (d) was somewhat less successfully answered. Many candidates were unable to recognise 9 1 that this involved conditional probability, with the most common wrong answer of 5 often 10 x seen. A small number had the conditional probability the wrong way round, attempting to find P(R|B) instead of P(B|R).
Common mistakes
P(B and R)/P(R) = (9/50)/(13/25) = 9/26
common error 9/10 × 1/5 with no division
not P(R given B)
June 2018 · Paper 3 · Q5(b)5 marks
Mark scheme (whole question; this part is marked with the orange bar)
Examiner's comment
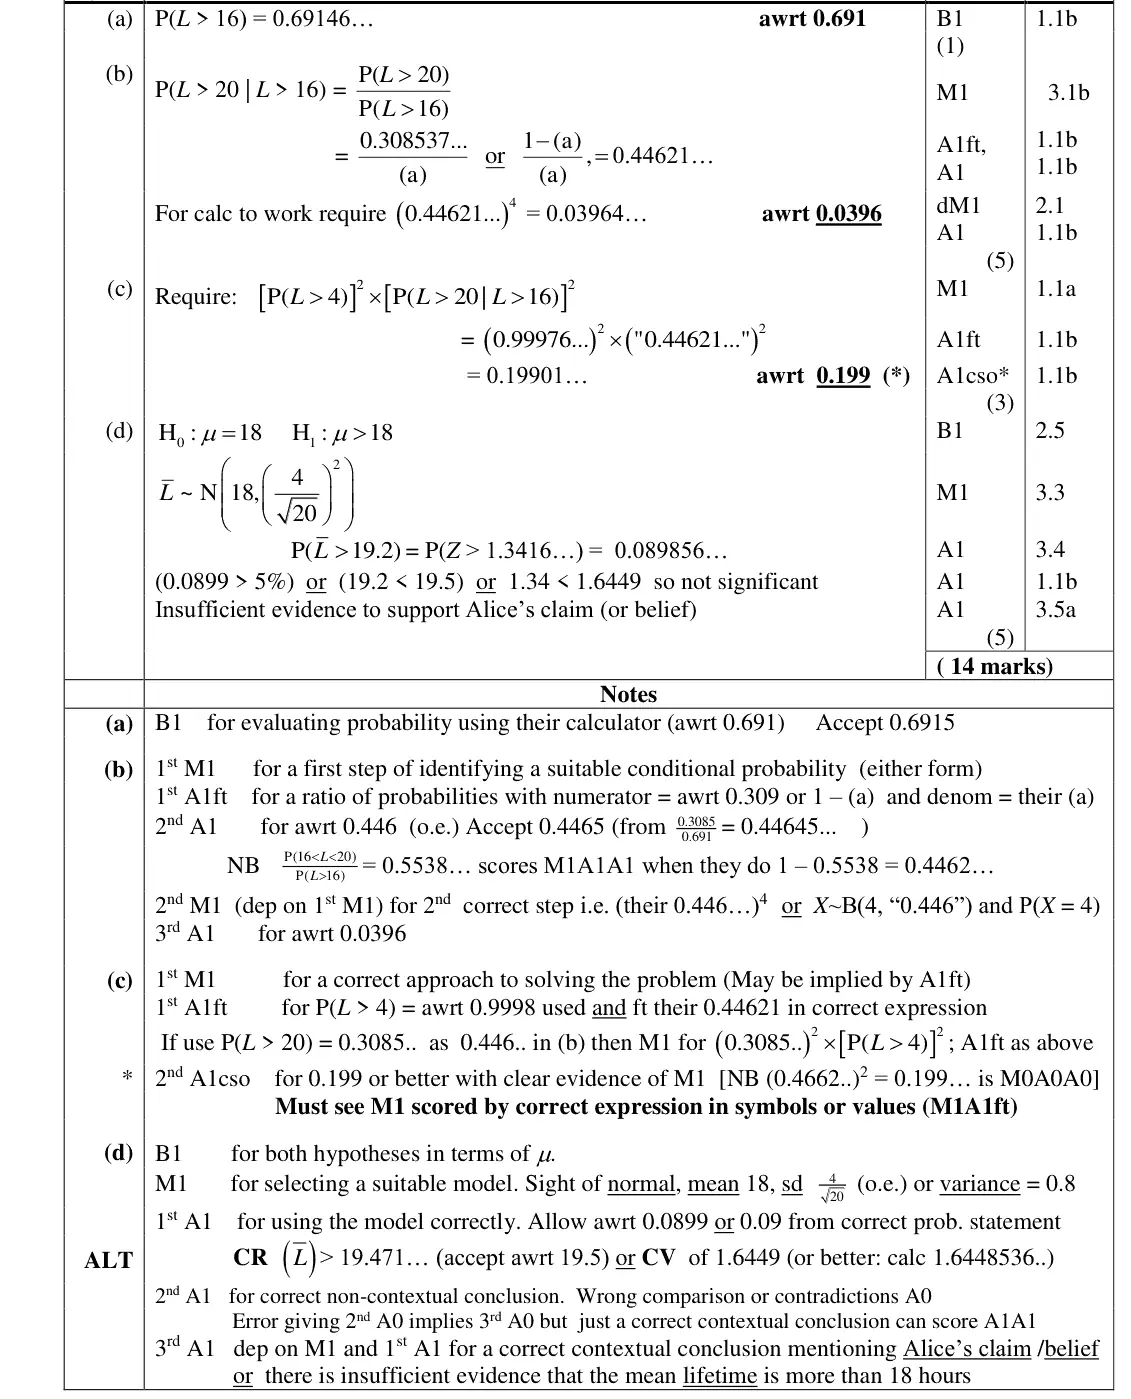
Whilst parts (a) and (d) were often answered well, parts (b) and (c) proved much more challenging and only the strongest 10% made significant progress here. Part (a) was answered well and most identified that a conditional probability was required in part (b) were often able to make progress, often obtaining the probability of 0.4462 and using that correctly to complete part (b) and make progress in (c).
Common mistakes
conditional probability P(L > 20 given L > 16) = 0.3085/0.6915 = 0.446
then all 4 batteries independent: 0.446⁴ = 0.0396
many missed the conditional step
June 2018 · Paper 3 · Q5(c)3 marks
Mark scheme (whole question; this part is marked with the orange bar)
Examiner's comment
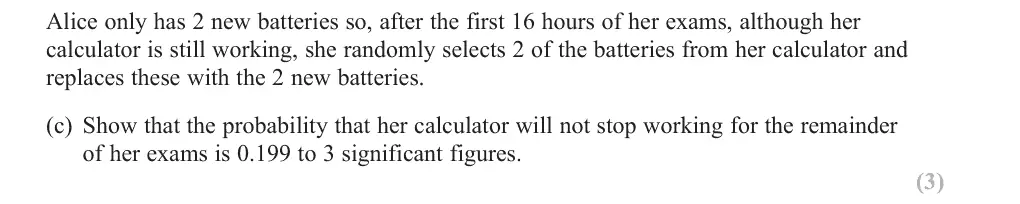
Whilst parts (a) and (d) were often answered well, parts (b) and (c) proved much more challenging and only the strongest 10% made significant progress here. Part (a) was answered well and most progress in (c). In part (c), some simply squared their probability of 0.4462 without realising the need to consider the two new batteries as well. Part (d) was often answered quite well with many stating the hypotheses
Common mistakes
two new batteries need P(L > 4)² = 0.9998² and two old ones 0.446²
squaring 0.446 alone is M0
correct expression must be seen for the given answer
Find an Edexcel maths tutor
Stuck on this? Book a trial session with an Edexcel specialist.