June 2024: AS AS Paper 2 Section A: Statistics

30 marks · 13 question parts · Question paper, mark scheme and examiner's report on Pearson's site

Question by question

QTopicMarksDifficulty
1 Data presentation: histograms, box plots, measures and outliers 4 —
2(a) Data presentation: histograms, box plots, measures and outliers, The large data set 1 —
2(b) Data presentation: histograms, box plots, measures and outliers, The large data set 2 —
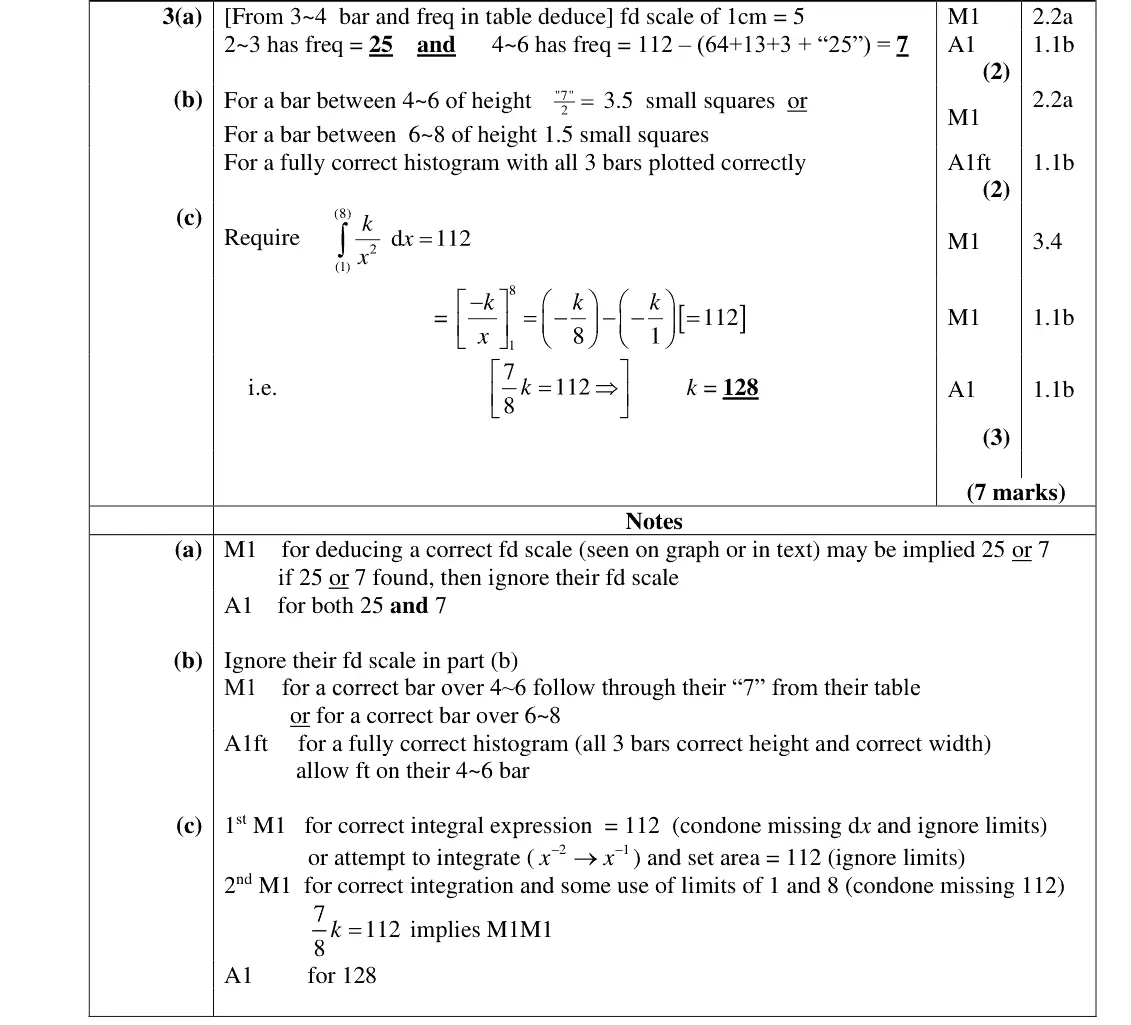
3(a) Data presentation: histograms, box plots, measures and outliers 2 —
3(b) Data presentation: histograms, box plots, measures and outliers 2 —
3(c) Data presentation: histograms, box plots, measures and outliers, Integration: standard integrals, definite integrals and areas 3 —
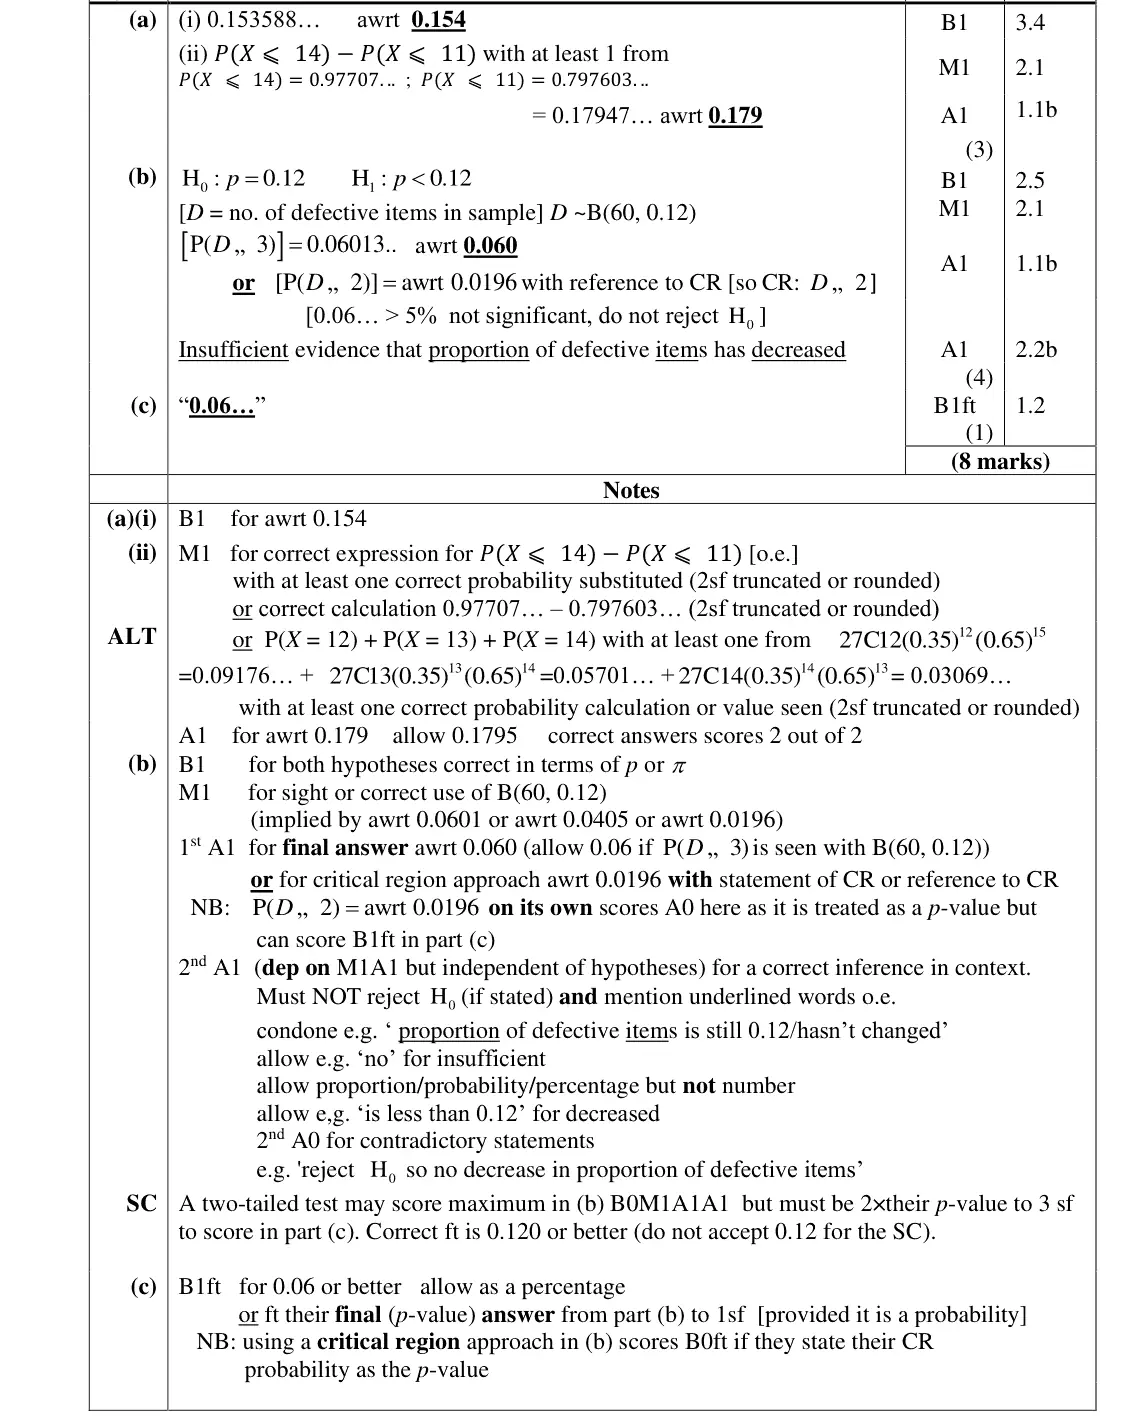
4(a) Discrete distributions and the binomial distribution 3 —
4(b) Hypothesis testing, Discrete distributions and the binomial distribution 4 —
4(c) Hypothesis testing 1 —
5(a) Discrete distributions and the binomial distribution 1 —
5(b) Probability, including conditional probability, Discrete distributions and the binomial distribution 2 —
5(c) Discrete distributions and the binomial distribution, Probability, including conditional probability 4 —
5(d) Probability, including conditional probability, Discrete distributions and the binomial distribution 1 —

The questions

12(a)2(b)3(a)3(b)3(c)4(a)4(b)4(c)5(a)5(b)5(c)5(d)
June 2024 · AS Paper 2 (Statistics) · Q1 4 marks data presentation
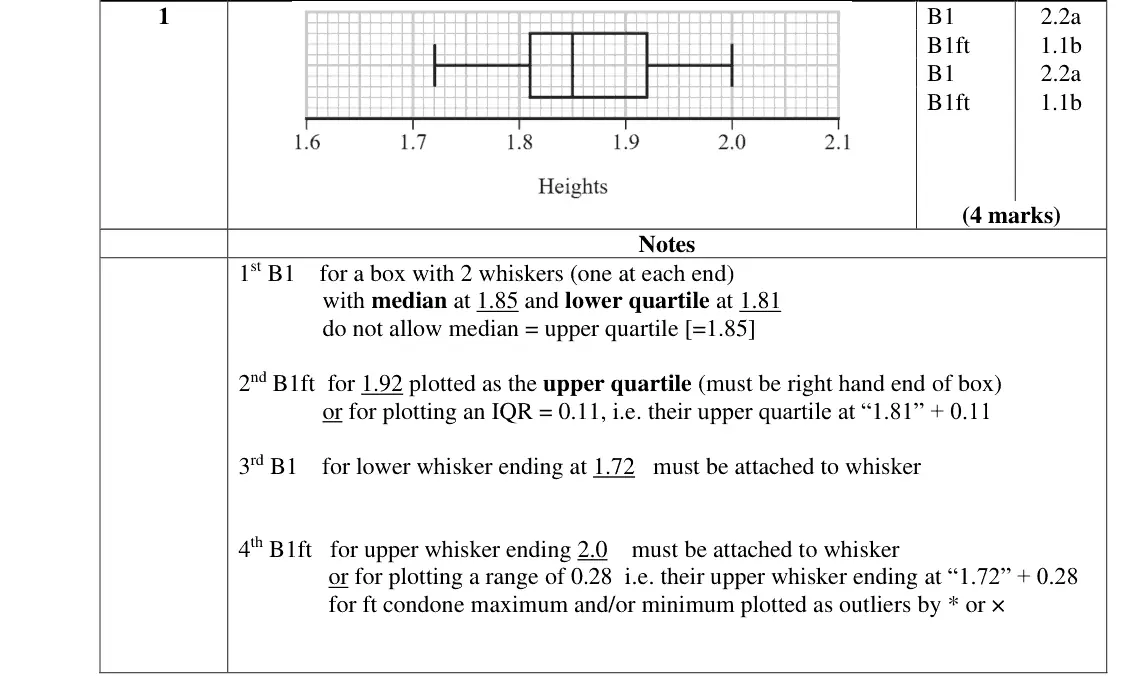
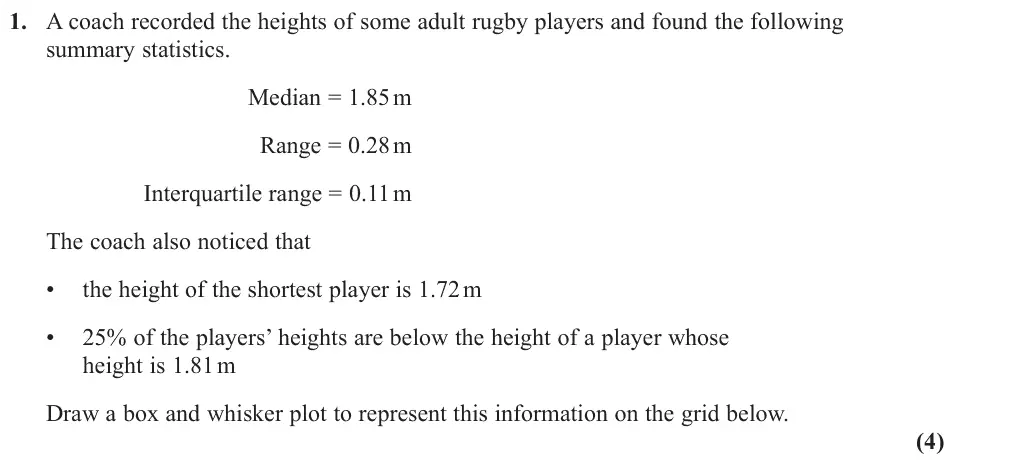
1. A coach recorded the heights of some adult rugby players and found the following summary statistics. % Median = 1.85 m % Range = 0.28 m % Interquartile range = 0.11 m The coach also noticed that • the height of the shortest player is 1.72 m • 25% of the players’ heights are below the height of a player whose height is 1.81 m Draw a box and whisker plot to represent this information on the grid below. (4)
June 2024 · AS Paper 2 (Statistics) · Q2(a) 1 mark data presentationlarge data set
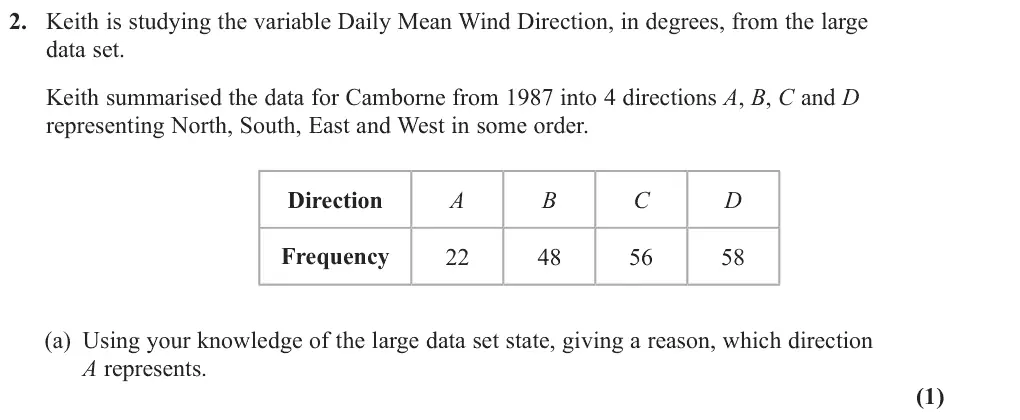
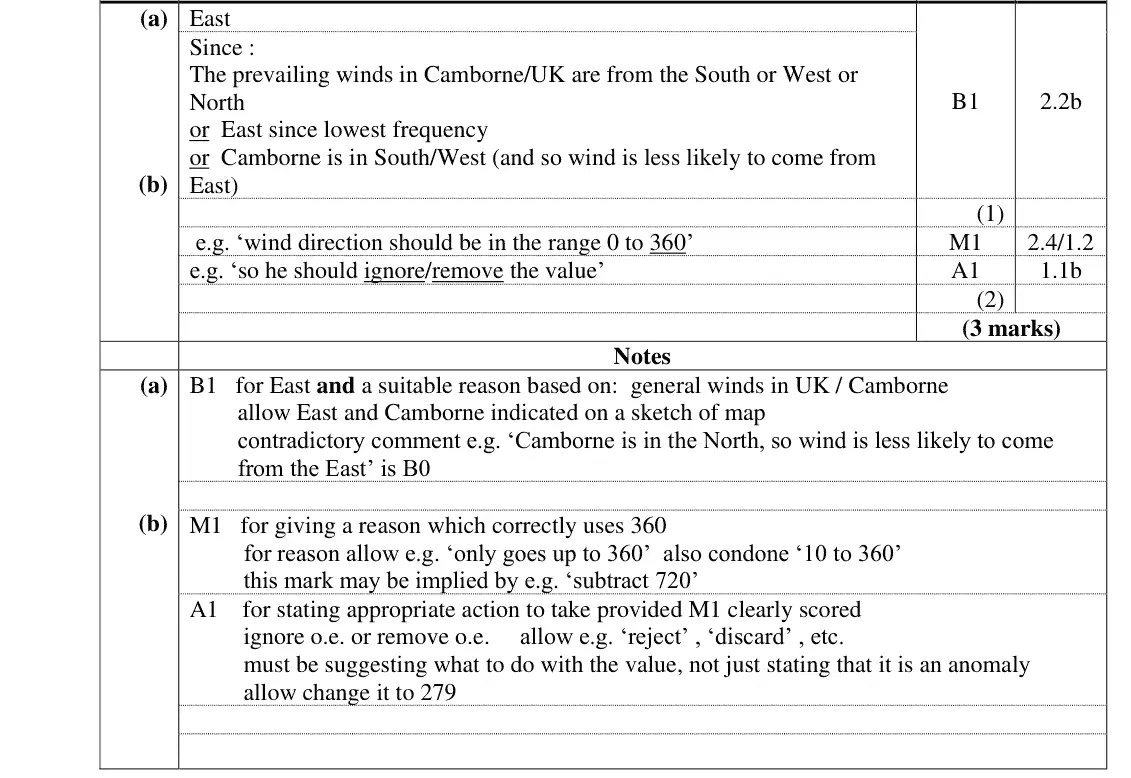
2. Keith is studying the variable Daily Mean Wind Direction, in degrees, from the large data set. Keith summarised the data for Camborne from 1987 into 4 directions A, B, C and D representing North, South, East and West in some order. Direction A B C Frequency (a) Using your knowledge of the large data set state, giving a reason, which direction A represents. (1)
June 2024 · AS Paper 2 (Statistics) · Q2(b) 2 marks data presentationlarge data set
The entry for Hurn on 27th September 1987 was 999 (b) State, giving a reason, what Keith should do with this value. (2)
June 2024 · AS Paper 2 (Statistics) · Q3(a) 2 marks data presentation
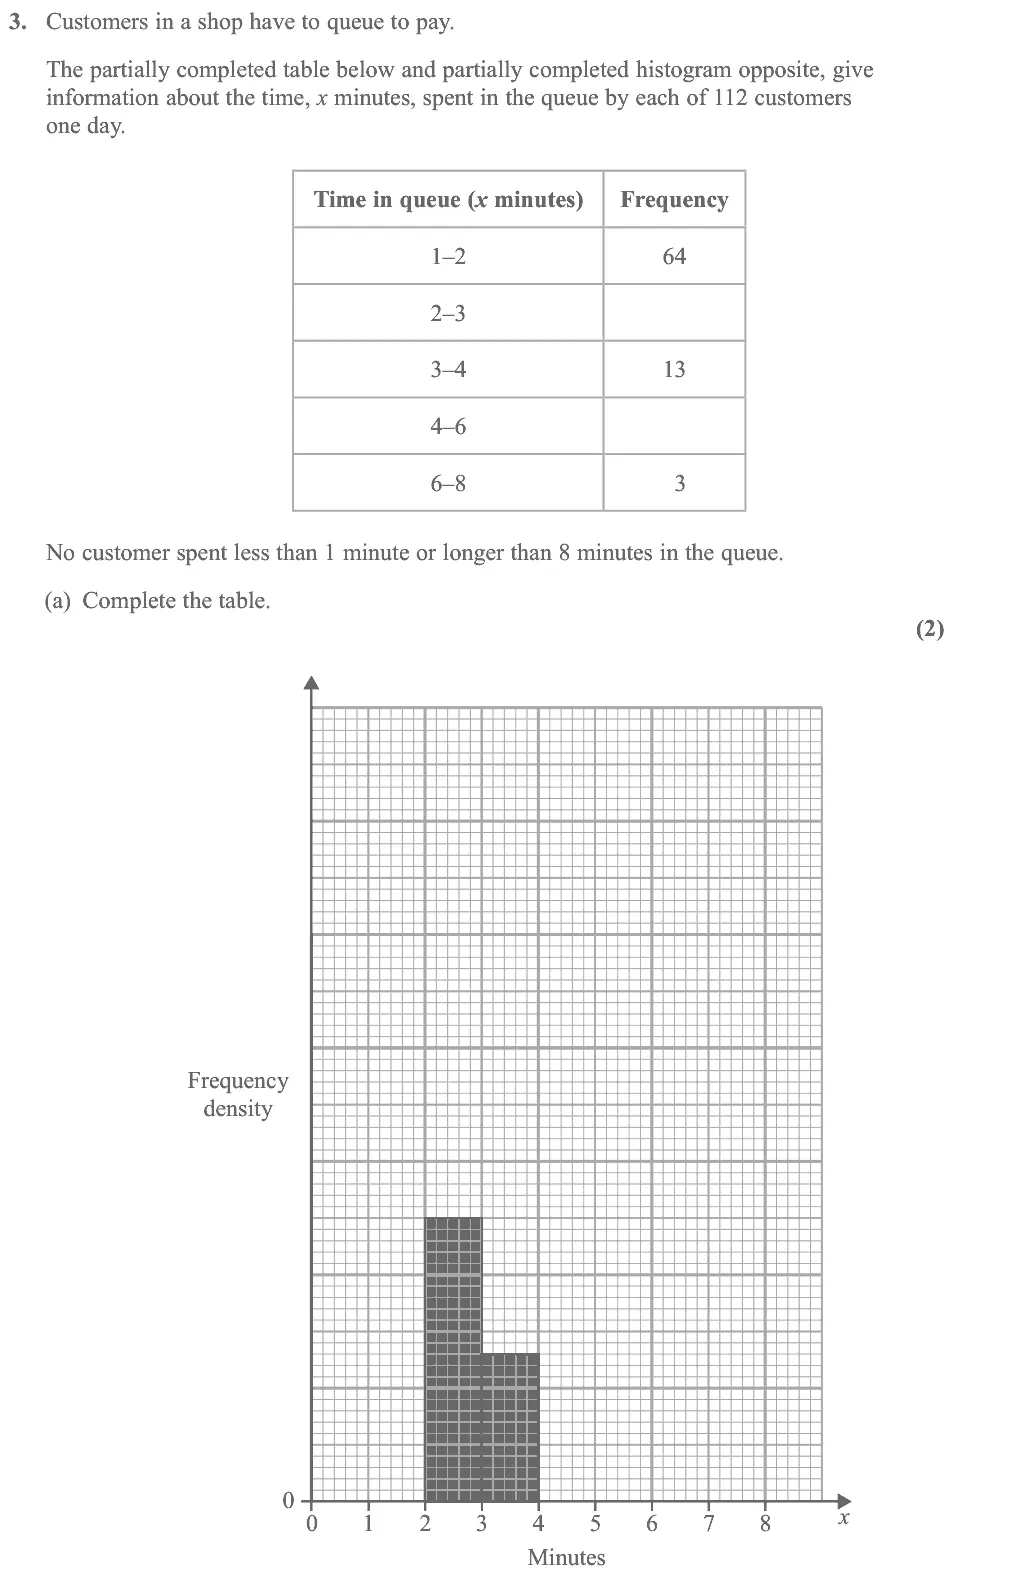
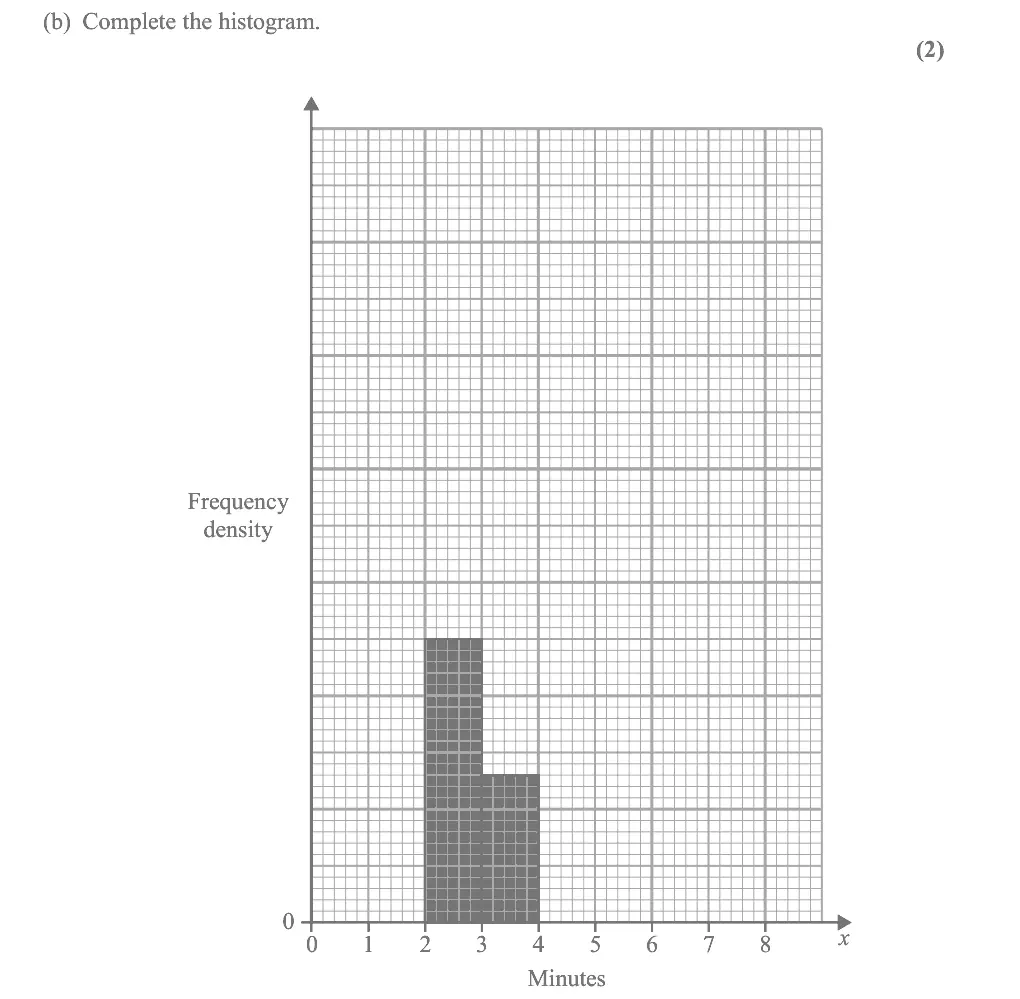
3. Customers in a shop have to queue to pay. The partially completed table below and partially completed histogram opposite, give information about the time, x minutes, spent in the queue by each of 112 customers one day. Time in queue (x minutes) Frequency 1–2 2–3 3–4 4–6 6–8 No customer spent less than 1 minute or longer than 8 minutes in the queue. (a) Complete the table. (2)
June 2024 · AS Paper 2 (Statistics) · Q3(b) 2 marks data presentation
(b) Complete the histogram. (2)
June 2024 · AS Paper 2 (Statistics) · Q3(c) 3 marks data presentationintegration
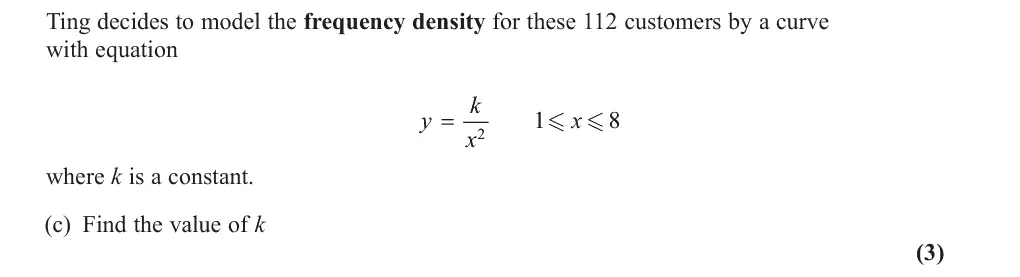
Ting decides to model the frequency density for these 112 customers by a curve with equation k y x = x where k is a constant. (c) Find the value of k (3)
June 2024 · AS Paper 2 (Statistics) · Q4(a) 3 marks binomial distribution
4. The random variable X ~ B(27, 0.35) (a) Find (i) P(X = 10) (ii) P(12 X < 15) (3)
June 2024 · AS Paper 2 (Statistics) · Q4(b) 4 marks hypothesis testingbinomial distribution
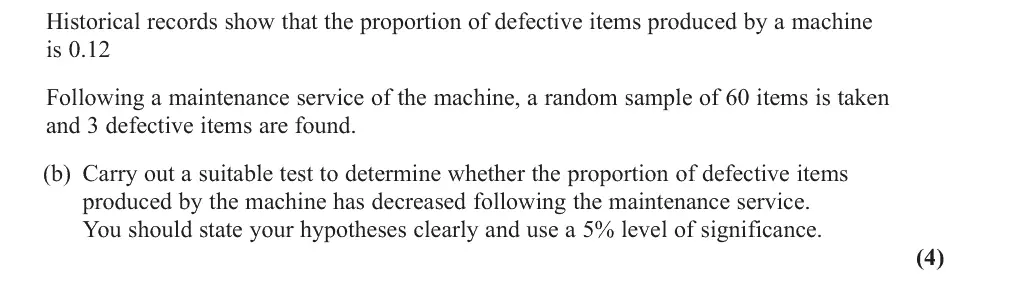
Historical records show that the proportion of defective items produced by a machine is 0.12 Following a maintenance service of the machine, a random sample of 60 items is taken and 3 defective items are found. (b) Carry out a suitable test to determine whether the proportion of defective items produced by the machine has decreased following the maintenance service. You should state your hypotheses clearly and use a 5% level of significance. (4)
June 2024 · AS Paper 2 (Statistics) · Q4(c) 1 mark hypothesis testing
(c) Write down the p-value for your test in part (b) (1)
June 2024 · AS Paper 2 (Statistics) · Q5(a) 1 mark binomial distribution
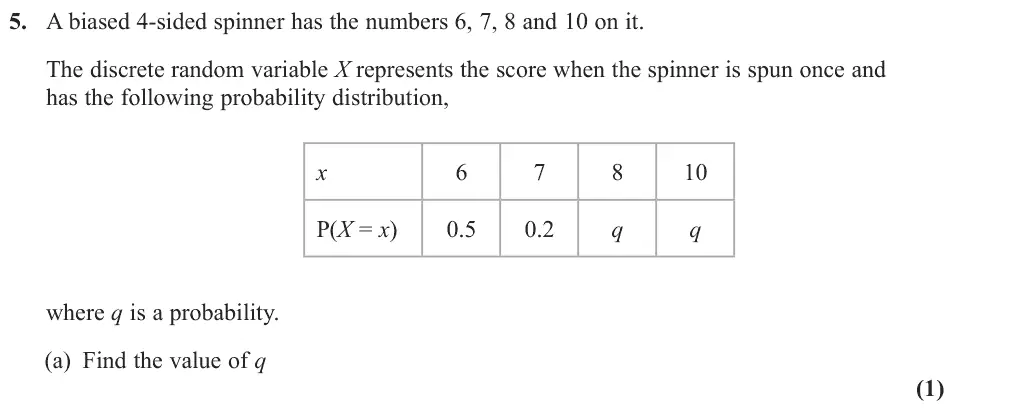
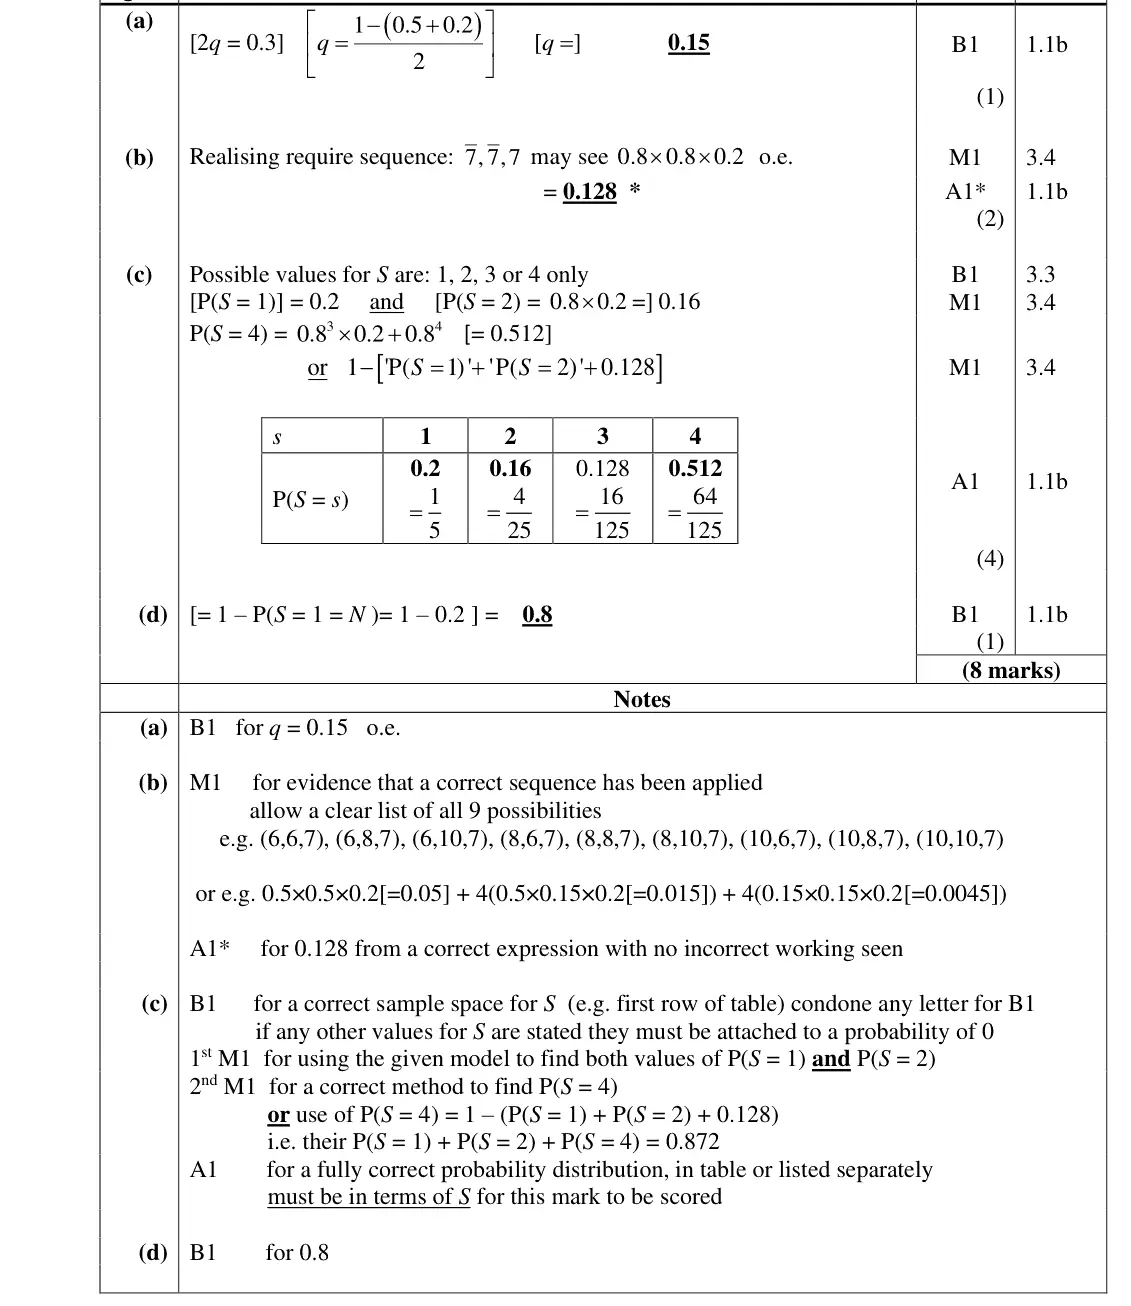
5. A biased 4-sided spinner has the numbers 6, 7, 8 and 10 on it. The discrete random variable X represents the score when the spinner is spun once and has the following probability distribution, x P(X = x) 0.5 0.2 q q where q is a probability. (a) Find the value of q (1)
June 2024 · AS Paper 2 (Statistics) · Q5(b) 2 marks probabilitybinomial distribution
Karen spins the spinner repeatedly until she either gets a 7 or she has taken 4 spins. (b) Show that the probability that Karen stops after taking her 3rd spin is 0.128 (2)
June 2024 · AS Paper 2 (Statistics) · Q5(c) 4 marks binomial distributionprobability
The random variable S represents the number of spins Karen takes. (c) Find the probability distribution for S (4)
June 2024 · AS Paper 2 (Statistics) · Q5(d) 1 mark probabilitybinomial distribution
The random variable N represents the number of times Karen gets a 7 (d) Find P(S > N) (1)

Find an Edexcel maths tutor

Want this paper marked and gone through with you? Message us.

Prefer email? Send an enquiry

If you are under 18, please include a parent's contact details. Enquiries go to enquiries@mathsaleveltutor.com and are deleted once handled.