Conduct a statistical hypothesis test for the proportion in the binomial distribution and interpret the results in context. Understand that a sample is being used to make an inference about the population and appreciate that the significance level is the probability of incorrectly rejecting the null hypothesis.
Guidance
Hypotheses should be expressed in terms of the population parameter p. A formal understanding of Type I errors is not expected.
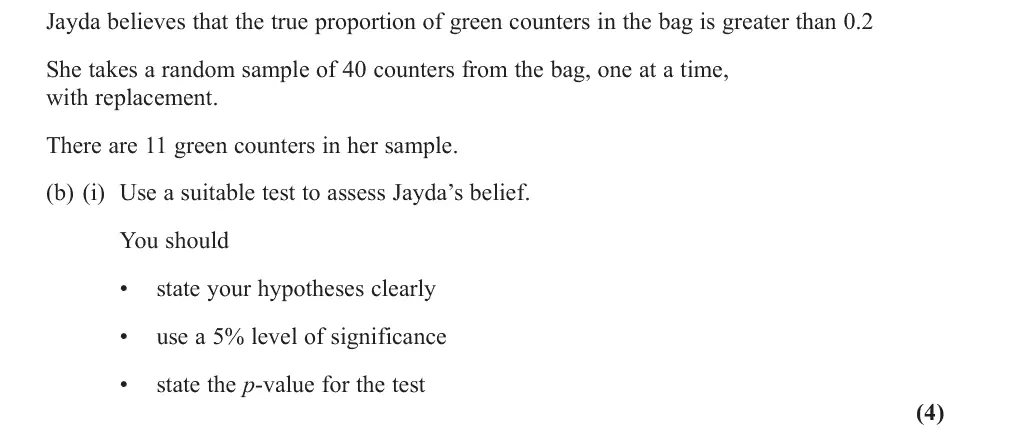
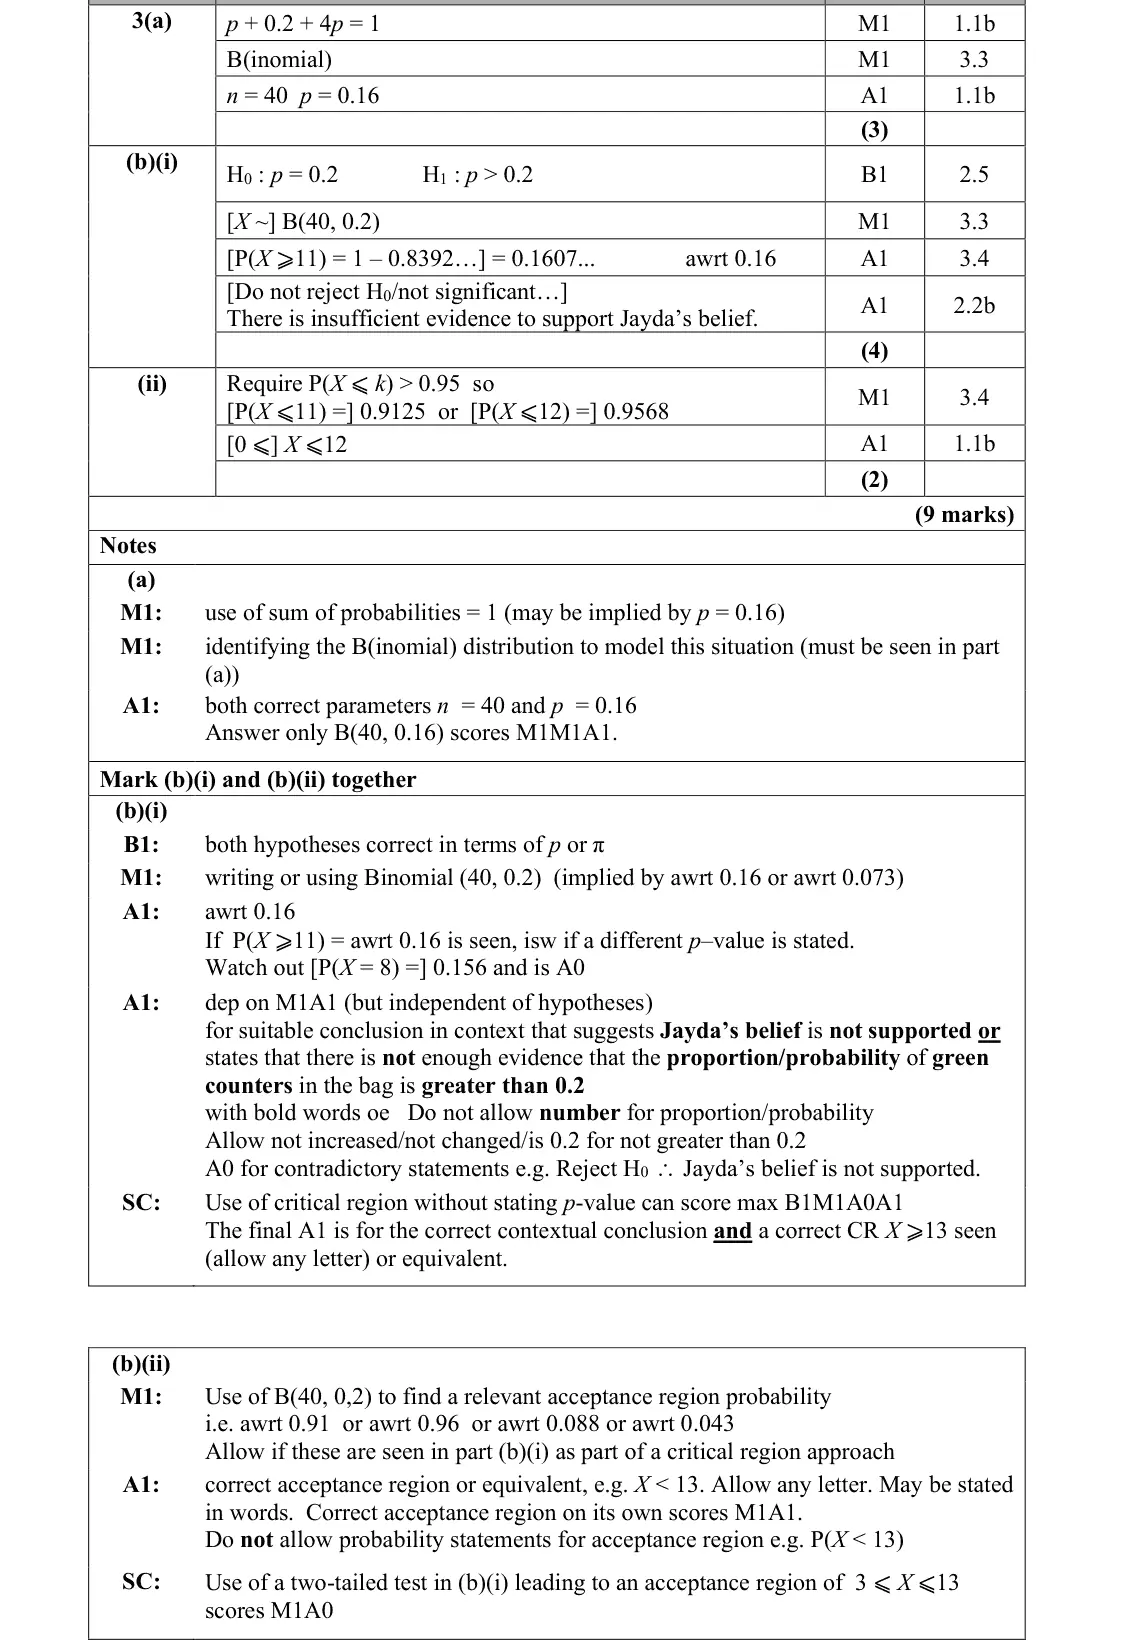
June 2025 · AS Paper 2 (Statistics) · Q3(b)(i)4 marks
Mark scheme (whole question; this part is marked with the orange bar)
Examiner's comment
In (b)(i) the hypotheses were usually correctly stated with most students using a one-tailed test. On some occasions students are writing these hypotheses in words rather than using appropriate notation. Most students were able to select and use the correct Binomial distribution. Many, however, then calculated P(X = 11) or incorrectly attempted P(X >= 11) = 1 – P(X <= 11). Of the students who gained the A mark for the probability 0.16, the conclusion was usually correct and mostly given in sufficient contextual detail. Those students who used a critical region approach generally did less well, as most omitted the required p-value and scored a maximum of 3 marks. relevant probabilities at some point in part (b). A few students gave a probability rather than a region as their final answer here.
Common mistakes
H0: p = 0.2, H1: p > 0.2 in terms of p (not words)
do not reject H0, insufficient evidence for Jayda's belief, in context
a critical-region approach without the p-value scores at most 3
June 2025 · AS Paper 2 (Statistics) · Q3(b)(ii)2 marks
Mark scheme (whole question; this part is marked with the orange bar)
Examiner's comment
In (b)(ii) students appeared unfamiliar with the vocabulary ‘acceptance region’. A very common mistake was an attempt to find the critical region. It was not uncommon to see P(X <= 12 ) = 0.9568 followed by an acceptance region of X >= 13. Those who did realise that the acceptance region was not the same as the critical region often reverted to a 2-tailed approach. Students were able to earn the method mark here by calculating one or more relevant probabilities at some point in part (b). A few students gave a probability rather than a
Common mistakes
acceptance region is the complement of the critical region: P(X ≤ 12) = 0.9568 > 0.95 so 0 ≤ X ≤ 12
common errors: giving the critical region X ≥ 13, switching to a two-tailed test, giving a probability statement instead of a region
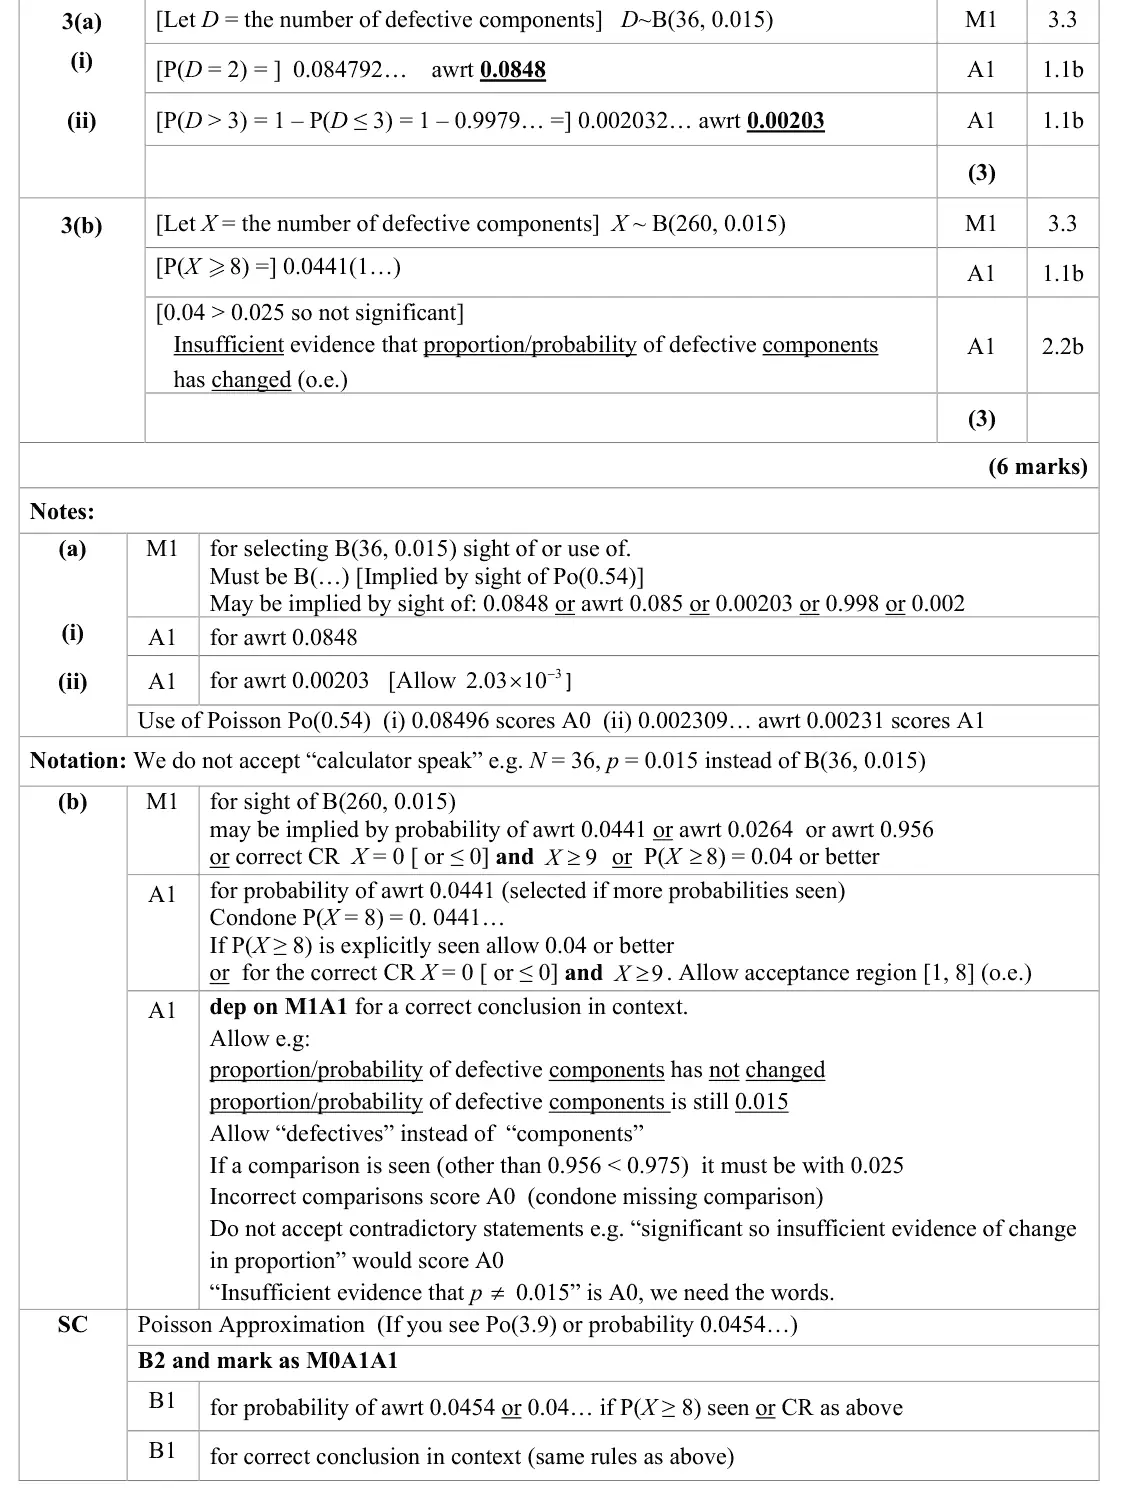
June 2025 · Paper 3 (Statistics) · Q3(b)3 marks
Mark scheme (whole question; this part is marked with the orange bar)
Examiner's comment
In part (b) most responses had the correct binomial model or inferred it by stating a suitable probability. A common mistake though was to use P(X = 8) rather than 𝑃𝑃(𝑋𝑋⩾8) which did not gain either of the remaining marks. Those with the correct probability sometimes gave a comparison with 0.05 rather than 0.025 and did not gain the final mark and others did not give a conclusion in context. Although a critical region was not required here (we will only ask for this if it can be found using the tables provided) some did use this approach. Many were successful but a few did not give both tails of the critical region and others did not state the critical region properly for example by just stating ( ) P 9 0.0177... X = and not writing the critical region as 𝑋𝑋⩾9 and X = 0. A small number attempted to use a normal approximation here.
Common mistakes
X ~ B(260, 0.015)
use P(X ≥ 8) = 0.0441, not P(X = 8)
two-tailed so compare with 0.025, not 0.05
conclusion in context (insufficient evidence the proportion of defective components has changed)
a critical region needs both tails
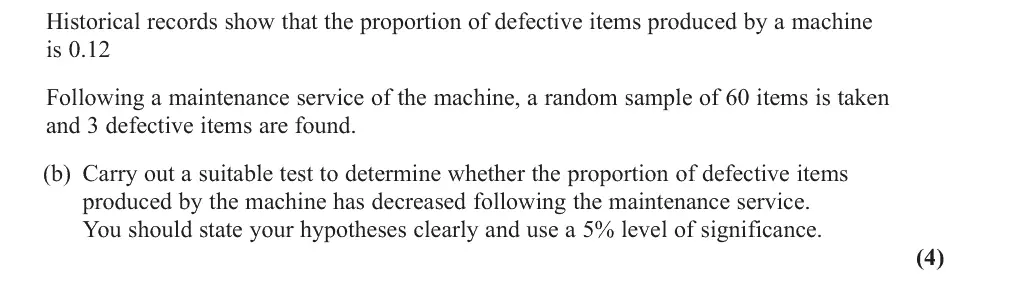
June 2024 · AS Paper 2 (Statistics) · Q4(b)4 marks
Mark scheme (whole question; this part is marked with the orange bar)
Examiner's comment
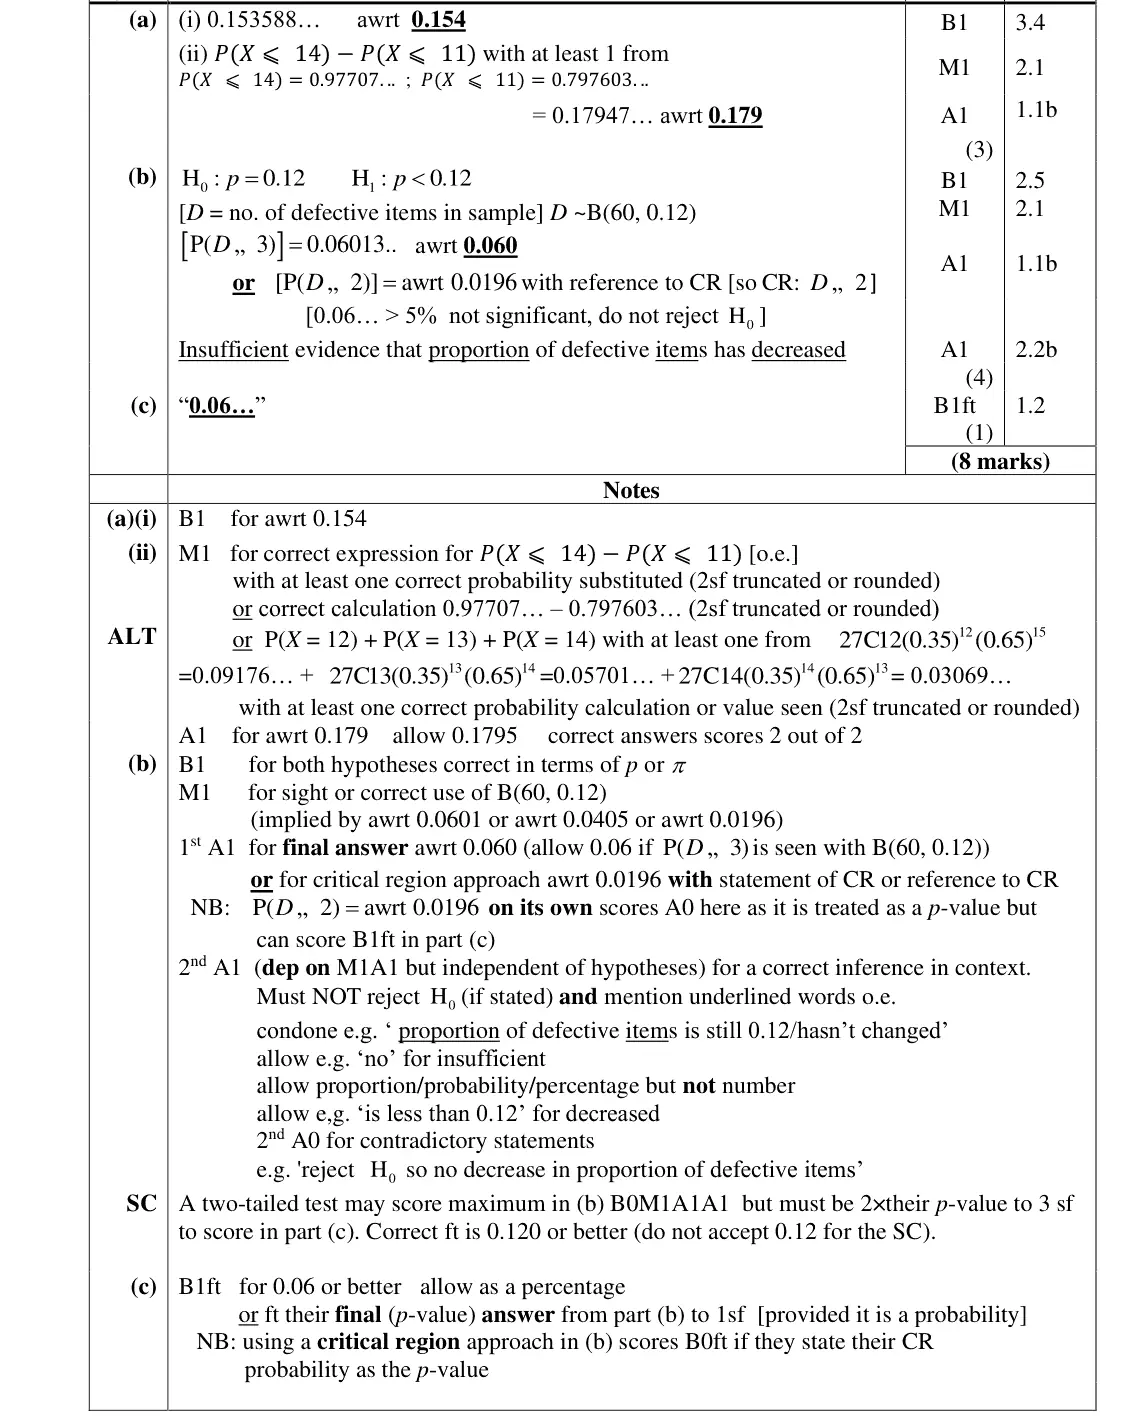
For those who attempted part (b), this was answered much better than in previous series and students are becoming more familiar with the structure of these questions, writing the hypotheses in terms of p and the distribution clearly. Sometimes the probability statements were not clearly stated, with students writing down the values that they had inputted into their calculators. It was quite common to see P(𝑋 < 3) or P(𝑋 = 3) rather than P(𝑋 <= 3) calculated. The conclusion was not always given in context. When the context was given, it was usually correct, although missing out the word “proportion” or its equivalent meant the mark was lost. Some students chose to use a critical region approach rather than a p-value approach, but they often did not make this clear and some were then unsure about whether 3 was inside or outside the critical region and what this implied for the acceptance or otherwise of H0 Part (d) was frequently omitted or the value p = 0.12 given. Those who used the critical region approach rarely got this mark. However, students are becoming more aware of what the p-value represents.
do not reject H₀: insufficient evidence that the proportion of defective items has decreased
conclusion in context with "proportion"
CR approach must be made clear (CR D ⩽ 2)
June 2024 · Paper 3 (Statistics) · Q4(a)4 marks
Mark scheme (whole question; this part is marked with the orange bar)
Examiner's comment
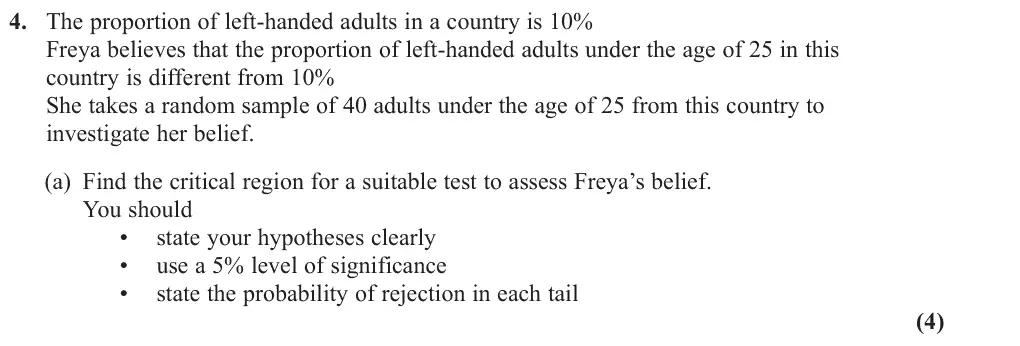
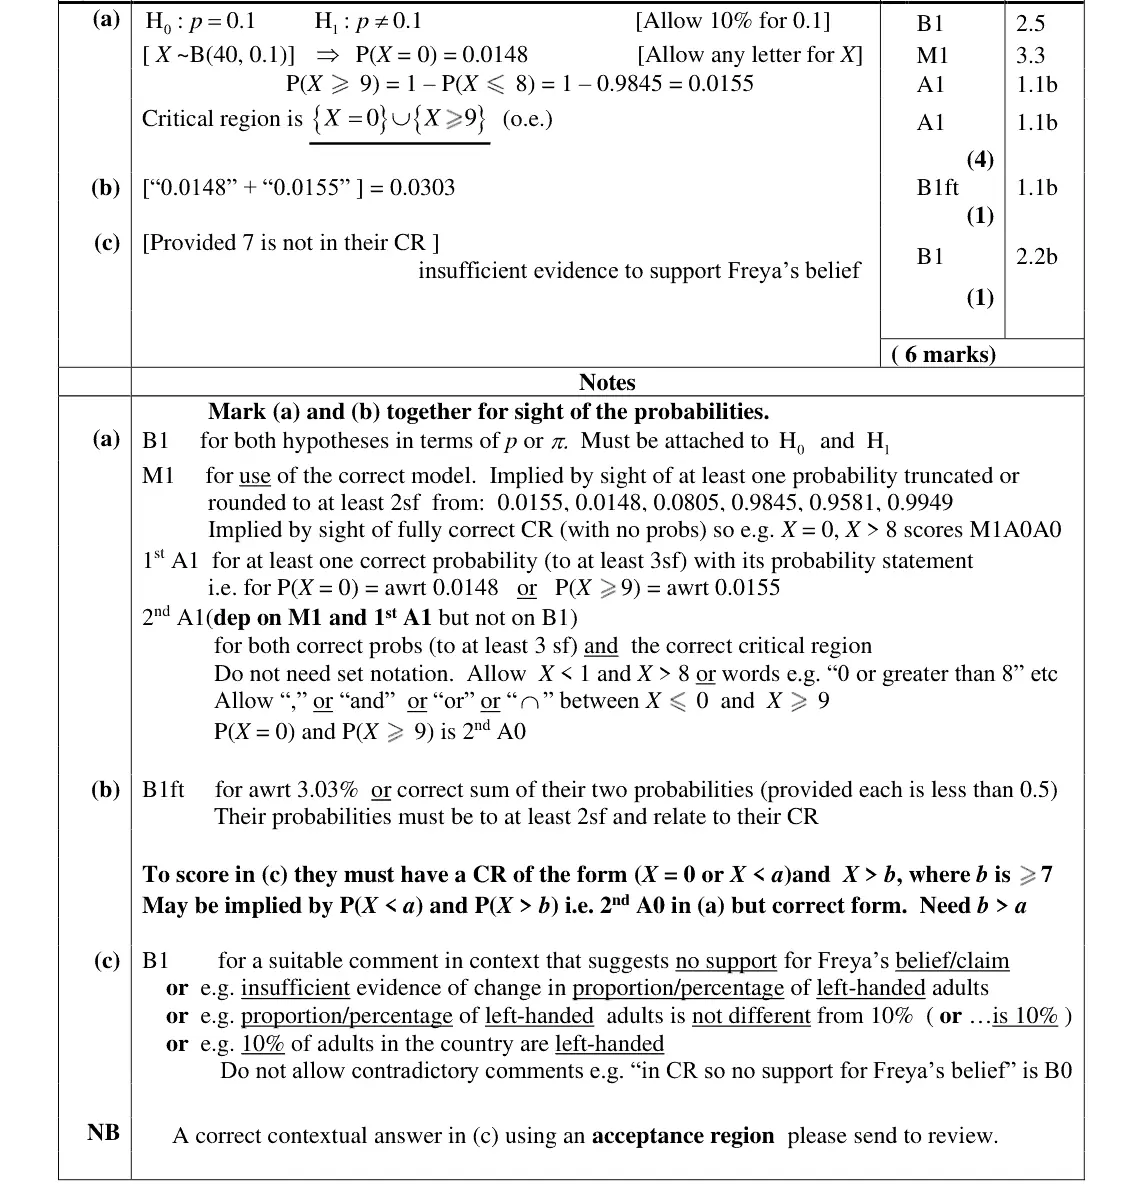
In part (a) most gave the hypotheses correctly in terms of p though some failed to have the H0 and H1 labels and some had p = 0 for the null hypothesis perhaps confusing this with a test for correlation. Most used the correct distribution to try and find the critical region but notation was often poor with P(X = 8) being written when P(X ⩽ 8) was meant or calculated and a number struggled to find P(X ⩾ 9) correctly leading to upper tails of the critical region of X ⩾ 8 or X ⩾ 10. There were many errors with the probabilities in each tail with P(X = 0) = 0.0147 (a truncated answer) frequently seen instead of 0.0148 the correct rounded value. Students don’t seem to be aware that the table function on their calculator truncates values rather than rounding them. Some students gave their critical regions inside probability statements and of course failed to secure the accuracy mark, and some didn’t think that X = 0 was a valid part of the critical region and omitted this from their answer. Many students who had identified a critical region were able to add their tail probabilities to give the significance level, but some merely wrote down 0.025 or doubled the probability of 0.0155 found in part (a). this against their probabilities of 0.0148 or 0.0155 from part (a).
CR X = 0 or X ≥ 9, not inside probability statements and not omitting X = 0
June 2024 · Paper 3 (Statistics) · Q4(c)1 mark
Mark scheme (whole question; this part is marked with the orange bar)
Examiner's comment
In part (c) some students didn’t have a critical region of the correct form and were unable to access this mark. Others simply said that they would “accept H0” without any attempt to give a contextual conclusion and some thought that because the test was not significant Freya’s belief was therefore correct. A few students incorrectly used the probability 7 and then compared 40 this against their probabilities of 0.0148 or 0.0155 from part (a).
Common mistakes
7 not in the CR so insufficient evidence to support Freya's belief, in context
"accept H₀" alone not enough
not significant does not mean her belief is correct
do not use 7/40
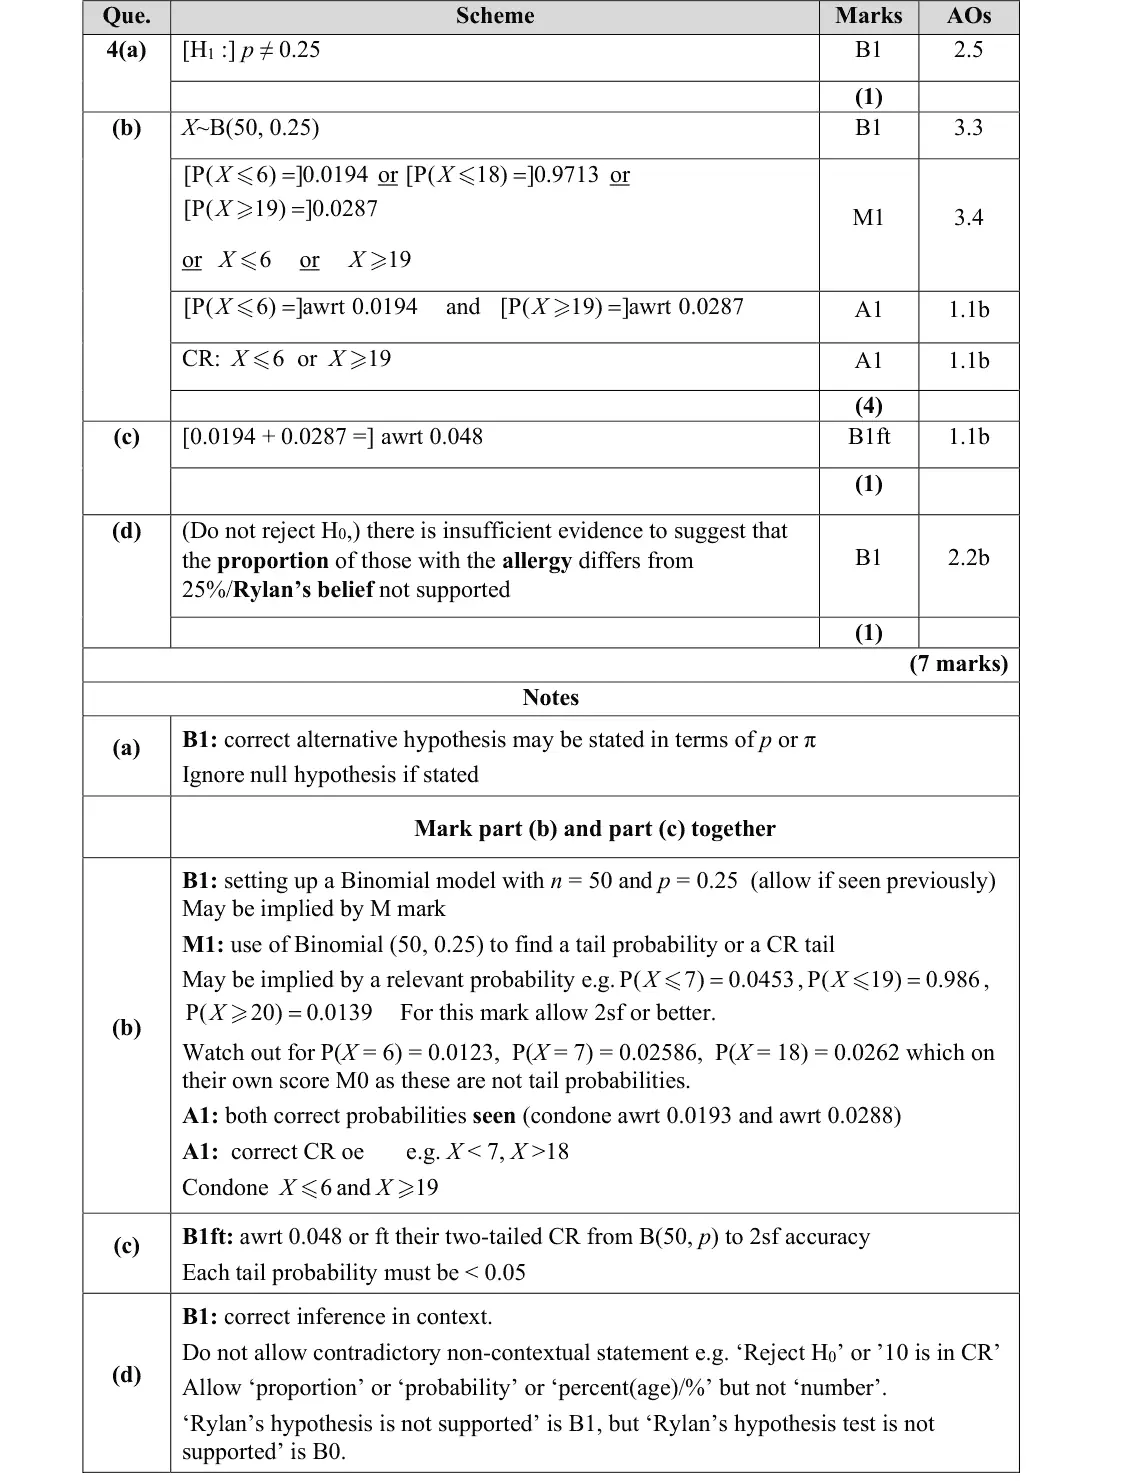
June 2023 · AS Paper 2 (Statistics) · Q4(a)1 mark
Mark scheme (whole question; this part is marked with the orange bar)
Examiner's comment
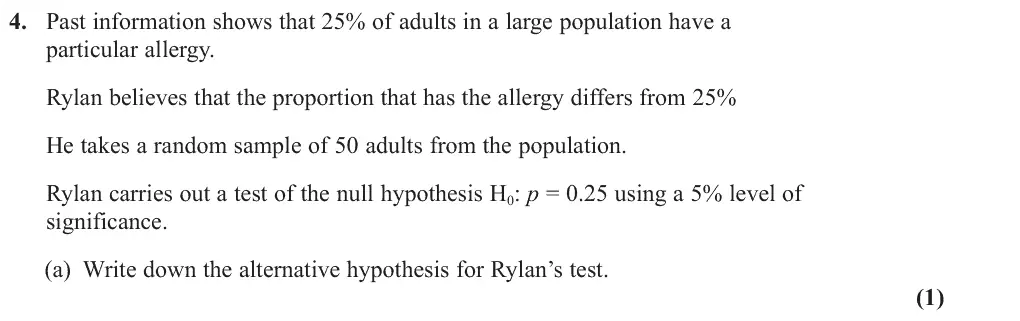
There were some good attempts seen at this question with most students able to display some knowledge of hypothesis testing. Part (a) was very well answered with most students scoring this mark for a correct alternative hypothesis using the correct notation. A few students did not appreciate that this was a two- tailed test and gave a one-tailed alternative hypothesis.
Common mistakes
two-tailed: H1: p ≠ 0.25 in terms of p
some gave a one-tailed H1
June 2023 · AS Paper 2 (Statistics) · Q4(b)4 marks
Mark scheme (whole question; this part is marked with the orange bar)
Examiner's comment
There were some good attempts seen at this question with most students able to display some knowledge of hypothesis testing. In part (b), when attempted, most students acknowledged that it was a Binomial distribution and many were able to find the probability associated with at least one of the tails (usually the lower one). However, some did not take notice in the question that the probability in each tail was required to be as close to 2.5% as possible, and hence found an incorrect upper critical region. Marks were sometimes lost for failing to state the probability associated with each tail (particularly the upper tail) and for incorrectly identifying the upper critical region, usually opting for X >= 20. There are a significant number of students writing the critical region as a probability. Many students with an incorrect critical region were still able to earn the mark in
Common mistakes
X ~ B(50, 0.25)
P(X ≤ 6) = 0.0194 and P(X ≥ 19) = 0.0287 must both be stated
CR X ≤ 6 or X ≥ 19 (X ≥ 20 common error)
point probabilities such as P(X = 6) are not tail probabilities
CR written as a probability
June 2023 · AS Paper 2 (Statistics) · Q4(c)1 mark
Mark scheme (whole question; this part is marked with the orange bar)
Examiner's comment
There were some good attempts seen at this question with most students able to display some knowledge of hypothesis testing. part (c) using the correct probabilities for their tails.
Common mistakes
actual significance level = sum of the two tail probabilities = 0.048 (ft their CR)
June 2023 · AS Paper 2 (Statistics) · Q4(d)1 mark
Mark scheme (whole question; this part is marked with the orange bar)
Examiner's comment
There were some good attempts seen at this question with most students able to display some knowledge of hypothesis testing. Part (d) was answered well by many students, but, as usual, some did not interpret the conclusion in context. Some ignored the hypothesis test and critical regions altogether and simply compared 10 as a percentage of 50 with 25% to suggest a change in probability.
Common mistakes
10 is not in the CR: do not reject H0
conclusion in context (proportion with the allergy, Rylan's belief not supported)
comparing 10/50 = 20% with 25% instead of using the CR
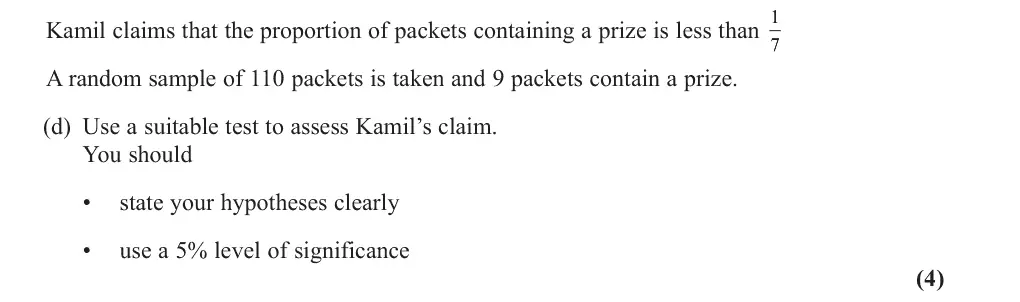
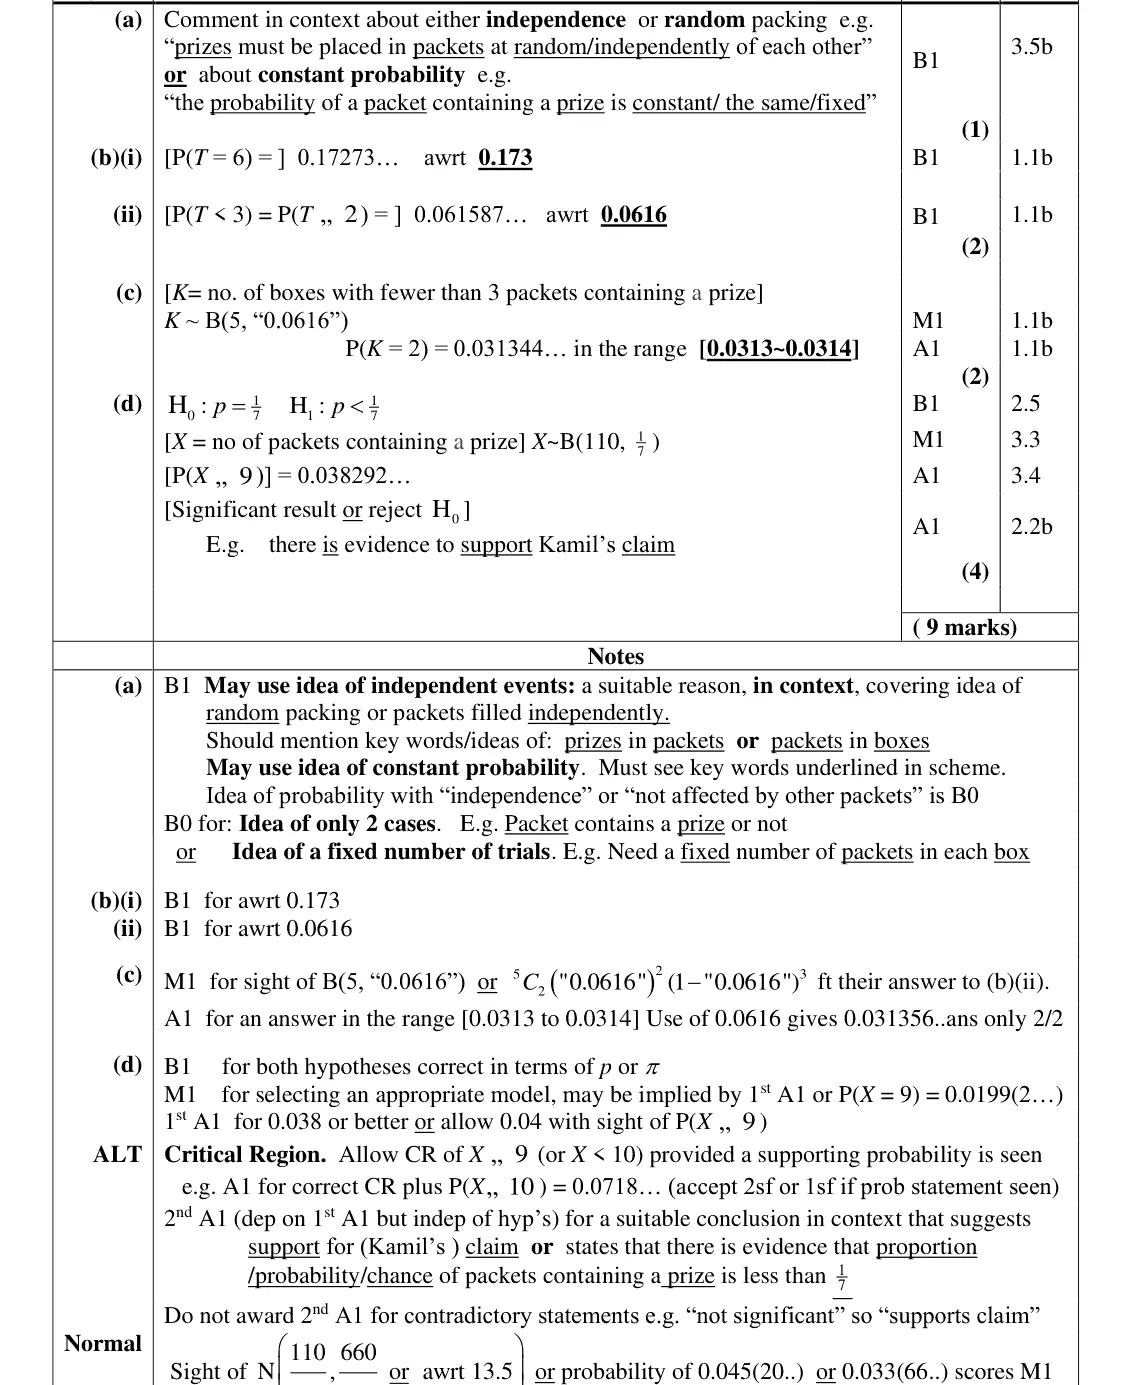
June 2023 · Paper 3 (Statistics) · Q2(d)4 marks
Mark scheme (whole question; this part is marked with the orange bar)
Examiner's comment
This question was also answered well. The hypothesis test in part (d) was answered well with correct notation used for the hypotheses and the appropriate one-tailed test identified. Most selected the correct binomial model but it was disappointing to see a number finding P(X = 9) rather than P(X ⩽ 9). A correct conclusion in context was often given: some using the simple response that there is evidence to support Kamil’s claim and others stating that there was 1 evidence that the proportion of packets containing a prize is less than 7. It was encouraging to see that most of those using the second approach were referring to “proportion” rather than “number of” this time.
Common mistakes
H0: p = 1/7, H1: p < 1/7 (one-tailed)
use P(X ≤ 9) = 0.0383, not P(X = 9)
conclusion in context about the proportion, not the number, of packets
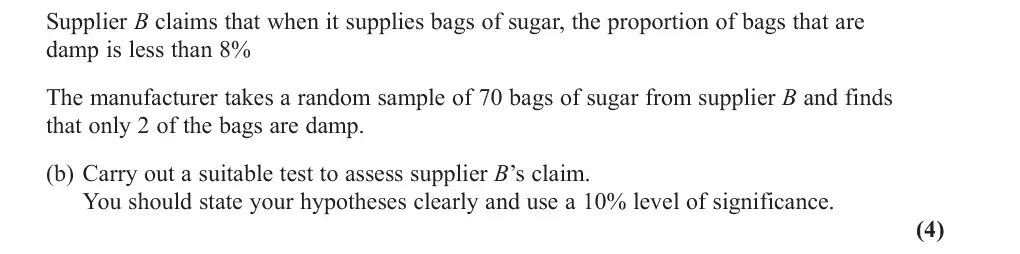
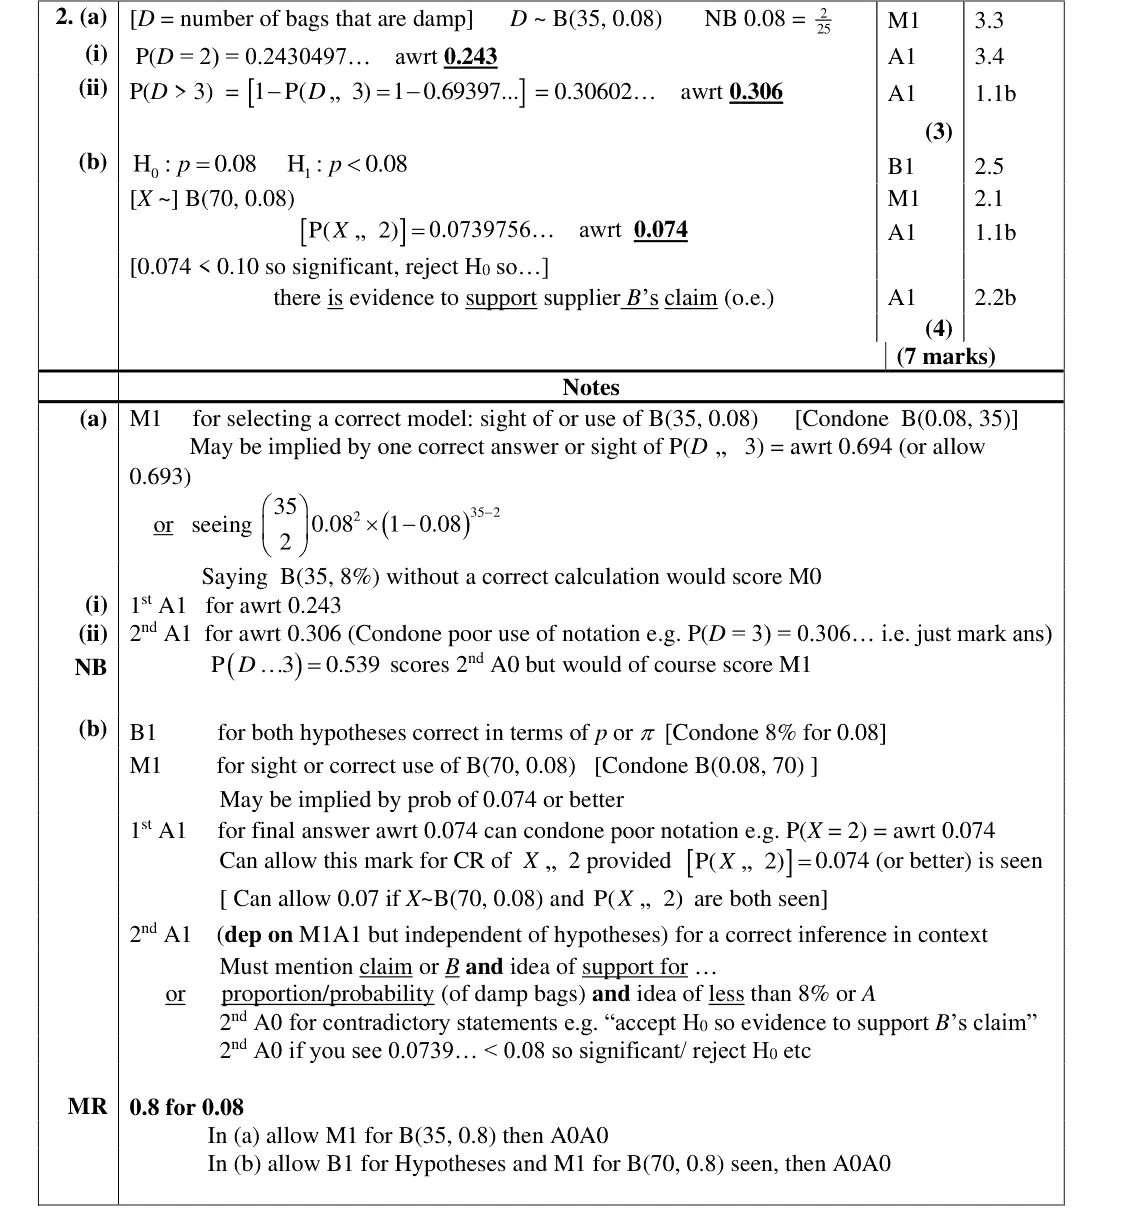
June 2022 · AS Paper 2 (Statistics) · Q2(b)4 marks
Mark scheme (whole question; this part is marked with the orange bar)
Examiner's comment
about which function to use on their calculator and ending up with P(D = 3). In part (b) the hypotheses were usually correctly stated using p and a correct model selected. Most obtained the correct probability although some found P(X = 2) rather than P(X „ 2). The correct decision was usually made but some failed to give a suitable contextual conclusion: the simplest description mentioned that there was evidence to support supplier B’s claim but other chose to talk about damp bags and often referred to the “number of bags” rather than the “proportion” decreasing. This type of question is now fairly familiar on these papers but there were a number of students who did not seem to have covered the topic of hypothesis testing and nearly 15% scored zero on this question.
conclusion in context about the proportion (not the number) of damp bags, supporting B's claim
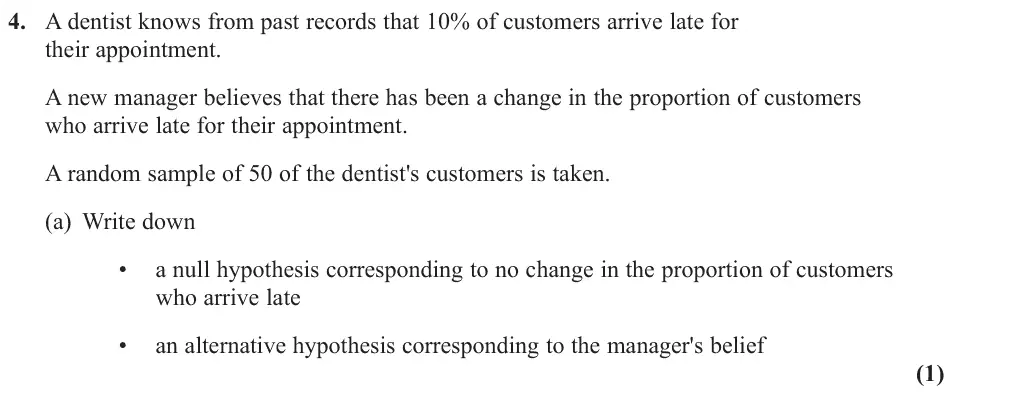
June 2022 · Paper 3 (Statistics) · Q4(a)1 mark
Mark scheme (whole question; this part is marked with the orange bar)
Examiner's comment
Part (a) was well answered with the majority of students writing their hypotheses in terms of p.
Common mistakes
H0: p = 0.1, H1: p ≠ 0.1 in terms of p (two-tailed for "a change")
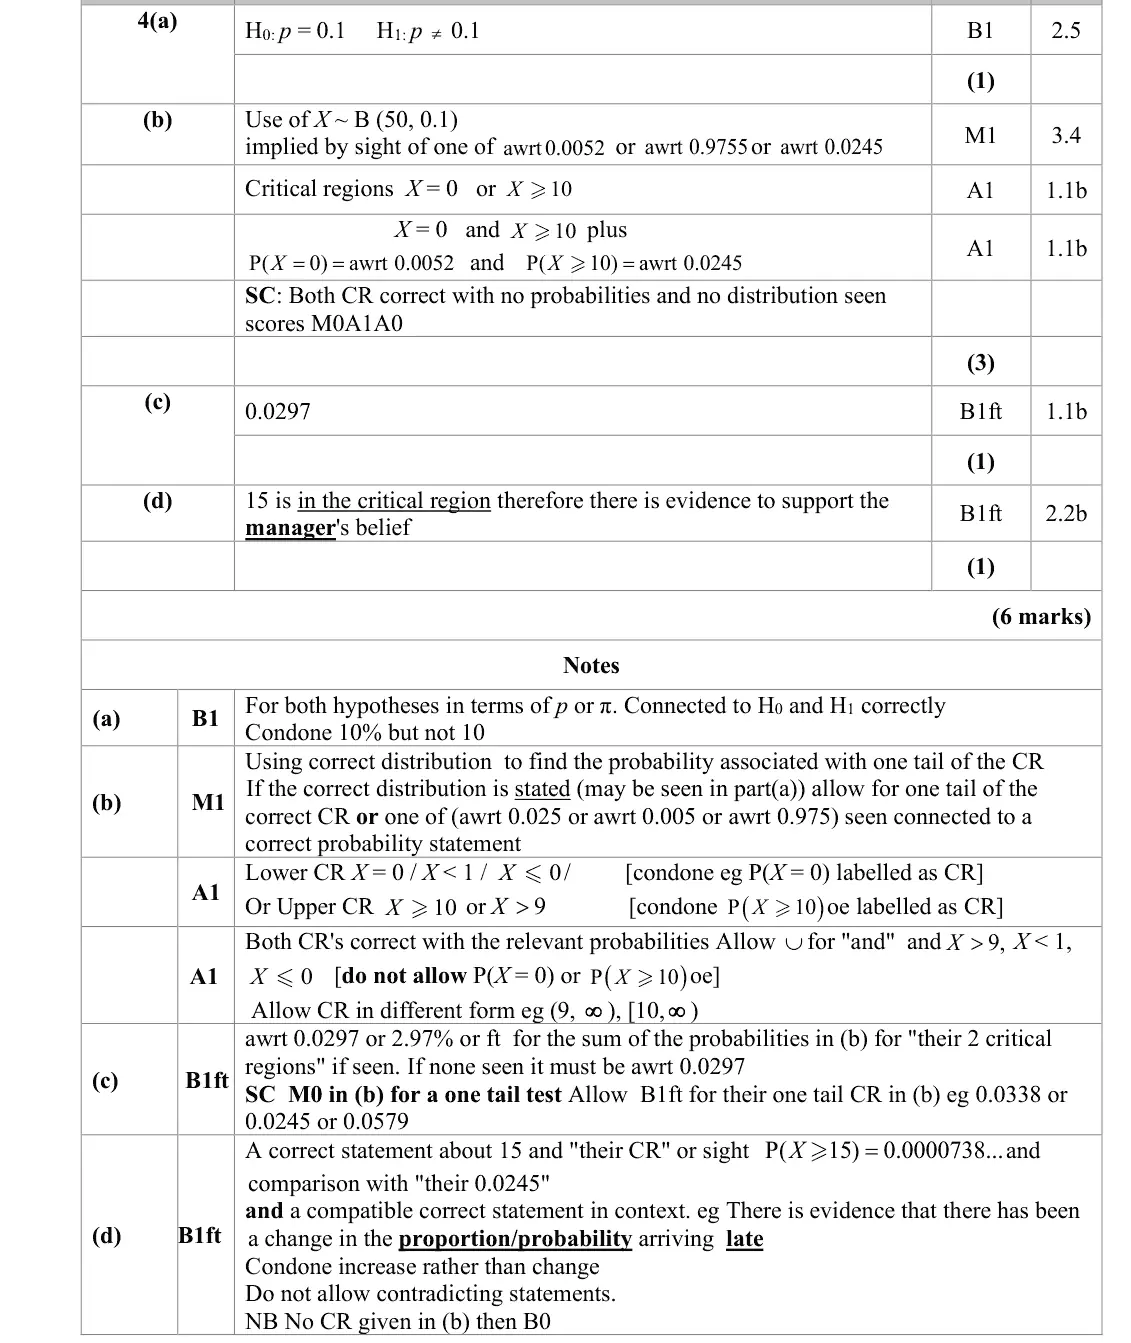
June 2022 · Paper 3 (Statistics) · Q4(b)3 marks
Mark scheme (whole question; this part is marked with the orange bar)
Examiner's comment
Part (b) proved to be a challenge for many of the students with a reasonable proportion unable to even begin, which is unusual for a question of this nature – as it is quite standard. Most students were able to state the correct distribution and write some probabilities, but many were not able to identify correctly the CR from their probabilities. Responses scoring M1A1A1 were rare. This was often due students giving probability statements rather than giving a CR Other issues included: • giving probabilities to only 2 s.f. • selecting the region between the two Critical values as their CR Students who were aware of what a two-tailed CR looks like almost always got part (c) For those students who stated both tails of the critical region in (b), the majority correctly compared 15 with their critical region and then usually supported the manager. Others used the longer version of the contextual statement and most did so correctly.
Common mistakes
B(50, 0.1)
critical region X = 0 or X ≥ 10 with P(X = 0) = 0.0052 and P(X ≥ 10) = 0.0245
give regions not probability statements
not the region between the critical values
June 2022 · Paper 3 (Statistics) · Q4(d)1 mark
Mark scheme (whole question; this part is marked with the orange bar)
Examiner's comment
Part (a) was well answered with the majority of students writing their hypotheses in terms of p. Part (b) proved to be a challenge for many of the students with a reasonable proportion unable to even begin, which is unusual for a question of this nature – as it is quite standard. Most students were able to state the correct distribution and write some probabilities, but many were not able to identify correctly the CR from their probabilities. Responses scoring M1A1A1 were rare. This was often due students giving probability statements rather than giving a CR Other issues included: • giving probabilities to only 2 s.f. • selecting the region between the two Critical values as their CR Students who were aware of what a two-tailed CR looks like almost always got part (c) correct. The students who did not really understand the idea of the correct CR seemed to make a fairly random guess at the actual significance level. For those students who stated both tails of the critical region in (b), the majority correctly compared 15 with their critical region and then usually supported the manager. Others used the longer version of the contextual statement and most did so correctly.
Common mistakes
15 is in the critical region so there is evidence of a change in the proportion arriving late
conclusion in context, no contradictions
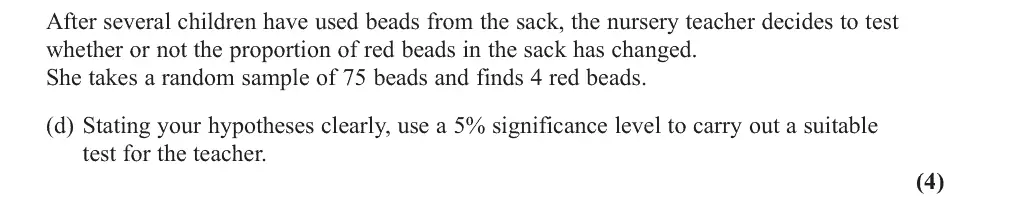
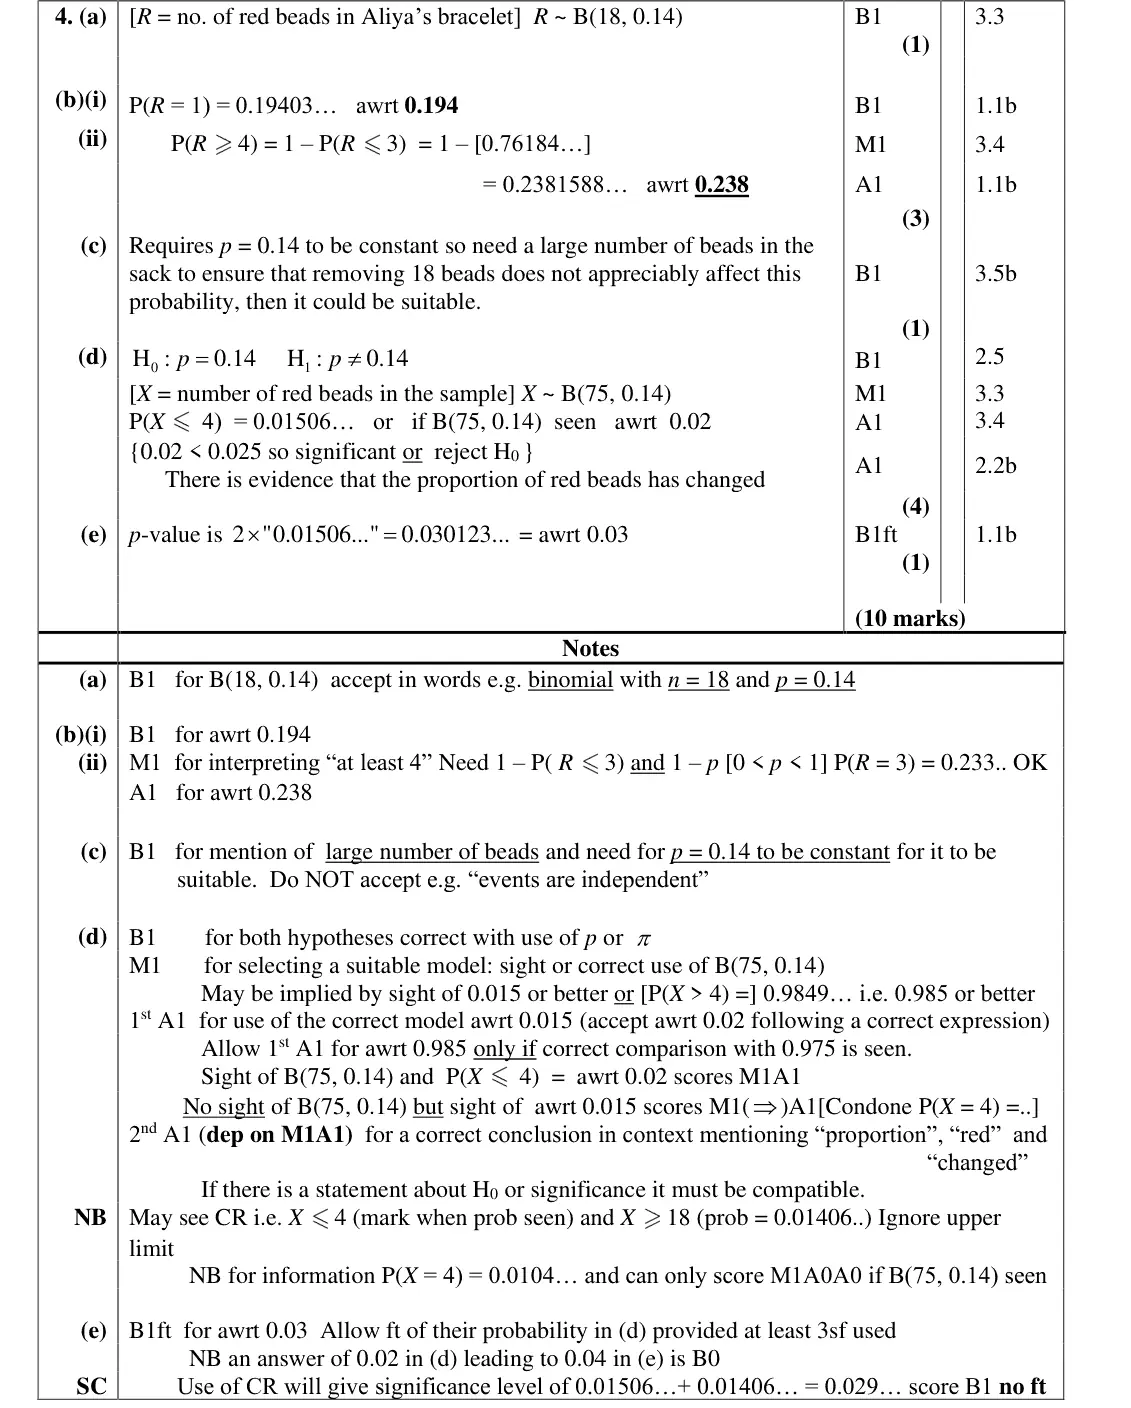
Oct 2021 · AS Paper 2 (Statistics) · Q4(d)4 marks
Mark scheme (whole question; this part is marked with the orange bar)
Examiner's comment
Part (d) was a standard binomial hypothesis test and most students stated correct hypotheses and a correct model. There was still some confusion about the appropriate probability to calculate and a significant number found P(X = 4) rather than P( X „ 4). Those who did find the correct probability were usually able to give a correct conclusion in context which is encouraging however few knew what the p- value was in part (e).
Common mistakes
two-tailed: H₀ p = 0.14, H₁ p ≠ 0.14
X ~ B(75, 0.14)
P(X ≤ 4) = 0.0151 compared with 0.025, not P(X = 4)
conclusion in context: evidence the proportion of red beads has changed
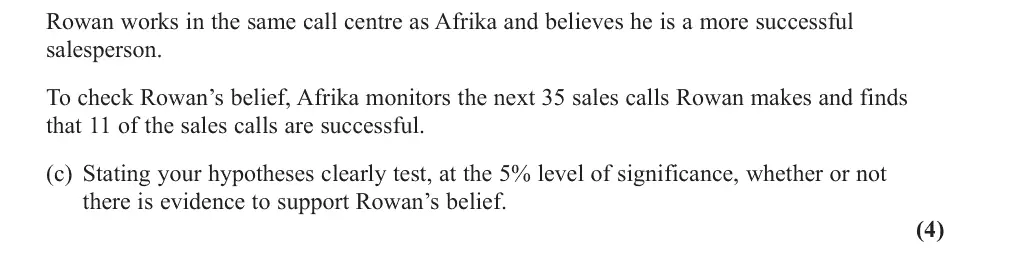
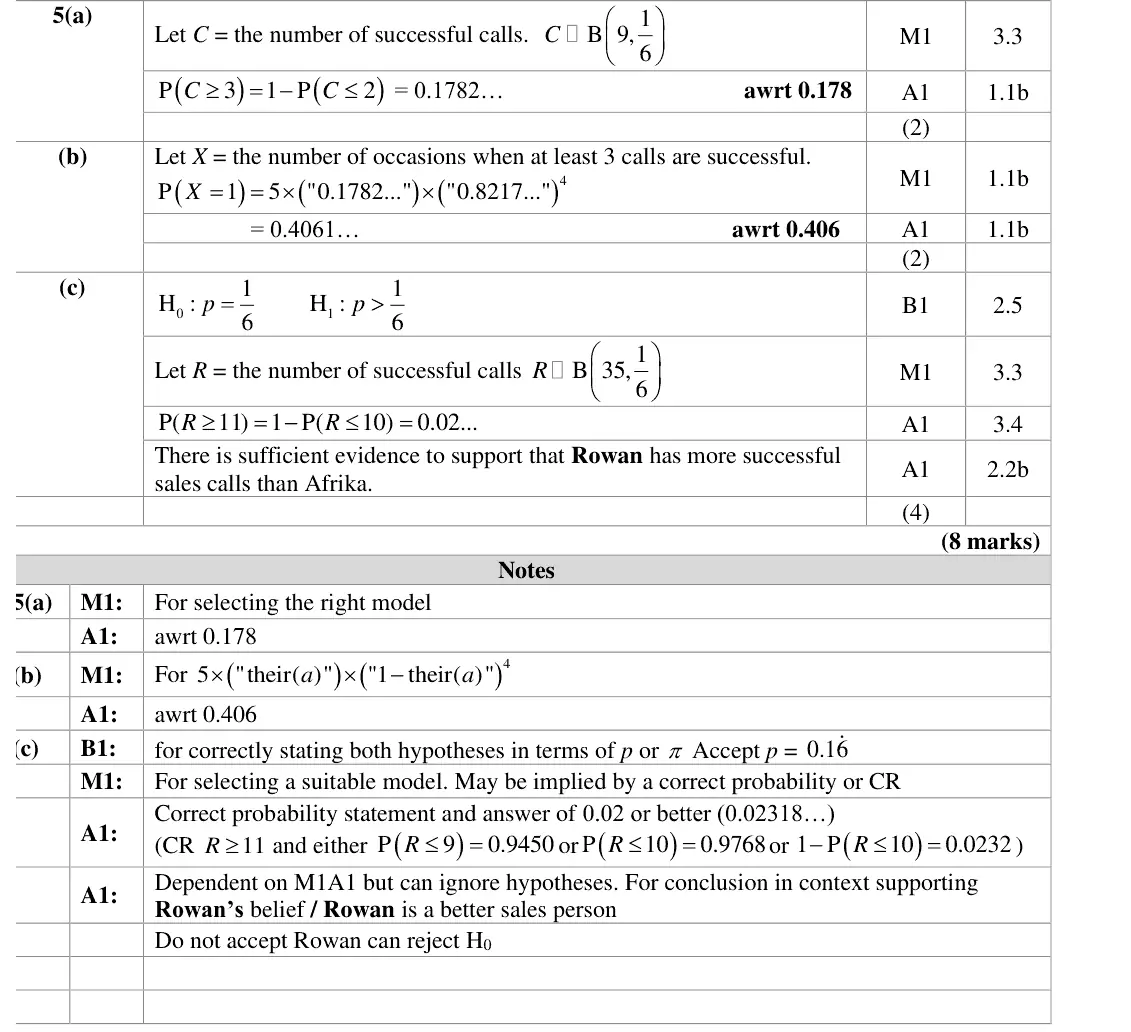
Oct 2020 · AS Paper 2 (Statistics) · Q5(c)4 marks
Mark scheme (whole question; this part is marked with the orange bar)
Examiner's comment
This question required the binomial distribution and it was pleasing to see that around 65% of candidates were able to recognise the distribution required in Again in part (c) many candidates gave the correct model, but fewer were able to write down the hypotheses correctly. Of those who progressed to the end, most evaluated the required probability, but a not insubstantial minority worked out the probability of exactly eleven. The great majority of those who found the correct probability then went on to give the correct answer in context.
Common mistakes
H0: p = 1/6, H1: p > 1/6 in terms of p
R ~ B(35, 1/6)
P(R ≥ 11) = 0.0232 < 0.05 (not P(R = 11))
conclusion in context supporting Rowan's belief, "reject H0" alone not enough
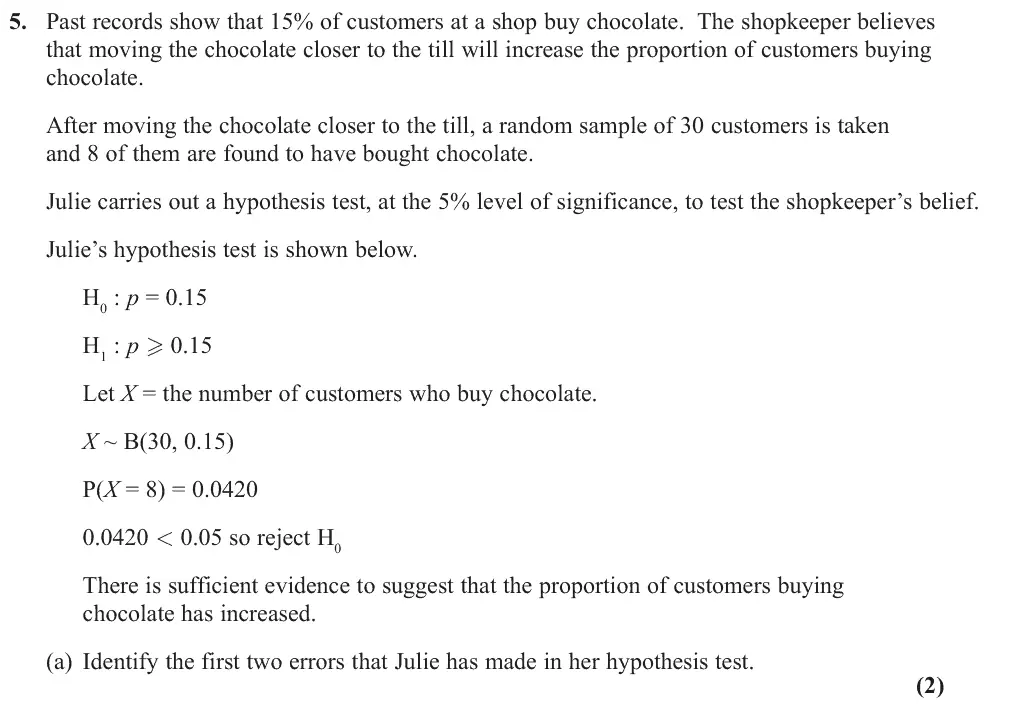
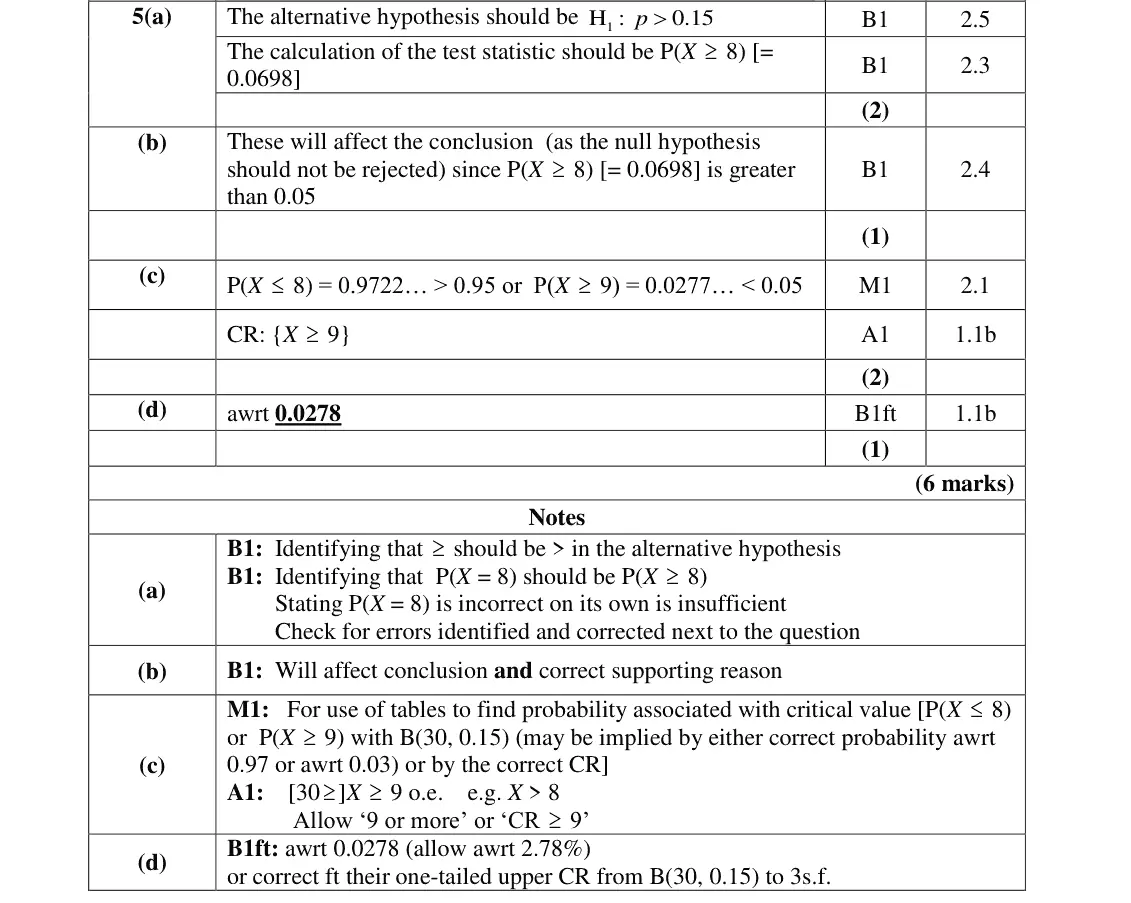
June 2019 · AS Paper 2 (Statistics) · Q5(a)2 marks
Mark scheme (whole question; this part is marked with the orange bar)
Examiner's comment
Only the most able candidates on the paper made significant progress through this question on hypothesis testing. In part (a) the first error in writing down the alternative hypothesis was identified and corrected more often than the error in the probability statement. Some candidates lost the marks by identifying where the error was but without correctly identifying what the error was. It was not uncommon for candidates to say that the probability distribution was used rather than the cumulative distribution; likely referring to calculator functions rather than demonstrating a formal understanding of hypothesis testing.
Common mistakes
H₁ should be p > 0.15 (not ≥)
the test statistic should be P(X ≥ 8) = 0.0698, not P(X = 8)
say what the correct version is, not just where the error is
June 2019 · AS Paper 2 (Statistics) · Q5(b)1 mark
Mark scheme (whole question; this part is marked with the orange bar)
Examiner's comment
Only the most able candidates on the paper made significant progress through this question Part (b) was less successfully done and where attempted the mark was not always awarded because insufficient details of the calculation and its implication were given. Despite the question stating the test should be one-tailed in part (c) some candidates found a
Common mistakes
it does affect the conclusion: P(X ≥ 8) = 0.0698 > 0.05 so H₀ is not rejected
the probability must be quoted with its comparison
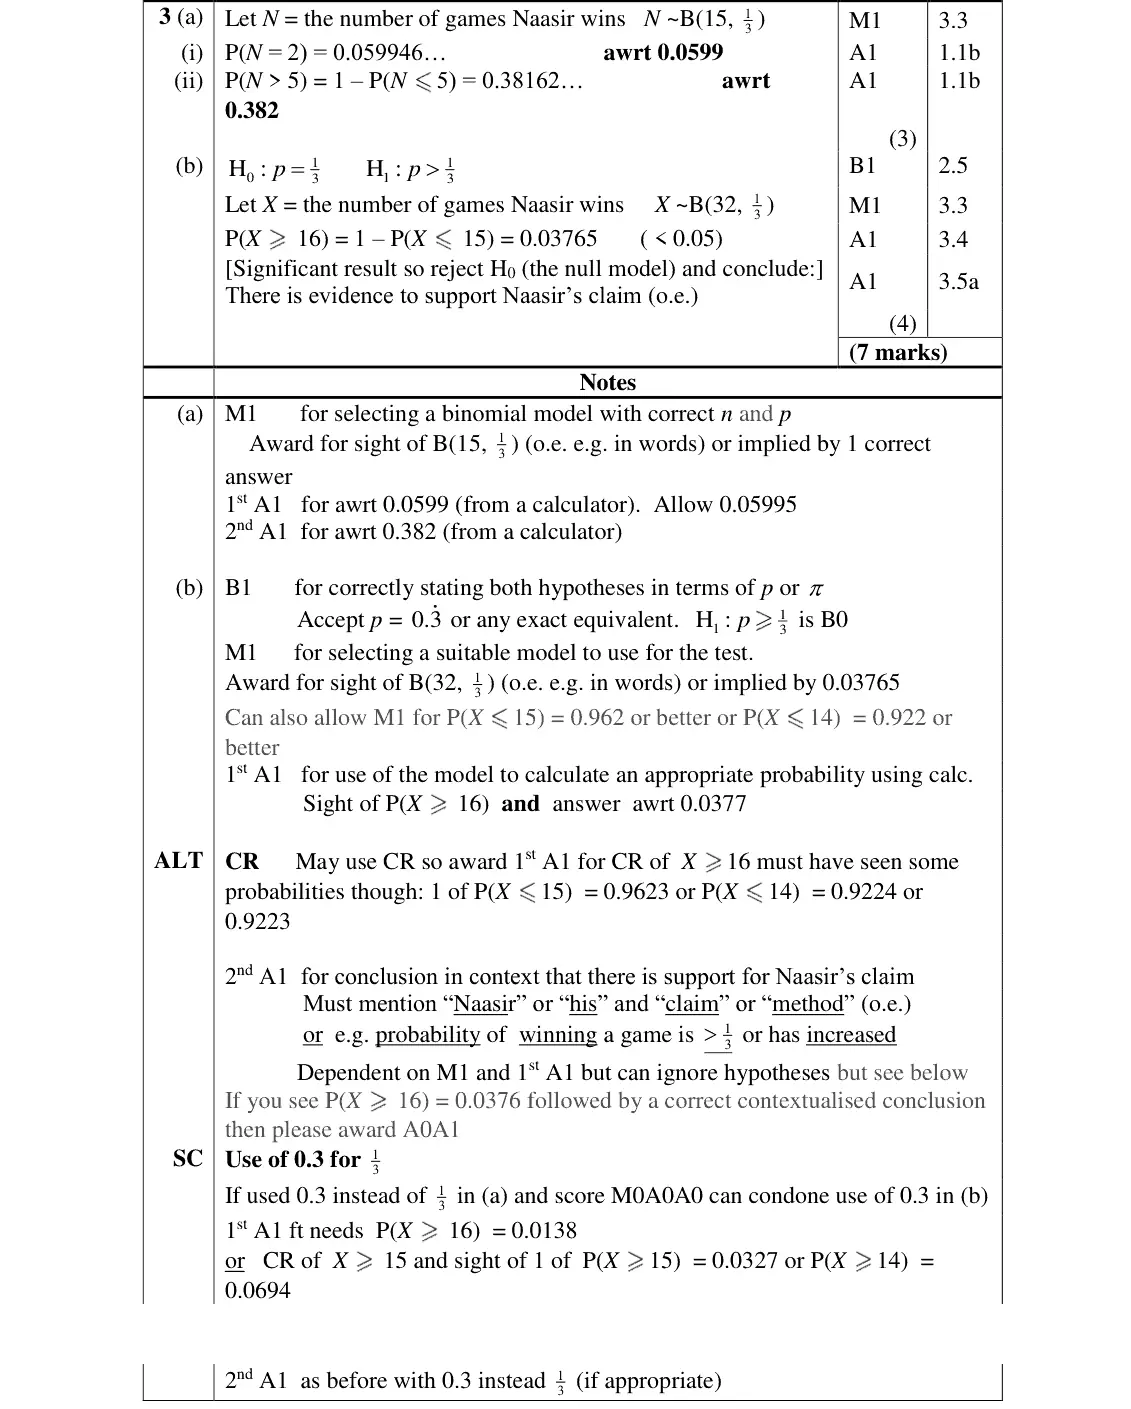
June 2018 · AS Paper 2 · Q3(b)4 marks
Mark scheme (whole question; this part is marked with the orange bar)
Examiner's comment
In the new specification, students are required to evaluate binomial probabilities using their using a formula, part (ii) was not feasible that way . In the hypothesis test in part (b), the hypotheses were usually given in terms of p and most identified the correct model to use B(32, 1 3 ). A correct probability calculation did not always follow: some found P(X = 16) instead of P(X … 16) and we would usually expect values to be given to 3 significant figures, but some students gave no value at all simply stating that the probability was < 0.05. In order to award the mark we do need sufficient evidence that the correct value has been obtained. The final mark of a hypotheses test will always require a correct conclusion in context: in this case a statement saying there is evidence to support Naasir’s claim is all that we expected.
Common mistakes
H0: p = 1/3, H1: p > 1/3 (not p ≥ 1/3)
X ~ B(32, 1/3)
P(X ≥ 16) = 0.0377 < 0.05, not P(X = 16)
give the probability value, not just "< 0.05"
conclusion in context: evidence to support Naasir's claim
Find an Edexcel maths tutor
Stuck on this? Book a trial session with an Edexcel specialist.